How to Create a Dashboard in ObserveOps
ObserveOps lets you create multiple dashboards, each with its own set of widgets and purpose. Use them to view and analyze data from different sources in one place — a separate dashboard for AWS Cloud, network devices, servers, or a specific use case such as disk utilization.
To view customized data, first create a dashboard and then add widgets to it.
Navigation
Go to Main Menu and select Dashboards. The dashboard selector panel opens.
Select + in the top-right corner of the panel to open the Create Dashboard panel.
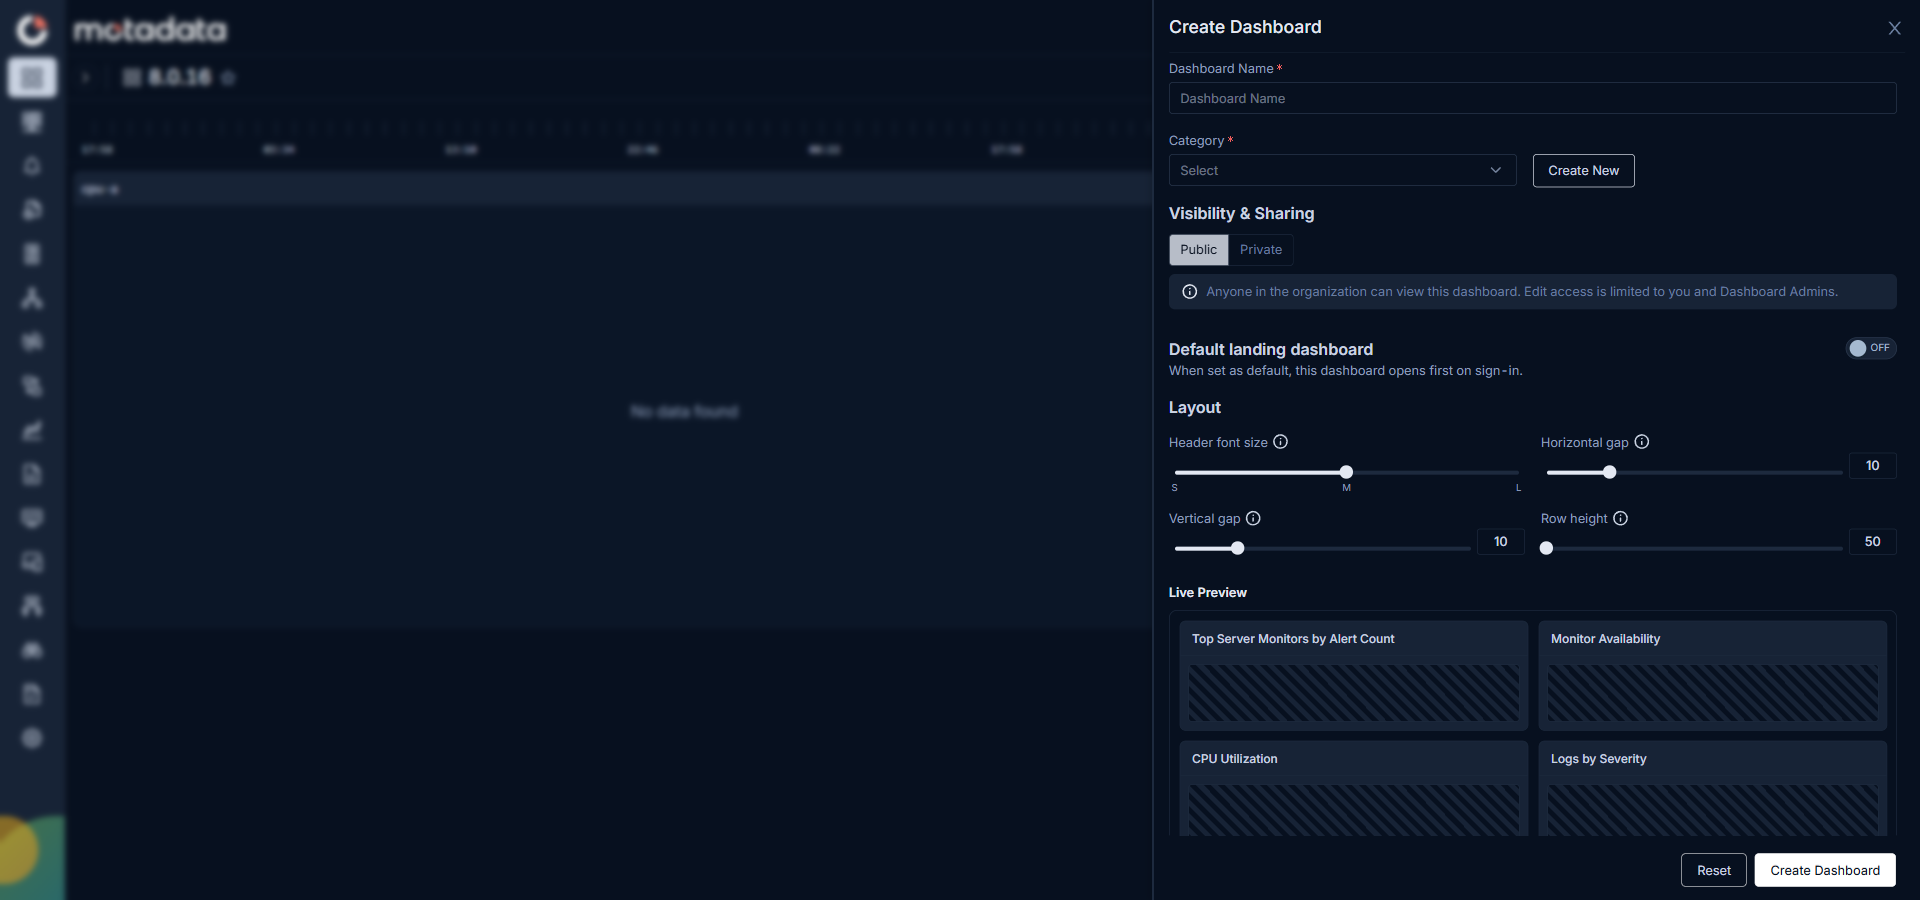
Create Dashboard Fields
Fill in the following fields to configure your new dashboard:
| Field | Description |
|---|---|
| Dashboard Name | Enter a unique name that identifies this dashboard across all categories. |
| Category | Select an existing category to group the dashboard, or select Create New to add a new category. |
| Visibility & Sharing | Select Public to make the dashboard visible to all users in the organization. Edit access remains limited to you and Dashboard Admins. Select Private to restrict visibility to specific users you choose. |
| Default landing dashboard | Enable this toggle to make this dashboard the first screen users see when they navigate to Dashboards. When enabled, this dashboard opens automatically on sign-in. |
| Header font size | Select S, M, or L to set the font size for each widget's title bar. |
| Horizontal gap | Set the horizontal spacing between widgets using the slider. |
| Vertical gap | Set the vertical spacing between widgets using the slider. |
| Row height | Set the default height for each widget row using the slider. |
The Live Preview section at the bottom of the panel shows placeholder widgets laid out with the current Layout settings, so you can see how the grid will look before you save.
Select Create Dashboard to save the dashboard with the settings you chose.
Select Reset to clear all fields and start over.
After you create the dashboard, it opens as an empty canvas. You can now add widgets to start displaying data.
Set a Default Landing Dashboard
A default landing dashboard opens automatically when a user navigates to Dashboards. You can set a default landing dashboard for yourself or, if you have permission, for other users when you create or edit a dashboard.
Set the Default Landing Dashboard During Creation
- Open the Create Dashboard panel (follow the Navigation steps above).
- Turn on the Default landing dashboard toggle. Two options appear.
- Choose one of the following:
- Only for me. This dashboard opens first when you sign in, unless an Administrator has assigned a default for you. Teammates' defaults stay unchanged.
- For specific users. Pick exactly who gets this dashboard as their default. Everyone else keeps theirs.
- If you pick For specific users, select the users who should see this dashboard as their default.
- Fill in the remaining dashboard fields and select Create Dashboard.
Set the Default Landing Dashboard When Editing
- Open the dashboard you want to set as the default.
- Select the Edit icon, or select Edit from the dashboard action menu.
- Turn on the Default landing dashboard toggle.
- Choose Only for me or For specific users.
- Select the users, if applicable.
- Select Save.
Default Landing Dashboard Rules
| Rule | Detail |
|---|---|
| One default per user | Each user has exactly one default landing dashboard. Setting a new default replaces the previous one. |
| Admin override | A user with admin permissions can set any user's default landing dashboard. |
| Own default | Every user can set their own default from the dashboard they are creating or editing. |
If you manage a NOC team, set the shared NOC dashboard as the default landing dashboard for all NOC operators at once using For specific users. Every operator then lands on the same view when they sign in.