Introduction to Motadata ObserveOps
Welcome to Motadata ObserveOps (formerly known as AIOps), your advanced solution for intelligent IT operations. Motadata ObserveOps is a powerful Artificial Intelligence for IT Operations platform designed to streamline and optimize your IT infrastructure management, ensuring a seamless and efficient IT environment.
Motadata ObserveOps is an all-in-one platform that combines the power of Artificial Intelligence (AI) and Machine Learning (ML) to provide you with deep insights into your IT infrastructure. It enables real-time monitoring, analysis, and proactive management of diverse IT components, including networks, servers, applications, logs, flows, and more.
Key Features and Capabilities
Metric Monitoring
Keep a close eye on your network devices, servers, and applications with comprehensive metric monitoring. Out-of-the-box templates for various networking vendors and support for virtualization and cloud environments make the process seamless.
With Metric Explorer, Motadata ObserveOps takes metric monitoring to the next level by providing an intuitive and user-friendly interface to explore and visualize the collected metric data. The Metric Explorer empowers you to deep dive into the performance metrics of your network devices, servers, and applications. You can analyze historical trends, compare data from different monitors, and correlate metrics to identify potential performance bottlenecks.
By leveraging the power of Metric Explorer, you can make data-driven decisions, identify anomalies, and take proactive measures to optimize your IT infrastructure's performance. This in-depth visibility into your network's health and performance enhances your ability to respond quickly to incidents, reducing downtime and maximizing the overall efficiency of your IT operations.
Log Monitoring
Motadata ObserveOps introduces the Log Explorer, a powerful feature that enhances your log monitoring experience by providing advanced log search and log analytics capabilities. Motadata ObserveOps empowers you to dynamically parse and visualize millions of lines of log data with its out-of-the-box inbuilt parsers. This feature allows you to efficiently process and centralize logs from applications, servers, agents, and network devices.
With the Log Explorer's intuitive log pattern matching, you can transform large chunks of log data into structured patterns of logs, simplifying the log analysis process. The machine learning-powered pattern matching enables you to identify specific logs that may indicate critical issues or potential threats.
Live Log Tailing: View the live tail of logs being generated in real-time, enabling you to monitor the most recent log events as they happen.
Surrounding Logs: Easily access surrounding logs related to a specific log event with just one click. This context-rich view assists in understanding the log's significance and impact on the system.
Log Pattern Matching: Utilize machine learning-powered log pattern matching to identify patterns and trends in logs, making it easier to detect anomalies and troubleshoot issues.
Keyword Search and Highlighting: Search and highlight required keywords from the live tail, allowing you to quickly spot relevant information and potential problems.

The Log Explorer streamlines log analysis, making it an indispensable tool for IT administrators and operators. By categorizing logs intelligently, it reduces context switching and enables quick troubleshooting. Additionally, you can create custom widgets on the go, displaying specific log data that you need to monitor regularly. Gain actionable insights from logs using dynamic log parsing and log pattern matching. The platform's log analytics capabilities help you spot anomalies and troubleshoot issues effectively.
Unlock the power of log monitoring with the Smart Log Explorer in Motadata ObserveOps, and take your log analysis capabilities to new heights. Whether you are investigating incidents or ensuring system stability, the Smart Log Explorer equips you with the insights needed to make informed decisions swiftly.
Flow Monitoring
Monitor network traffic with support for NetFlow, sFlow, and jFlow, and visualize flow data using default dashboards.
Flow monitoring is a critical component of Motadata ObserveOps, designed to provide deep insights into your network traffic and facilitate efficient network management. With the help of Flow Explorer, a powerful tool integrated within the platform, you can analyze network flows in a visually intuitive manner using Sankey diagrams. This enables you to proactively identify potential network bottlenecks, bandwidth utilization issues, and optimize network performance.
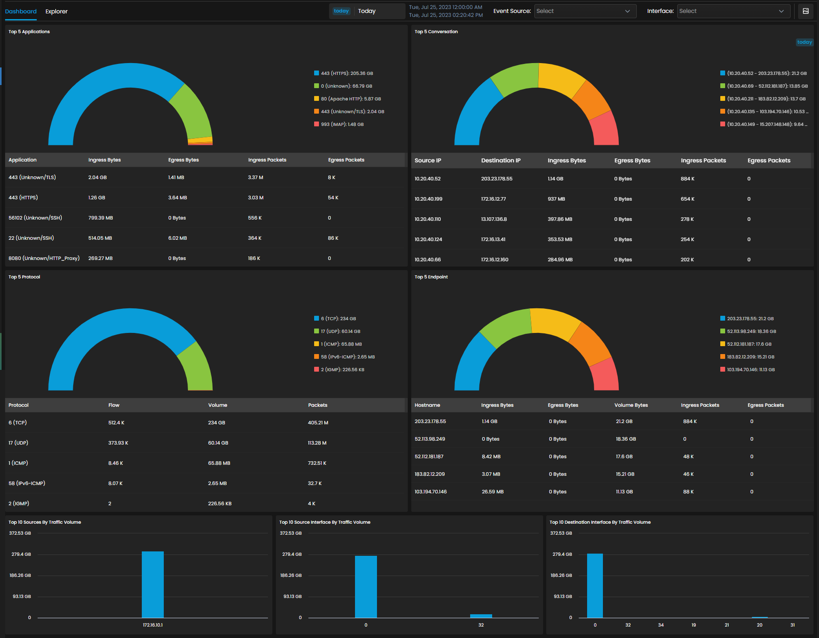
- Efficient Network Analysis
Motadata ObserveOps' Flow Explorer empowers you to efficiently process and analyze vast amounts of flow data generated within your network. The Sankey diagram visualization simplifies the representation of complex flow information, making it easy to understand traffic patterns and identify anomalies.
- Proactive Network Management
A proactive approach to network management is crucial for maintaining a smooth and reliable IT environment. By leveraging Flow Explorer, you can detect and address network-related issues before they impact your operations. The tool allows you to monitor network bandwidth usage at a granular level, trace conversations between endpoints, and identify users or devices with high bandwidth consumption.
Alerting
Welcome to the powerful Alerts feature of Motadata ObserveOps, designed to keep you in control of your IT infrastructure by providing timely and actionable insights. In the ever-changing landscape of IT operations, staying informed about critical events is essential for ensuring the smooth functioning and optimal performance of your network and systems.
With Alerts and Notifications in Motadata ObserveOps, you can:
Proactive Monitoring: Set up policies to monitor various aspects of your infrastructure in real-time. Whether it's server availability, performance metrics, log events, or network flows, the platform keeps a vigilant eye on your entire IT environment.
Customizable Policies: Tailor alert policies to your specific requirements. Define conditions that trigger alerts, set different severity levels, and configure appropriate actions to be taken when an alert is raised.
Intelligent Classification: The platform intelligently classifies alerts based on their severity, host, and monitor group, enabling efficient incident prioritization and swift response to critical issues.
Real-Time Alerts: Receive alerts instantly when specific events or anomalies occur, enabling you to take immediate actions and avoid potential downtime or performance degradation.
Basic Policies: The basic policies like availability, performance metrics, logs, and network flows have a fixed threshold value and they trigger an alert when the value of the metric or the event attributes goes above the configured threshold.
ObserveOps Policies: Leverage machine learning for predictive and anomaly-based monitoring.
Dashboards
In today's complex IT landscape, managing and interpreting vast amounts of data can be overwhelming. Motadata ObserveOps understands the significance of organized data presentation to facilitate efficient decision-making and seamless infrastructure monitoring. Dashboards play a pivotal role in providing a visual and intuitive representation of your IT environment's health and performance.
Visual Insights at a Glance: Motadata ObserveOps dashboards offer visually stimulating and easy-to-interpret graphical visualizations, allowing users to quickly grasp critical information about their infrastructure's status and performance.
Customizable Widgets: The dashboard provides a variety of widgets that can be tailored to specific requirements. Users can choose from a diverse range of graph types, including pie charts, bar diagrams, and lists, to visualize data effectively.
Flexibility and Interaction: Widgets on the dashboard can be effortlessly moved and resized, offering flexibility in arranging them as per user preferences. Zoom-in functionality enables you to contextualize data at specific intervals within the chart feature, and users can view historical metric data by adjusting the time interval.
Seamless Collaboration: Dashboards can be shared with relevant stakeholders via email, promoting collaboration and data-driven decision-making across the organization.
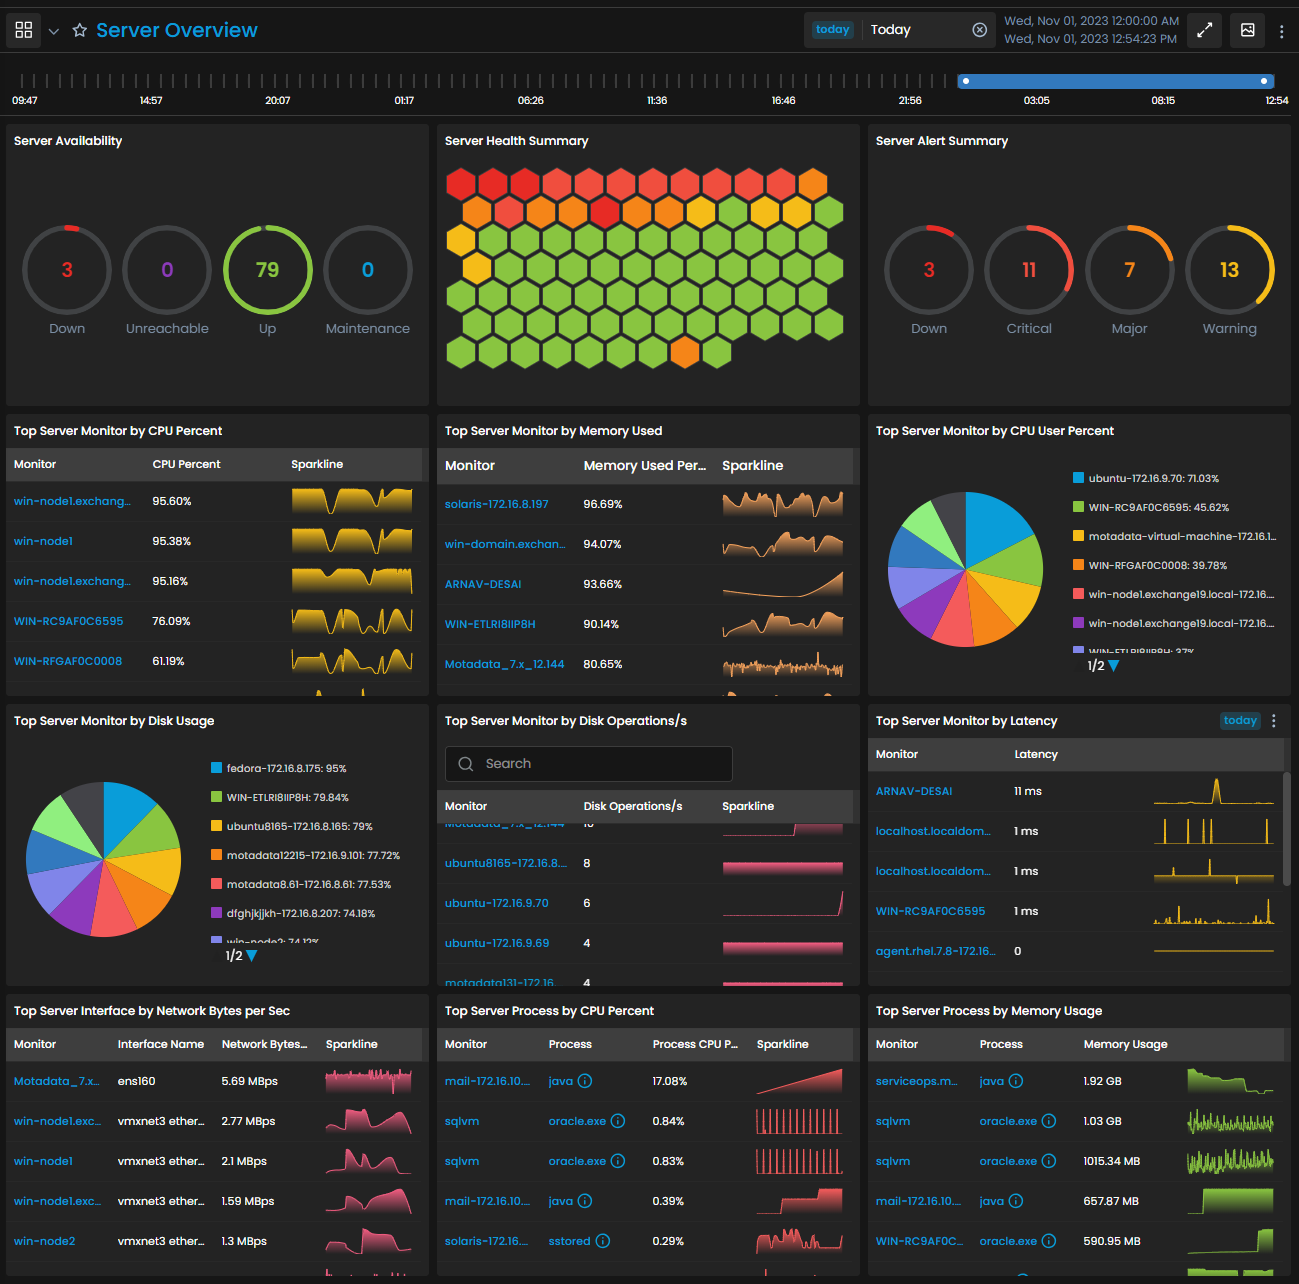
Explore default dashboards, create custom widgets, and generate reports to track the performance of your IT infrastructure.
Agent-based Monitoring
In the Agent-based Monitoring system of Motadata ObserveOps, you can install the MotaAgent on your Linux-based or Windows-based monitors, establishing a seamless connection between your devices and the ObserveOps server for efficient and comprehensive monitoring.
Continuous Data Collection: MotaAgent continuously collects vital performance and availability data from the monitored devices and transmits it to the ObserveOps server at regular intervals. This ensures real-time monitoring and up-to-date insights into your infrastructure's health.
Real-time Polling: With a polling interval as short as 1 second, the MotaAgent updates multiple metrics in real-time, providing accurate and timely performance data.
Uninterrupted Monitoring: Even during temporary connectivity disruptions between the agent and ObserveOps server, monitoring data is preserved locally on the agent. This ensures uninterrupted monitoring and eliminates concerns about data loss during communication issues.
Easy Setup: The installation and setup of Agent-based Monitoring are simplified, requiring minimal configuration. Installing the agent on desired devices allows immediate data transmission without complex authentication processes.
With Agent-based Monitoring in Motadata ObserveOps, you gain the ability to proactively manage your infrastructure, optimize performance, and deliver exceptional user experiences by leveraging real-time insights into your network devices.
Automation and Auto-Remediation
Motadata ObserveOps introduces an efficient and automated approach to handle repetitive and time-consuming tasks through its powerful Runbook feature. Runbooks serve as a valuable tool to streamline administrative processes, reducing manual intervention and minimizing operational toil. Employ runbooks for automating tasks and auto-remediation to resolve issues promptly.
Automated Task Execution: Motadata offers a set of in-built Runbooks that automate various routine tasks performed by administrators, alleviating the cognitive load associated with repetitive actions.
Eliminating Toil: By triggering common tasks based on predefined conditions, such as exceeding policy thresholds, Runbooks eliminate toil and ensure prompt responses to critical situations.
Regular Maintenance Support: Runbooks can be utilized for routine maintenance activities in IT systems and applications, including tasks like creating database backups and managing access permissions.
SNMP Trap Monitoring
Motadata ObserveOps empowers you with SNMP Trap Monitoring, robust SNMP Trap Monitoring and enablins to capture and analyze SNMP traps from network devices and applications. SNMP traps are asynchronous notifications sent by devices to alert the management system about specific events or issues that require attention, and enhances network device monitoring and management.
Instant Notifications: Motadata ObserveOps leverages SNMP traps to provide instant notifications for critical events within your network environment. This proactive approach enables timely identification and resolution of potential issues, safeguarding your business operations.
Efficient Monitoring: SNMP Trap Monitoring offers a passive mode of monitoring that complements regular polling. Instead of actively requesting data from numerous devices, SNMP traps enable network devices to send notifications to ObserveOps in real-time, ensuring that crucial events are not missed between polling intervals.
Platform Features
Enjoy intuitive search queries, flexible data retention, and seamless LDAP integration for efficient user management.
Getting Started
Before you embark on your ObserveOps journey, this user guide will walk you through the necessary steps to install, configure, and harness the full potential of Motadata ObserveOps. From system requirements and installation to starting with metrics, logs, and flow monitoring, we've got you covered.
Unlock the power of AI and ML for your IT operations with Motadata ObserveOps and experience a new level of efficiency and intelligence in managing your IT infrastructure. Let's embark on this transformative journey together!