Dashboard Actions in ObserveOps
Once you've created a dashboard, you can clone, edit, or delete it. You can also control the time range for all widgets on the dashboard from a single control, or view the entire dashboard in full screen.
Navigation
Go to Main Menu and select Dashboards. The default dashboard opens.
Select the actions button in the top-right corner of the dashboard header to display the available actions.
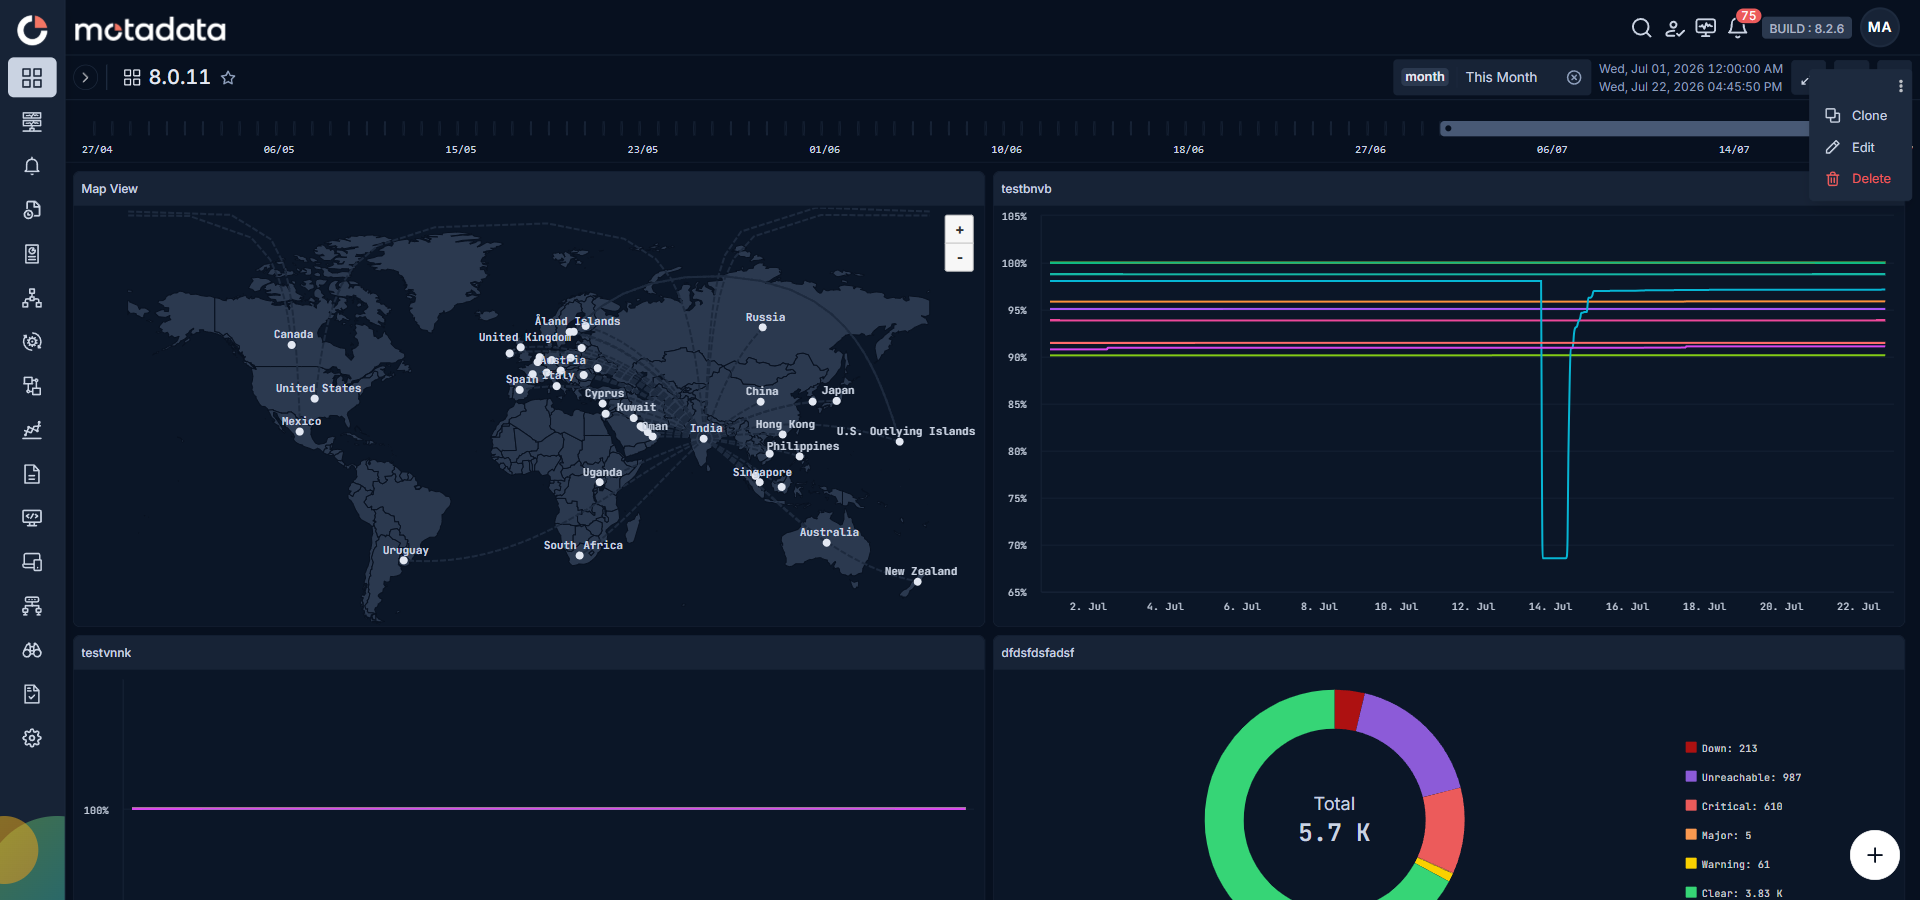
Dashboard Actions
Clone
Select Clone to create a copy of the current dashboard with all its widgets. Enter a name and category for the cloned dashboard in the pop-up, then confirm. You can then modify the cloned dashboard's widgets independently.
Edit
Select Edit to open the dashboard settings panel and update the dashboard configuration. You can edit both out-of-the-box and custom dashboards.
The following fields are available when editing a dashboard:
| Field | Description |
|---|---|
| Dashboard Name | Enter a unique name for the dashboard. |
| Category | Select the category to group the dashboard under. Select Create New to add a new category. |
| Visibility & Sharing | Select Public to make the dashboard visible to all users. Select Private to restrict visibility. If you select Private, you can share the dashboard with specific Users or User Profiles from the respective dropdowns. |
| Header Font Size | Select S, M, or L to control the font size for each widget title. |
| Horizontal Gap | Set the horizontal spacing between widgets using the slider. |
| Vertical Gap | Set the vertical spacing between widgets using the slider. |
| Row Height | Set the default height for each widget row using the slider. |
| Default landing dashboard | Enable this toggle to make this dashboard the first screen that opens when users navigate to Dashboards. |
You cannot edit the Dashboard Name or Category fields for out-of-the-box dashboards. Once you enable the Default landing dashboard toggle, you cannot undo the setting from the same edit session.
Select Reset to clear all changes, or select Update Dashboard to save.
Delete
Select Delete to permanently remove the dashboard. Confirm the deletion in the pop-up. This action cannot be undone.
Configure the Global Timeline
By default, all widgets display data for the current selection shown next to the calendar icon in the top-right area of the dashboard header. You can change the time range for every widget on the dashboard at once using the global timeline control.
Select the calendar icon in the top-right area of the dashboard header. The Type Range... input opens with a preset list on one side and a two-month calendar picker with From Time and To Time dropdowns on the other.
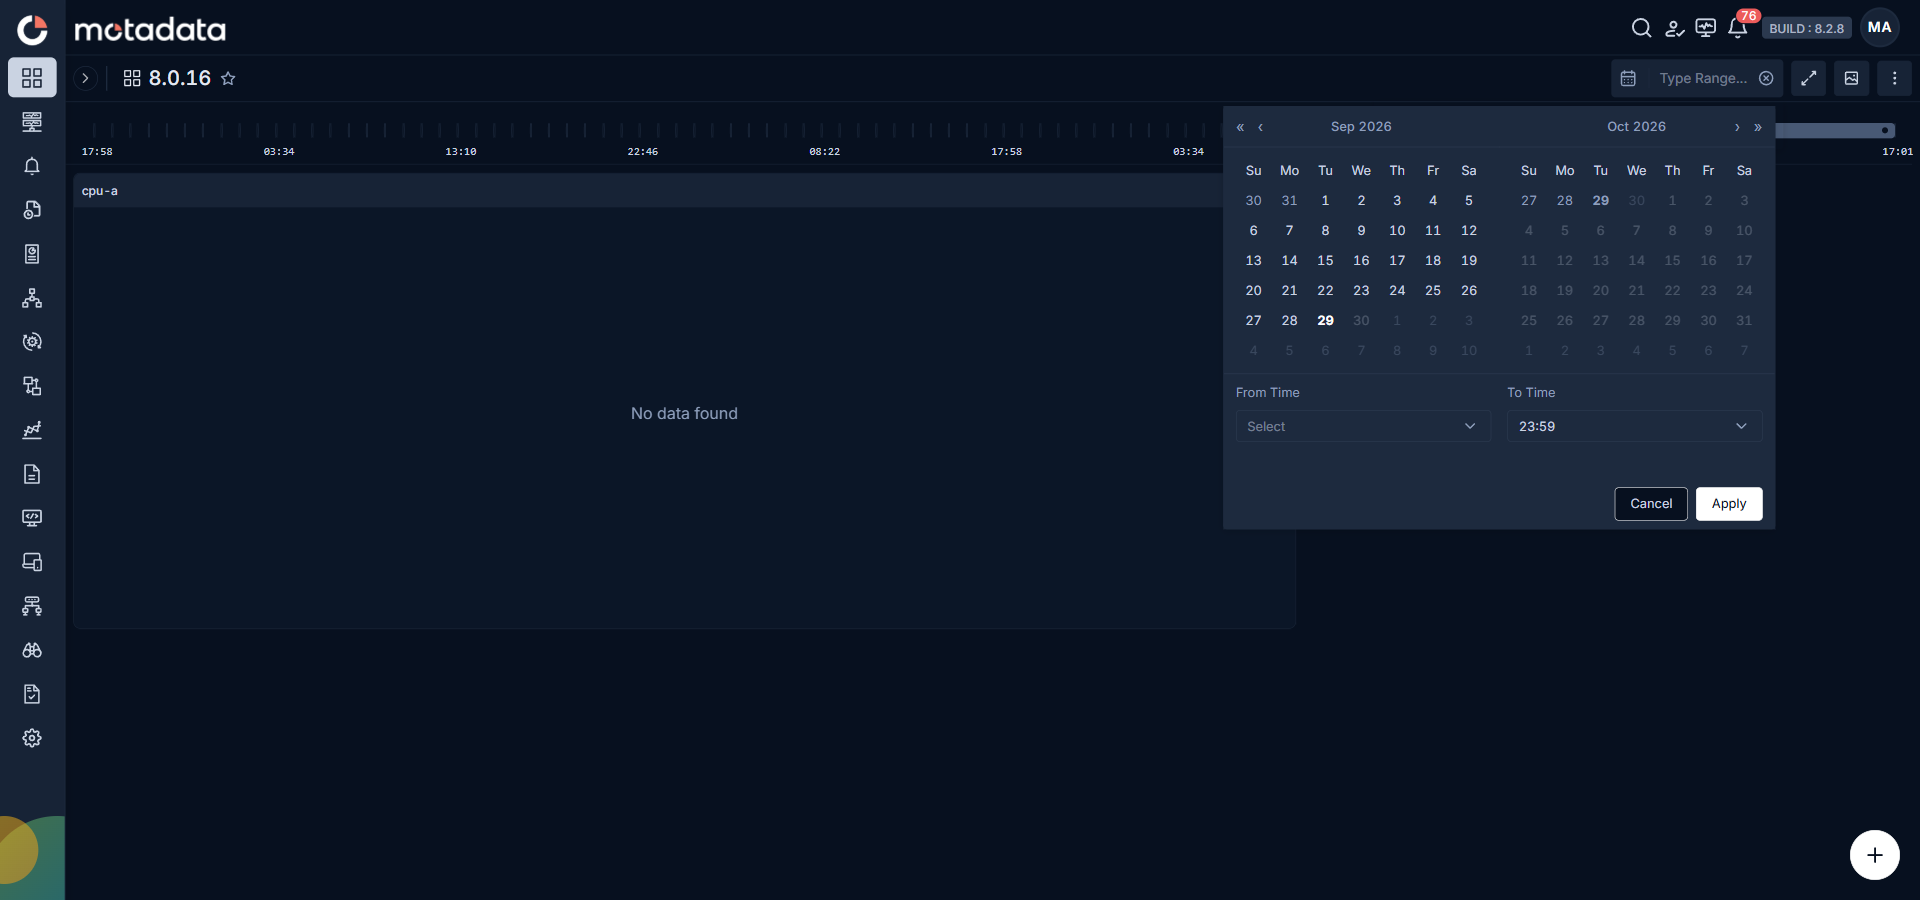
Pick a preset from the list or type its shortcut into the input:
| Preset | Shortcut | Description |
|---|---|---|
| Last 5 Mins | 5m | Shows data from the last 5 minutes. |
| Last 15 Mins | 15m | Shows data from the last 15 minutes. |
| Last 30 Mins | 30m | Shows data from the last 30 minutes. |
| Last 1 Hour | 1h | Shows data from the last hour. |
| Last 6 Hours | 6h | Shows data from the last 6 hours. |
| Last 12 Hours | 12h | Shows data from the last 12 hours. |
| Last 24 Hours | 24h | Shows data from the last 24 hours. |
| Last 48 Hours | 48h | Shows data from the last 48 hours. |
| Today | today | Shows data from the current calendar day. |
| Last Day | 1d | Shows data from the previous calendar day. |
| Last Week | 1w | Shows data from the last 7 days. |
| Last Month | 1mo | Shows data from the previous calendar month. |
| This Week | week | Shows data from the current calendar week. |
| This Month | month | Shows data from the current calendar month. |
| Custom | — | Pick exact start and end dates using the calendar, and specific times using the From Time and To Time dropdowns. Select Apply to save the range, or Cancel to discard changes. |
All widgets on the dashboard update to show data within the selected range.
To enable real-time widget updates, add "l1.cache.enabled": "yes" to both /motadata/motadata/config/motadata-datastore.json and motadata.json, then restart the Motadata service.
Full Screen and Export
| Control | What It Does |
|---|---|
| Full Screen | Expands the entire dashboard to fill the browser viewport. Press Esc to exit full screen. |
| Export | Exports the current dashboard view. |