Log Search
Overview
The Log Search feature in Motadata ObserveOps (formerly known as AIOps) enables you to explore, analyze, and visualize logs from multiple monitored sources within a single interface. This tab displays a unified view, allowing you to filter, visualize, and correlate log data seamlessly. You can select the device by Type or Group to view the logs.
You can set filter conditions to narrow down to the exact log events you want to investigate.
Click the icon to configure filter criteria as per your requirement and view the filtered log events.

The logs are displayed both in list and graphical formats for easier interpretation. You can change the view of the log list by clicking the icons displayed near the Save Report button.
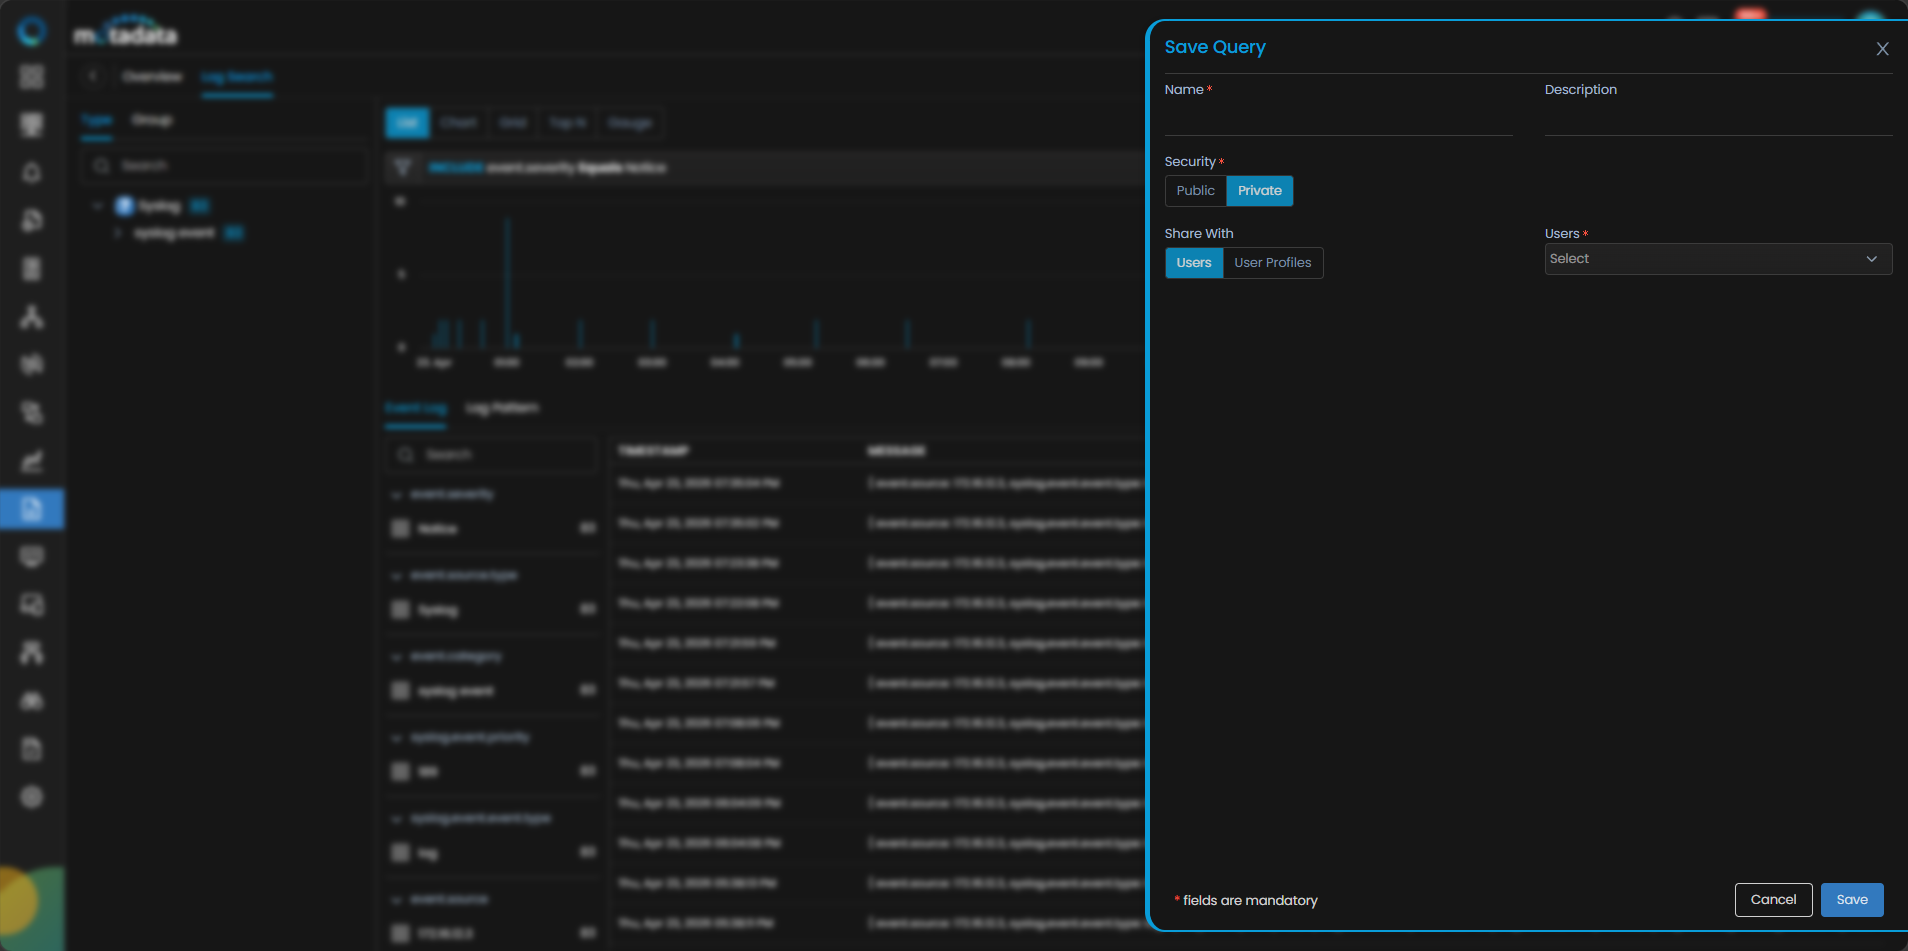
You can also save your search queries for reuse by clicking the Save Query option. This will display a drill-down menu where you need to provide query Name, Description and Security, i.e., whether it should be Public or Private. Selecting Private you can grant access to User(s) or User Profiles(s) from the User drop-down menu.

Once you save the query it gets listed under the Saved Query Section in the left side panel. You can use it further for future log query executions.
Navigation
To access the Log Search interface go to main menu then Log Explorer and select the Log Search tab to open the unified search and visualization workspace.
Log Investigation Using Log Search
Count of Log Events

The bar graph at the top of the Log Search screen displays the count of log events received at various time intervals. To view detailed information for a specific time, hover your cursor over the corresponding bar section.
This visual timeline helps in identifying peaks in log activity, making it easier to focus on potential anomaly periods.
Event Log (List View)
The Event Log view displays logs in a grid format for in-depth inspection.
By default, columns such as Timestamp and Message are visible. You can customize the table by adding or removing fields using the Eye icon at the top right corner. You can check the Raw Log box to view unparsed log data exactly as received by Motadata ObserveOps.
Clicking Export as CSV you can export the logs.
Log Pattern
After applying filters and selecting the required timeline in Log Search, switch to the Log Pattern tab to view auto-generated patterns based on the same query results. Log Patterns are generated automatically when the page loads, when filters or timeline are modified, or when the page is refreshed—irrespective of whether you are on the Event Log or Log Pattern tab. The tab displays a structured list of patterns showing the Count (number of logs matching the pattern) and the corresponding event.severity. If logs under the same pattern contain multiple severities (for example, due to a custom remapper), the system groups the patterns separately by severity.
During detection, variable tokens are categorized using predefined types such as NUM (numeric values), IP (IP addresses), EMAIL (email addresses), URL (web links), GUID (globally unique identifiers), ID (generic identifiers), SEQ (sequence numbers), HEX (hexadecimal values), and CMD (command strings).
Any value that does not match a predefined category is masked as *****. Tokenization is performed using space, caret (^), pipe (|), colon (:), and equals (=), and any content enclosed within double quotes ("") is treated as a single token.

You can hover over any highlighted masked portion to view the Distribution of Values, which displays the actual observed values for that variable along with their Count and Share %, calculated as (Value Count / Pattern Count) × 100. This enables quick identification of dominant values within a pattern while ensuring accurate severity-based screening during investigation.
Expandable Key-Based Filters
On the left panel, all parsed log keys are displayed along with their respective values and counts. You can expand any field (e.g., event.severity) to see the breakdown of values.
Selecting one or more values automatically filters the results. This feature supports multiple key-value combinations, enabling advanced filtering across different log attributes such as source.type, source.host, or log.message.
Visualization View (Chart, Top N, Grid, Gauge)

In the same Log Search tab, you can switch to graphical visualization by selecting one of the visualization types located above the log list:
- Chart
- Top N
- Grid
- Gauge
To configure visualization, you can select Counter (e.g., event.count, response.time) and Aggregation (e.g., Count, Sum, Avg) then select the Source Filter type (Host, Type, or Group). Selecting the Source from the available list and Result By you can
optionally group results.
Each visualization updates in real-time according to the applied filters. This helps you quickly identify patterns, frequent error sources, and recurring event types.
Log Details Panel

Clicking on a log entry opens a side panel with detailed insights for Event Attributes, this displays all parsed key-value pairs extracted from the log and Metrics if associated with the displayed attributes.

The Metric tab displays CPU Statistics, Memory Statistics, Disk Statistics, Network Statistics, Load Average Statistics, and Process Statistics in a graphical representation to view the respective utilization summaries.
Creating Reports from Log Search
You can create detailed reports based on the filtered logs. By applying filters or building a search query, you can click the Save as Report.
Enter the Report Name and Description and click Save.
The saved Report is available under Reports > Log > All Reports.