View and Manage Alerts
Overview
You can view all the alerts triggered currently in the system, all the alerts raised in the past, the different states the alert has been in, and many other details related to the alerts at one place. You can also search, clear, and acknowledge the alerts in the system. The alert screen gives you deeper visibility into each alert to help minimize downtime and maximize infrastructure performance.
Alert Pop-ups
Motadata AIOps will display alert pop-ups for Metric, Log, Flow, and Trap policy types on the top of the screen whenever an alert is triggered. The alert pop-up will have the context of the Event source as well, except for Log and Flow alert pop-ups. Alert Pop-ups will also consist of a label to display the type of Policy breached (Metric, Log, Flow, and Trap).
Navigation
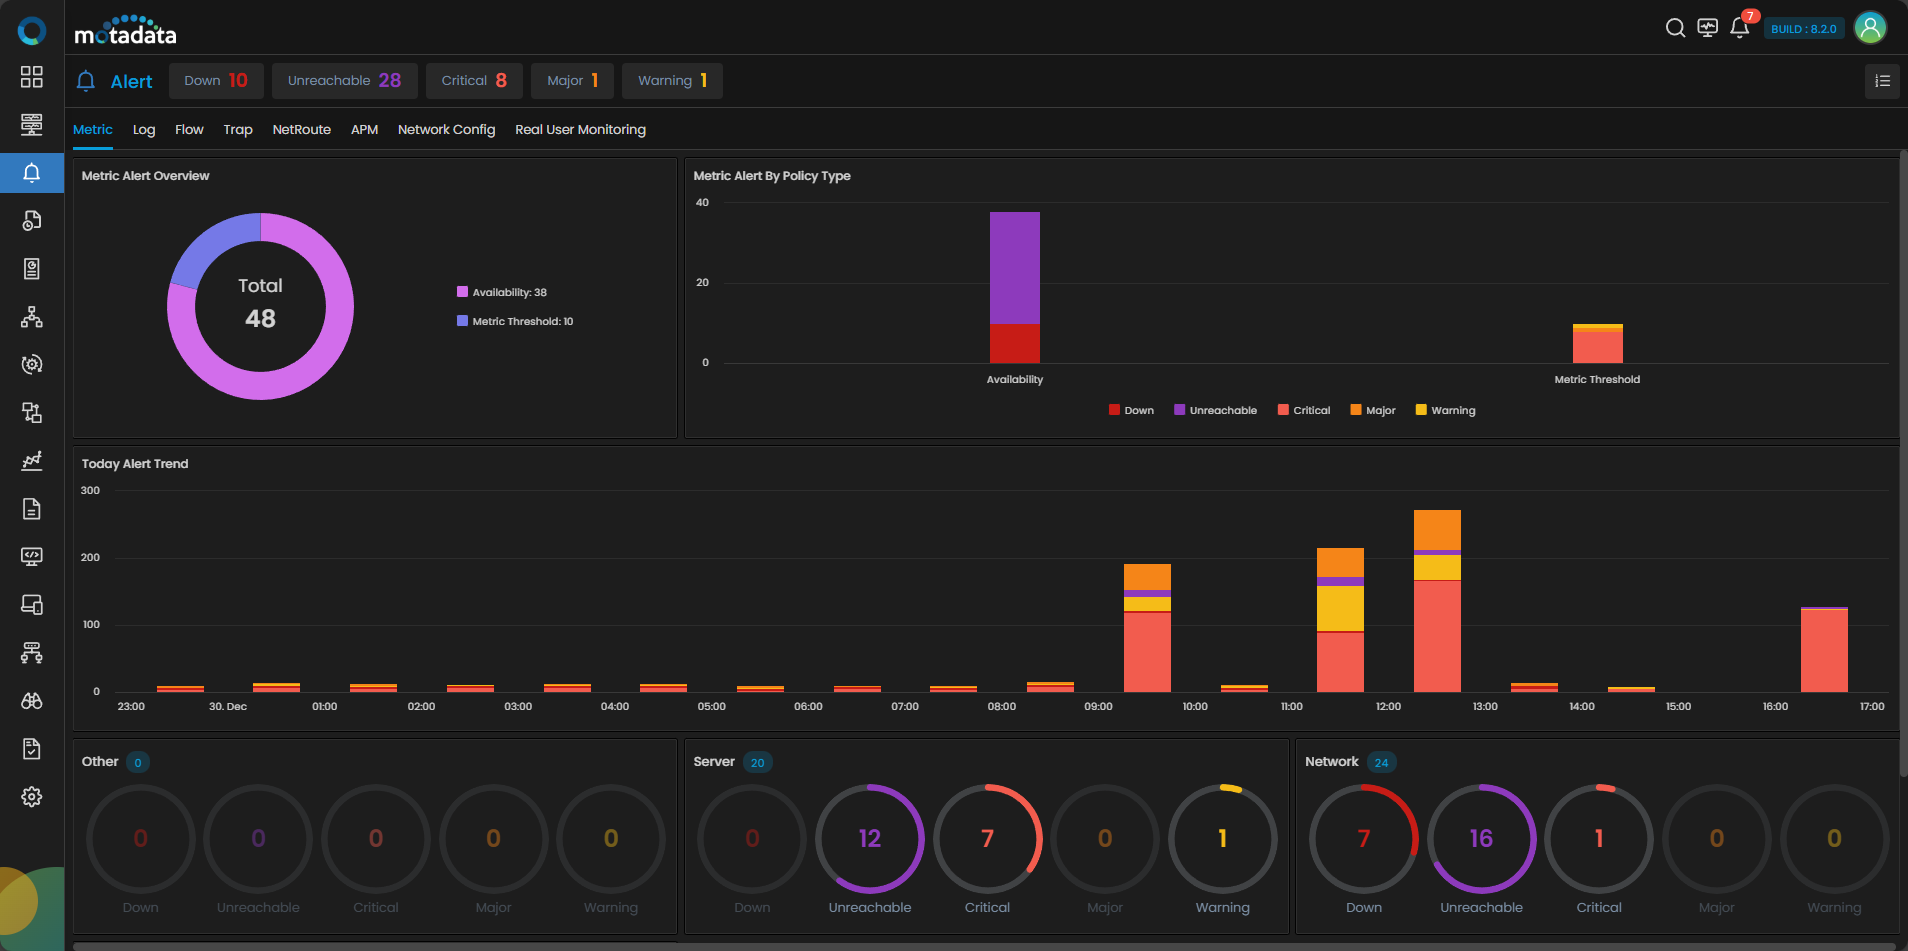
Go to Menu, Select Alerts ![]() The alert screen is now displayed.
The alert screen is now displayed.
Classification of Alerts
The alerts are classified intelligently based on the alert severity and the alert type. Alert section in Motadata AIOps has superior intelligence as it identifies alerts and groups them based on alert type, severity, host and the device type of the monitor. This helps you to pinpoint the alert you are looking for in a easy manner.
On the alert screen, you can see that the alerts are mainly categorized based on their device type (Cloud, Network, Service Check, Server, and Virtualization). They are also further categorized based on their severities (Down, Unreachable, Critical, Major, Warning).

Suppose you want to view all the Down alerts received for the Cloud device type, click on the circle titled Down under the Cloud tab. The list of all the Down alerts for the Cloud device type will be displayed.
View Alert Details
After selecting the alert category by clicking on the appropriate circle from the alert screen as described above, a list of all the alerts under that category is displayed.

The following fields appear in the alert list:
| Field | Description |
|---|---|
| Alert | The name of the alert. |
| Type | The type of the alert. |
| Monitor | The name of the monitor for which the alert is created. |
| Last Seen | The last triggered timestamp of the alert. |
| Instance | The instance name (if applicable) for which the alert is created. |
| Value | The threshold value at which the alert is triggered. |
| Duration | The time passed since the alert was triggered. |
| 24 Hours Count | This field displays the count of the all the severities in which the alert has been in the last 24 hours. |
| Acknowledged | This field displays whether the alert has been acknowledged or not. |
| Actions | There are multiple actions available for an alert which we will discuss later in the next section. |
We can explore an alert in even further detail. Click on the alert name from the alert list to view the details related to that alert. The details shown would be relevant to the type of the alert triggered i.e. metric, log, or flow alert. Let us first look at the detail screen for a metric alert.
Metric Alert Details
Here, you can see details such as the Monitor, IP, Group, Alert ID, Metric for which the alert is triggered, and much more.

You can also visualise important details via widgets available on this screen to take a deep dive into that alert.
| Widget | Description |
|---|---|
| Alert History | This Widget shows the metric values for which the policy is configured, the threshold values configured in the policy, and the severity of the alerts over time based on the selected timeline. |
| Current Forecast Status | This shows a line chart to understand the current forecast status of the metric for which the alert is triggered. |
| History | This widget shows the changes in the severity of the alert based on the selected timeline. |
| Metric Trend | This widget shows the changes in the values of the metric for which the alert is triggered based on the selected timeline. |
Now, let us look into the details available for log alert.
Log Alert Details
Here, you can see details such as the Alert ID, Counter, Trigger Condition, Severity, for which the alert is triggered, and much more.

You can also visualise important details via widgets available on this screen to take a deep dive into that alert.
| Widget | Description |
|---|---|
| Alert Trend | This widget shows count of log messages that qualify for alert evaluation based on the selected timeline and also highlights the point at which the alert is triggered. |
| Alert Count | This widget shows the number of times the alert is triggered at various points of time based on the selected timeline. |
| History | This widget records the alert message and the time at which the alert is triggered |
| Log Explorer Widget | This widget helps you to analyse the log messages that trigger the alert by directing you to that exact log message in Log Explorer. |
Now, let us look into the details available available for flow alert.
Flow Alert Details
Here, you can see details such as the Alert ID, Counter, Trigger Condition, Severity, for which the alert is triggered, and much more.

You can also visualize important details via widgets available on this screen to take a deep dive into that alert.
| Widget | Description |
|---|---|
| Alert Trend | This widget shows count of flows that qualify for alert evaluation based on the selected timeline and also highlights the point at which the alert is triggered. |
| Alert Count | This widget shows the number of times the alert is triggered at various points of time based on the selected timeline. |
| History | This widget records the alert message and the time at which the alert is triggered |
| Flow Explorer Widget | This widget helps you to analyze the flow that triggers the alert by directing you to that exact flow in Flow Explorer. |
Trap Alert Details
Here, you can see details such as the Alert ID, Counter, Trigger Condition, Severity, for which the alert is triggered, and much more.

You can also visualize important details via widgets available on this screen to take a deep dive into that alert.
| Widget | Description |
|---|---|
| Alert Trend | This widget shows count of traps that qualify for alert evaluation based on the selected timeline and also highlights the point at which the alert is triggered. |
| Alert Count | This widget shows the number of times the alert is triggered at various points of time based on the selected timeline. |
| History | This widget records the alert message and the time at which the alert is triggered. |
| Trap Explorer Widget | This widget helps you to analyze the trap that triggers the alert by directing you to that exact trap in SNMP Trap Explorer. |
NetRoute Alert Details
For NetRoute, Motadata AIOps has a separate dashboard for Source to Destination and Hop To Hop category.
Source to Destination Alert Details
Here, you can see details such as the Severity Overview, Alert by Severity, and Alert Trend for which the alerts have been triggered.

Hop To Hop Alert Details
Here, you can see details such as Severity Overview, Alert by Severity, and Hop To Hop Trend for which the alerts have been triggered.

APM Alert Details
For APM, Motadata AIOps has a separate dashboard for Trace Metric and Trace Analytics.
Trace Metrics Alert Details
Here, you can see details such as the Trace Metrics Alert by Severity Overview, Trace Metrics Alert By Severity, and Trace Metrics Alert Trend for which the alerts have been triggered.

Click an alert severity in the chart to view the corresponding Trace Metrics alerts in the grid filtered by the same severity (i.e., Major, Warning, Critical). You can directly see the grid view by clicking the grid view icon available in the top right corner.

You can click the alert from the list that will open a drill-down tab displaying details like APM Service, Monitor, Policy Tag, Alert ID, Metric Value, etc. You can also visualize important details via widgets available on this screen to take a deep dive into that alert.

| Widget | Description |
|---|---|
| Alert Flaps | This widget shows the alert severity over time. Hovering over it displays the start time and end time with duration for each alert flap. |
| Metric Trend | This widget shows the changes in the trend of the metric for which the alert is triggered based on the selected timeline. |
| History | This widget displays the alert message along with the time it was triggered. You can see a corresponding Metric Trend View to the right hand side of this widget. Selecting any alert flap message from the history list, updates the Metric Trend view for that specific occurrence. |
Trace Analytics Alert Details
Here, you can see details such as the Trace Analytics Alert by Severity Overview, Trace Analytics Alert By Severity, and Trace Analytics Alert Trend for which the alerts have been triggered.

Click an alert severity in the chart to view the corresponding Trace Analytics alerts in the grid filtered by the same severity (i.e., Major, Warning, Critical). You can directly see the grid view by clicking the grid view icon available in the top right corner.

You can click the alert from the list that will open a drill-down tab displaying details like Alert ID, Alert Type, Metric, Trigger Condition, Severity, etc. You can also visualize important details via widgets available on this screen to take a deep dive into that alert.

| Widget | Description |
|---|---|
| Alert Trend | This widget shows the timeseries trend of the metric. |
| Alert Count | This widget shows the count of the alert triggered based on the selected timeline. |
| History | This widget displays the alert message along with the time it was triggered. You can see the grid to the right hand side of this widget. Selecting any alert flap message from the history list, updates the grid for the specific occurrence. |
Network Config Alert Details
Here, you can see details such as the Network Config Overview, Network Config Alert By Severity, Alert Trend, for which the alert is triggered, and much more.

You can also visualize important details via widgets available on this screen to take a deep dive into that alert.
| Widget | Description |
|---|---|
| Network Config Overview* | This widget shows overview of alerts generated for Network Config over a period of time. |
| Network Config Alert By Severity | This widget shows the number of alerts triggered for different severity. |
| Alert Trend | This widget shows count of alerts generated for network config that qualify for alert evaluation based on the selected timeline and also highlights the point at which the alert is triggered. |
RUM Alert Details
For RUM, Motadata AIOps has a separate dashboard for RUM Metrics and RUM Analytics.
RUM Metrics Alert Details
Here, you can see details such as the RUM Metrics Alert by Severity Overview, RUM Metrics Alert By Severity, and RUM Metrics Alert Trend for which the alerts have been triggered.

Click an alert severity in the chart to view the corresponding RUM Metrics alerts in the grid filtered by the same severity (i.e., Major, Warning, Critical). You can directly see the grid view by clicking the grid view icon available in the top right corner.

You can click the alert from the list that will open a drill-down tab displaying details like Application Name, Application Tags, Policy Tag, Alert ID, Metric Value, etc. You can also visualize important details via widgets available on this screen to take a deep dive into that alert.

| Widget | Description |
|---|---|
| Alert Flaps | This widget shows the alert severity over time. Hovering over it displays the start time and end time with duration for each alert flap. |
| Metric Trend | This widget shows the changes in the trend of the metric for which the alert is triggered based on the selected timeline. |
| History | This widget displays the alert message along with the time it was triggered. You can see a corresponding Metric Trend View to the right hand side of this widget. Selecting any alert flap message from the history list, updates the Metric Trend view for that specific occurrence. |
RUM Analytics Alert Details
Here, you can see details such as the RUM Analytics Alert by Severity Overview, RUM Analytics Alert By Severity, and RUM Analytics Alert Trend for which the alerts have been triggered.

Click an alert severity in the chart to view the corresponding RUM Analytics alerts in the grid filtered by the same severity (i.e., Major, Warning, Critical). You can directly see the grid view by clicking the grid view icon available in the top right corner.

You can click the alert from the list that will open a drill-down tab displaying details like Alert ID, Alert Type, Metric, Trigger Condition, Severity, etc. You can also visualize important details via widgets available on this screen to take a deep dive into that alert.
| Widget | Description |
|---|---|
| Alert Trend | This widget shows the timeseries trend of the metric. |
| Alert Count | This widget shows count of the alert triggered based on the selected timeline. |
| History | This widget displays the alert message along with the time it was triggered. You can see the grid to the right hand side of this widget. Selecting any alert flap message from the history list, updates the grid for the specific occurrence. |
Action on Alerts
Clear Alert
You can manually move an alert into the clear state if needed. Search the alert that you want to clear on the alert screen.
Click on ![]() to clear the Alert. This will open a new window where you can enter additional notes for clearing the Alert.
to clear the Alert. This will open a new window where you can enter additional notes for clearing the Alert.
Acknowledge Alert
You can acknowledge an alert to indicate that appropriate action is being taken on the alert. Search the alert that you want to acknowledge on the alert screen.
Click on ![]() to acknowledge the alert.
to acknowledge the alert.
Add notes
You can add any information pertaining to the alert if needed.
Click on ![]() icon which will open a new floating window. Enter the information and click on Save to add the comments.
icon which will open a new floating window. Enter the information and click on Save to add the comments.
Suppress Alert
You can suppress an alert for a maximum of 48 hours in case you do not wish to receive any further notifications related to that alert. Search for the alert that you want to acknowledge on the alert screen.
Click on ![]() to display the actions available for the alert. Select Suppress Alert and then select the number of hours for which you want to suppress alert from the pop-up.
to display the actions available for the alert. Select Suppress Alert and then select the number of hours for which you want to suppress alert from the pop-up.
Share Alert
Click on ![]() to share all notifications triggered by this alert.
to share all notifications triggered by this alert.
Last Triggered Notifications
Click on ![]() to view all notifications triggered by this alert.
to view all notifications triggered by this alert.
Last Triggered Actions
Click on the ![]() to view the details of actions that were triggered by this alert.
to view the details of actions that were triggered by this alert.