Audit Trail in ObserveOps
ObserveOps records every change made to your system in the Audit module. You can see who changed what, when they changed it, and whether it succeeded or failed. This covers Dashboards, Monitors, Metrics, Users, and more.
Use the Audit module when something breaks and you need to find out why. A monitor stopped alerting. A dashboard looks different from yesterday. A metric value seems wrong. The Audit module gives you the full history so you can trace the exact moment, the exact change, and the exact person responsible.
Navigation
Go to Menu. Select Audits  . The Audit screen opens.
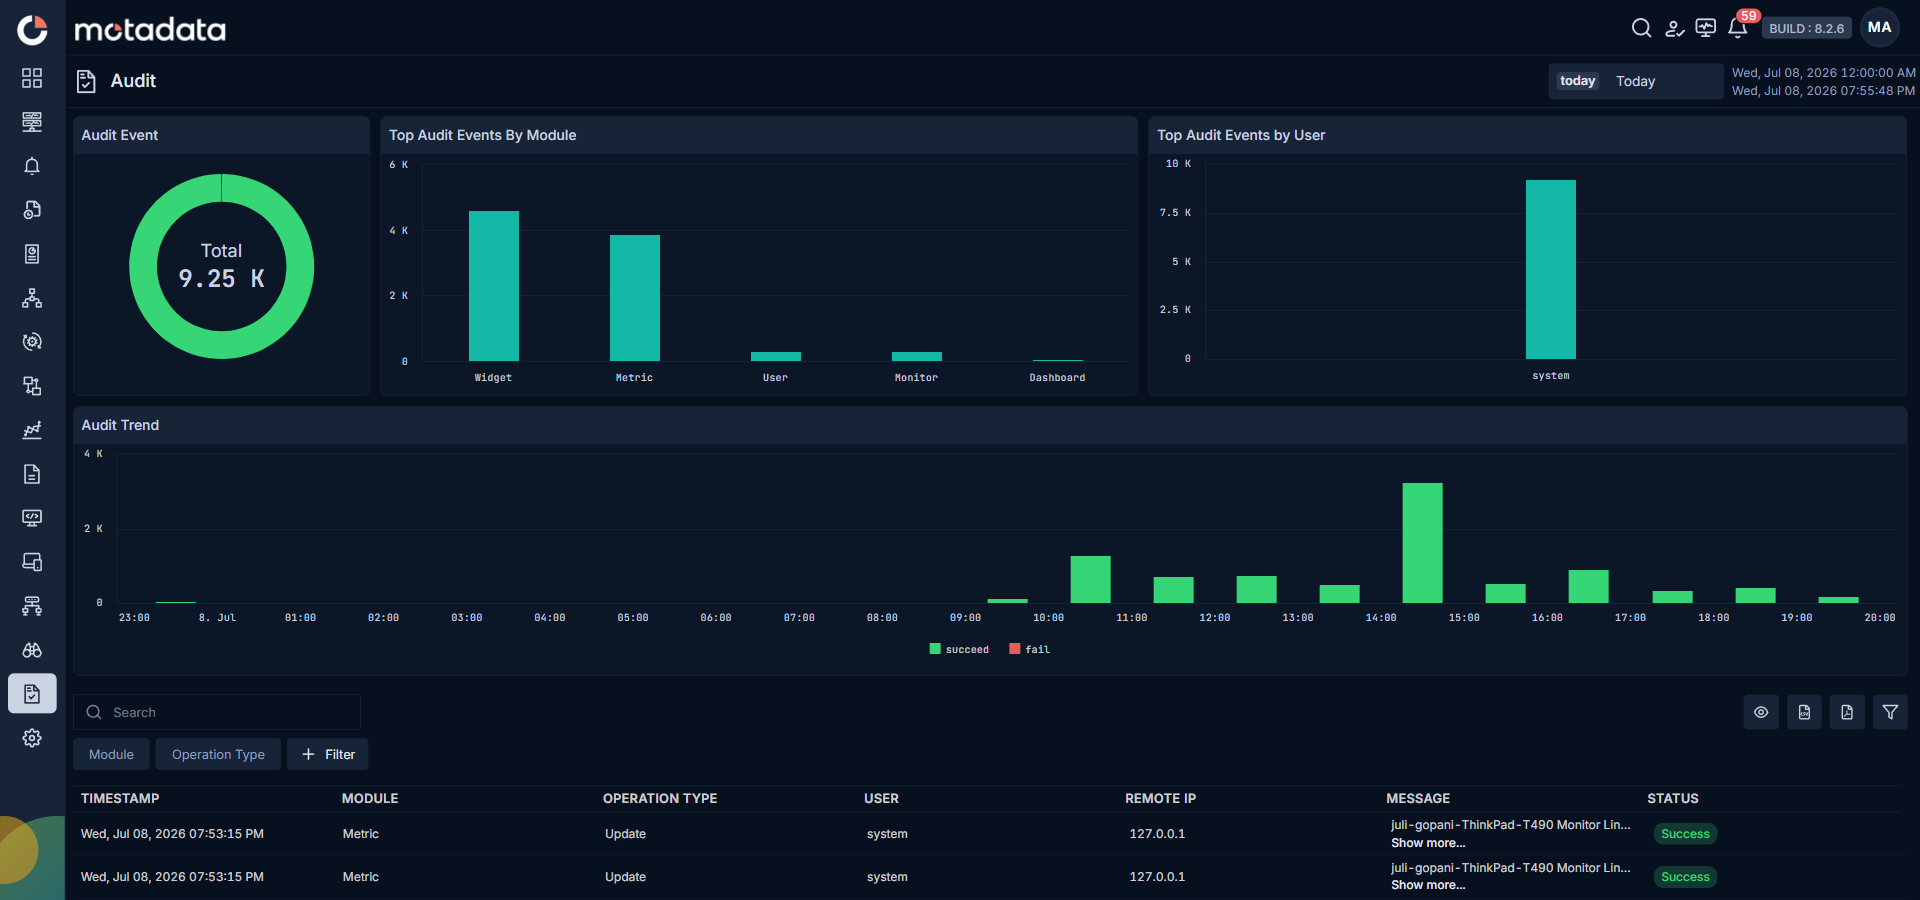
What the Screen Shows
The Audit screen has three sections from top to bottom:
| Section | What It Is | Why It's There |
|---|---|---|
| Insight Widgets | Three summary charts at the top | Quick view of total events, busiest modules, and most active users for the selected time range |
| Audit Trend | A timeline chart below the widgets | Shows how audit activity changed over the day so you can spot spikes and failures at a glance |
| Audit Table | The full record list at the bottom | Every audit event with search, filter, sort, and export controls |
Insight Widgets
Three widgets appear at the top of the screen. They all update automatically based on the time range you select at the top right of the page.
| Widget | What It Shows | When to Use It |
|---|---|---|
| Audit Event | A donut chart with the total number of audit events in the selected time range | Check how much activity happened overall |
| Top Audit Events By Module | A bar chart showing which modules had the most events, such as Widget, Metric, Monitor, User, or Dashboard | Find which part of the system is changing most often |
| Top Audit Events by User | A bar chart showing which users triggered the most audit events | Spot accounts with unusually high activity |
Audit Trend
The Audit Trend chart shows how audit activity changed over time. Two lines appear on the chart:
| Line | Color | What It Means | When to Use It |
|---|---|---|---|
| succeed | Green | Changes that completed successfully | Confirm normal activity levels |
| fail | Red | Changes that failed or were rejected | Investigate problems. A spike here means something went wrong. |
Click succeed or fail in the legend below the chart to show or hide that line. A sudden spike in the fail line tells you something went wrong around that time. Cross-reference the spike time with the Audit Table to find the exact event.
Audit Table
The audit table lists every event in the selected time range. It shows 50 records per page by default. The total count appears at the bottom right, for example: "1 - 50 of 9,246 items."
Toolbar
Four action buttons appear in the top-right corner above the table.
Select  to manage which columns appear in the table. A panel opens where you can check or uncheck each column, search for a column by name, or select Reset Column Preference to restore all columns.
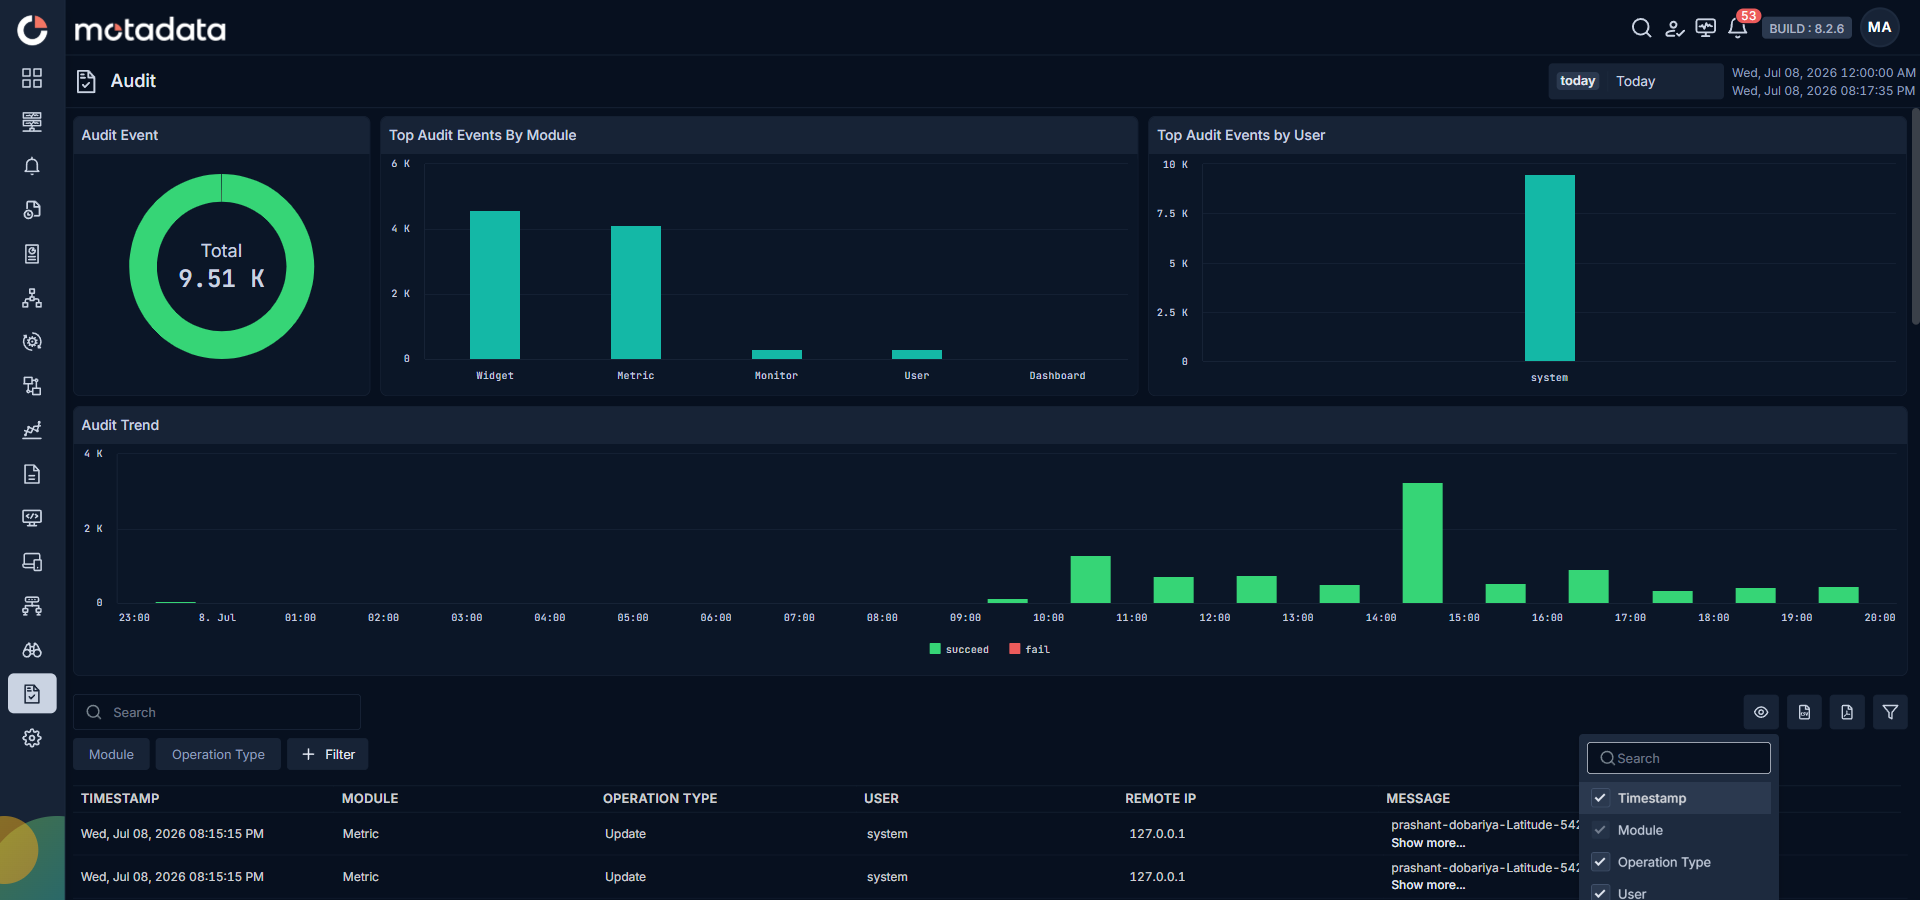
Select  to download all current records as a CSV file. Use this to open the data in Excel or import it into another tool.
Select  to download all current records as a PDF file. Use this to share a printable report with a manager or auditor.
Select  to show or hide the Module and Operation Type quick filter chips above the table.
Table Columns
Each row in the table shows these details:
| Field | Description |
|---|---|
| Timestamp | The date and time the change happened. |
| Module | The part of the system where the change happened, such as Monitor, Dashboard, Metric, or User. |
| Operation Type | The type of change: Create, Update, or Delete. |
| User | The user who made the change. If the system triggered it automatically, this column shows system. |
| Remote IP | The IP address the change came from. System-triggered changes show 127.0.0.1. |
| Message | A short summary of what changed. Select Show more... to see the full before-and-after comparison. |
| Status | Whether the change worked. Either Success or Fail. |
Click any column header to sort the table by that column.
Search Records
Type any keyword in the Search box above the table to find specific records. The table updates as you type. You can search by monitor name, username, or any word in the message text.
Filter Records
You have two ways to narrow down the table: quick filter chips and the full filter panel.
Quick Filter Chips
Two chips appear above the table: Module and Operation Type. Click either chip to pick a filter value.
| Operator | What It Does |
|---|---|
= | Shows only records that match the value you pick |
!= | Excludes records with that value and shows everything else |
The table updates immediately when you apply a chip filter.
Full Filter Panel
Select + Filter above the table to combine multiple conditions at once.
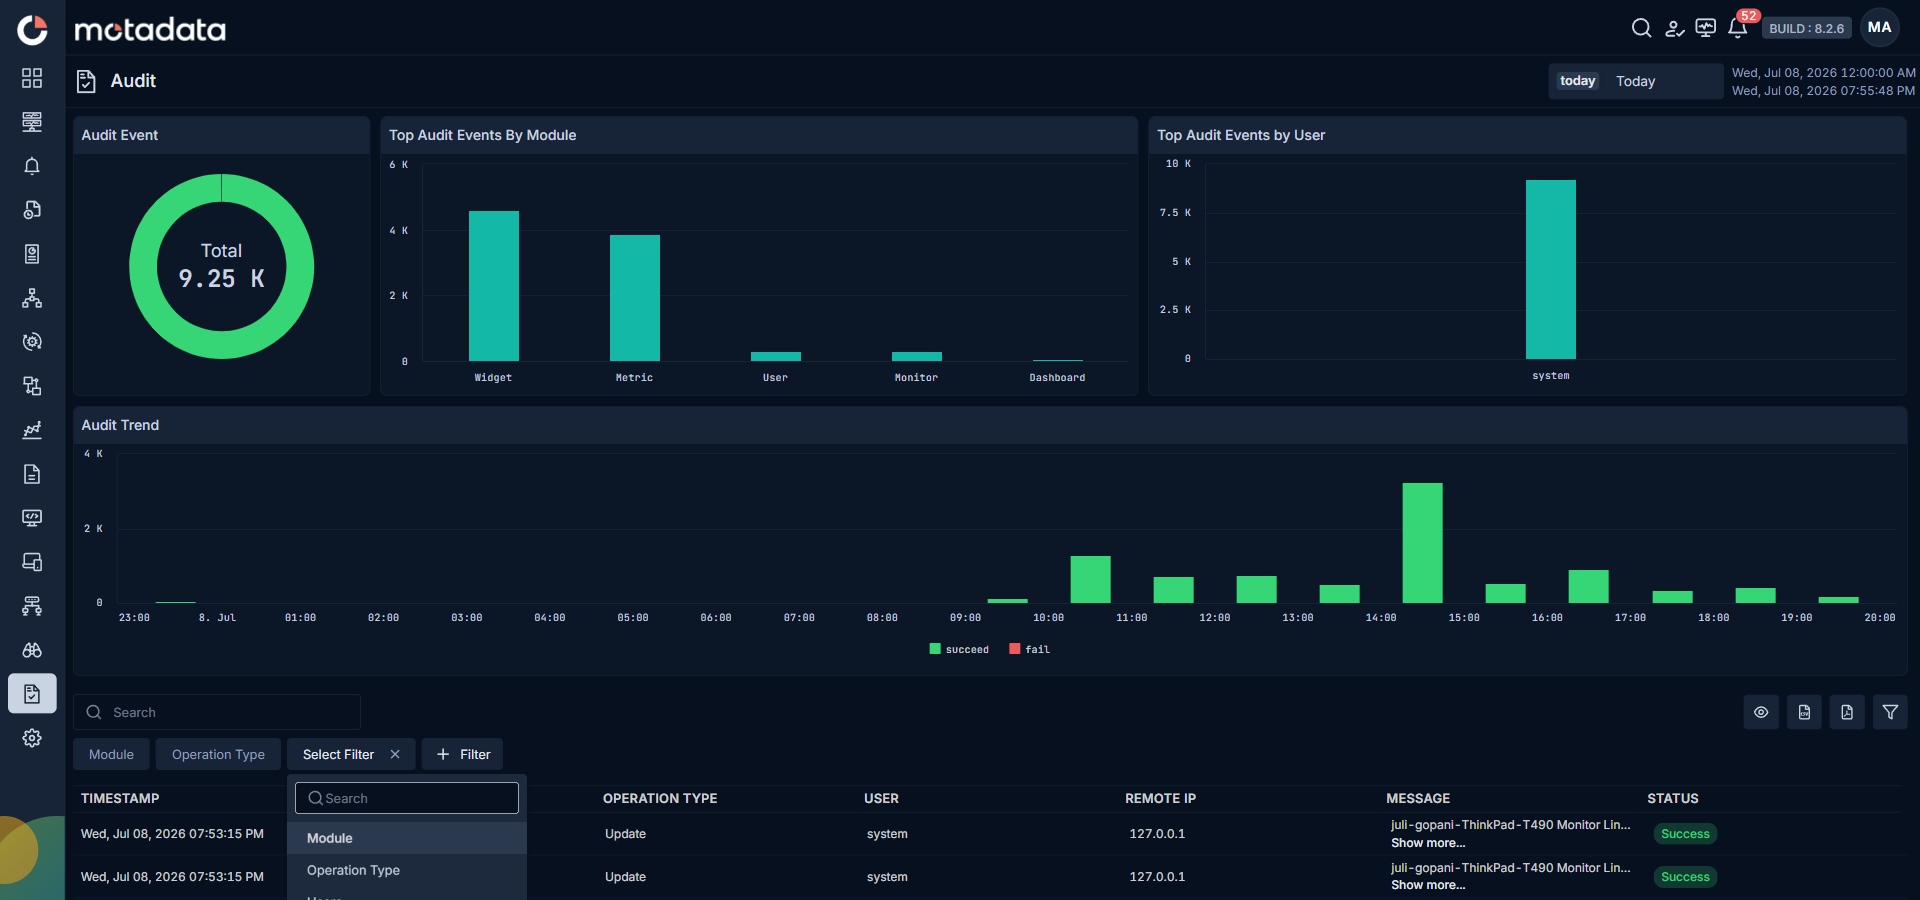
| Filter | What It Filters | Example Use |
|---|---|---|
| Module | Show only events from one part of the system | Filter by Monitor to investigate a broken alert |
| Operation Type | Show only Create, Update, or Delete events | Filter by Delete to find what was removed |
| Users | Show only events from a specific user account | Filter by username to audit that person's actions |
| Status | Show only Success or Fail events | Filter by Fail to find what went wrong in a time period |
Select your criteria and select Apply to update the table. Select Clear to remove all active filters.
You can combine filters. For example: Module = Monitor and Status = Fail shows all monitor changes that failed today.
View What Changed
Every row in the Message column shows a short summary of the change. Select Show more... on any row to open the Audit Trail Details panel and see exactly what was different before and after.
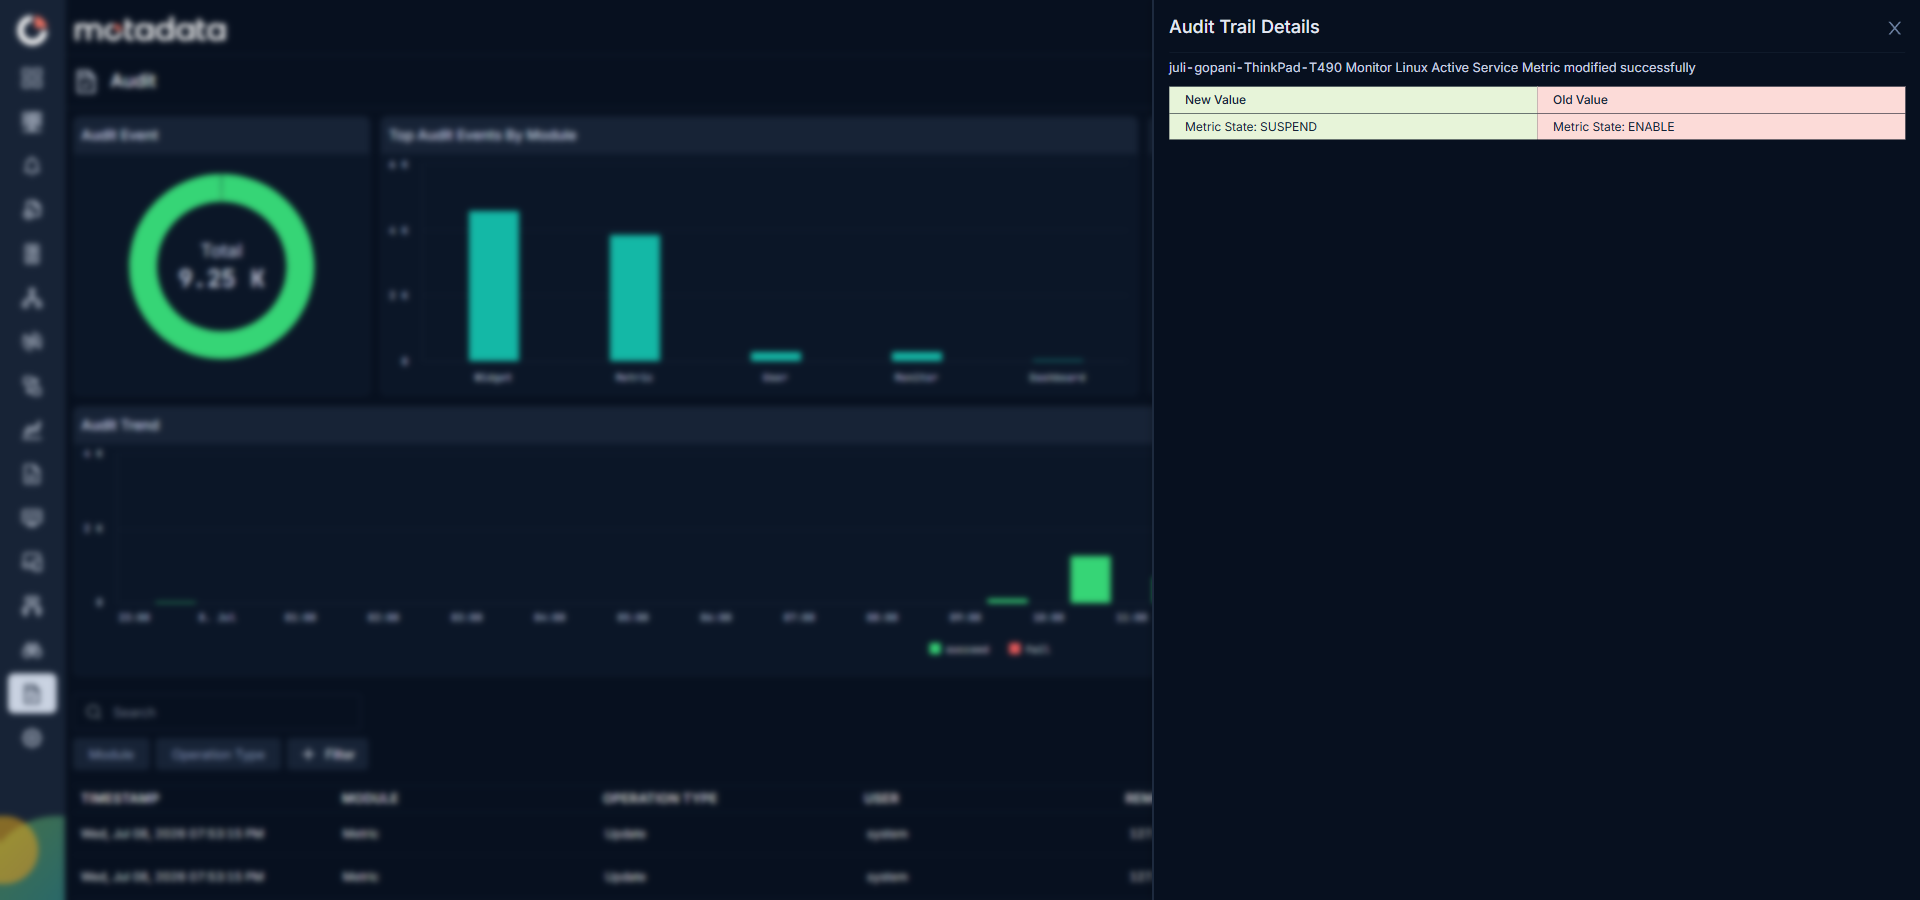
| Column | What It Shows | How to Read It |
|---|---|---|
| New Value | The value after the change was applied | This is what the setting or field looks like now |
| Old Value | The value before the change was made | This is what it was before someone changed it |
For example: a row for a metric change might show New Value: Metric State: SUSPEND and Old Value: Metric State: ENABLE. This tells you the metric was running before this change and was suspended by it.
Close the panel by selecting X in the top-right corner of the panel, or press Escape.
Troubleshooting
The Audit table shows no records. The selected time range has no activity. Change the time range at the top right of the page to a wider window and check again.
A filter is active but I can't see the filter chips.
The quick filter chips row is hidden. Select in the toolbar to show it again.
The export file is empty. Your current filter or search returned zero results. Clear all active filters, then export again.
I selected Show more... but the detail panel did not open. The page may have reloaded. Scroll to any row in the table and select Show more... again.
The Audit Trend chart shows no data for some time periods. No audit events occurred during those periods. This is normal during low-activity times like nights or weekends.
Related Topics
- Alerts and Policies: configure alert policies that generate audit events when modified
- User Settings: manage user accounts whose actions appear in the audit trail
- System Settings: configure system-level settings that generate audit events when changed