WebLogic
This guide explains how to instrument a Java application running on WebLogic by selecting a Linux agent or Windows agent for trace ingestion.
- Linux
- Windows
Prerequisites
- The Motadata Agent must be installed and running on the server where the WebLogic-based application is deployed. The
otelcolmust be running as part of the Motadata Agent. To check the agent status, open a Linux terminal and run:
service motadata-agent status
- Java version must be 8 or higher:
java -version
- The WebLogic domain directory (i.e.,
DOMAIN_HOME/bin/setDomainEnv.sh) is available. - You have permission to edit WebLogic domain configuration and restart WebLogic.
- Confirm how WebLogic is started in your environment. Script-based startup is assumed in this guide.
Configuration Steps
Step1: Register the Application Service in Motadata ObserveOps (formerly known as AIOps)
Go to Menu > Settings > APM > Application Registration. Clicking the Application Registration button, you can register a new application.
From the application registration screen, select the instrumentation type Host/VM or Docker.
- Host/VM
- Docker
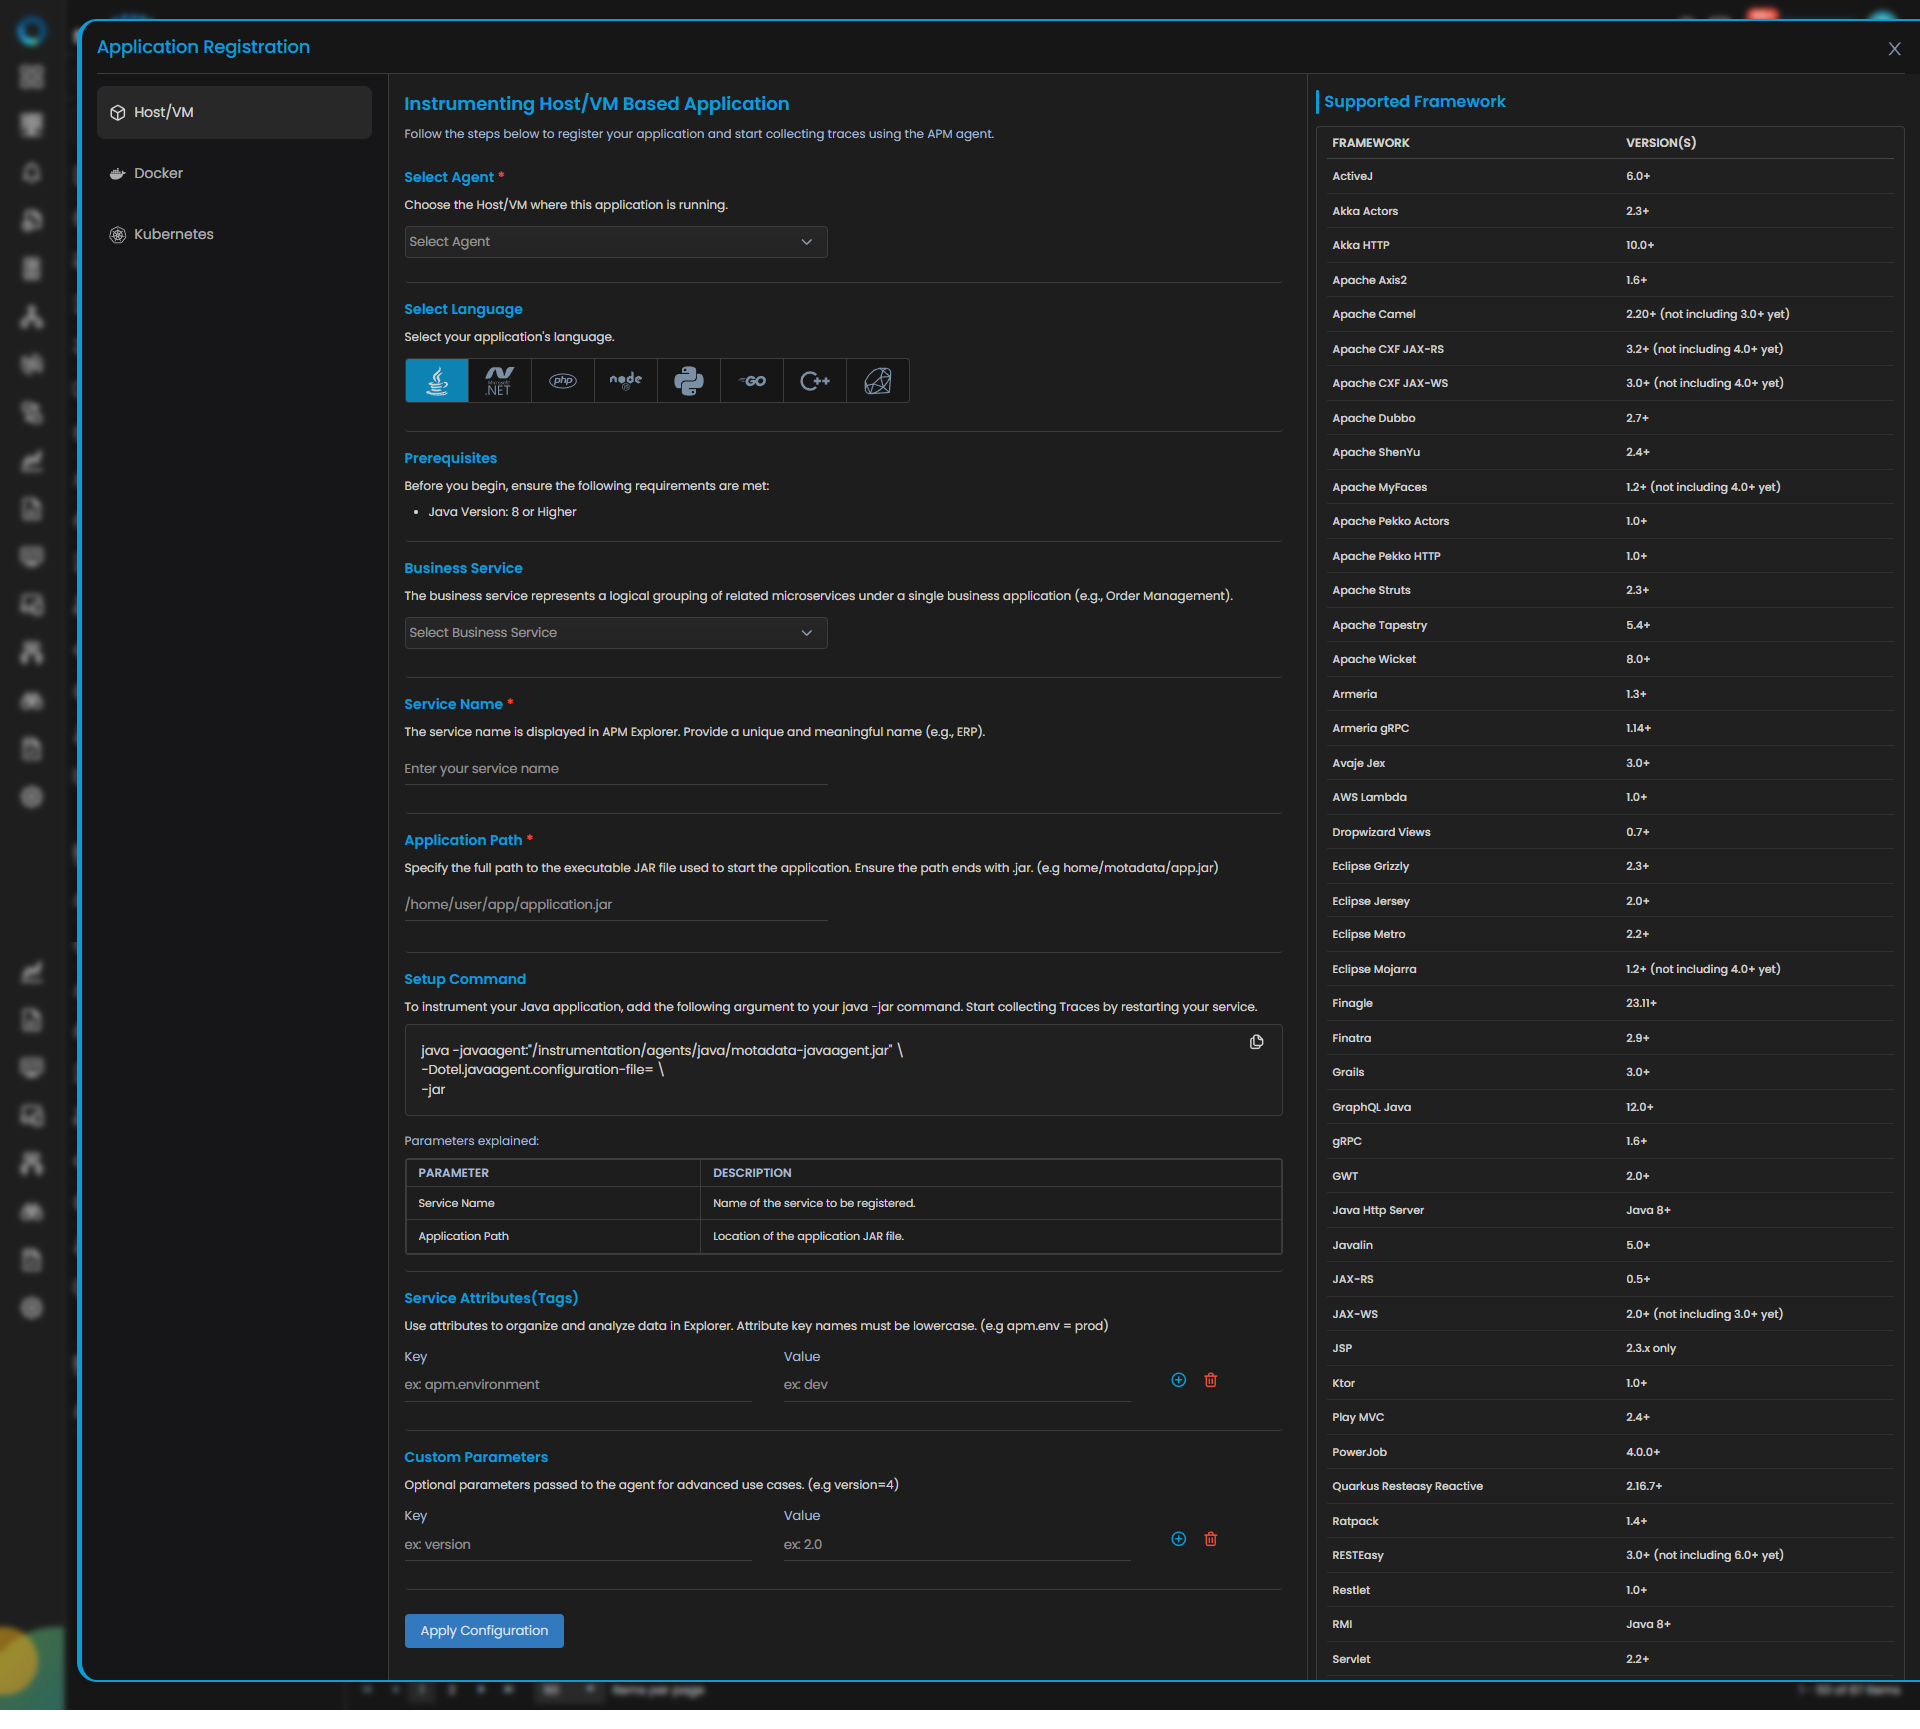
Java Trace Configuration
| Field | Description |
|---|---|
| Select Agent | Select the Host/VM where this application is running. |
| Select Language | Select Java from the language icons. |
| Business Service | The business service represents a logical grouping of related microservices under a single business application (for example, Order Management). Add or select an available service group from the drop-down to add your application service to the dedicated business service group. |
| Service Name | Provide a unique and meaningful name (for example, ERP). |
| Application Path | Specify the full path to the executable file used to start the application (for example, your WebLogic startup path if required by your internal standard). |
| Service Attributes (Tags) | Add key-value tags to your application for better filtering and organizing data in Explorer. Attribute keys must be in lowercase (for example, apm.env = prod). To add multiple Key-Value pairs, click the add icon. |
| Add Custom Parameters | Define custom sampling or tagging parameters for advanced use cases. These optional parameters are passed to the agent (for example, version=4). |
Clicking the Apply Configuration button, you need to run the displayed Setup Command to instrument your Java application. Add the displayed argument to your java -jar command and restart the service to collect traces.
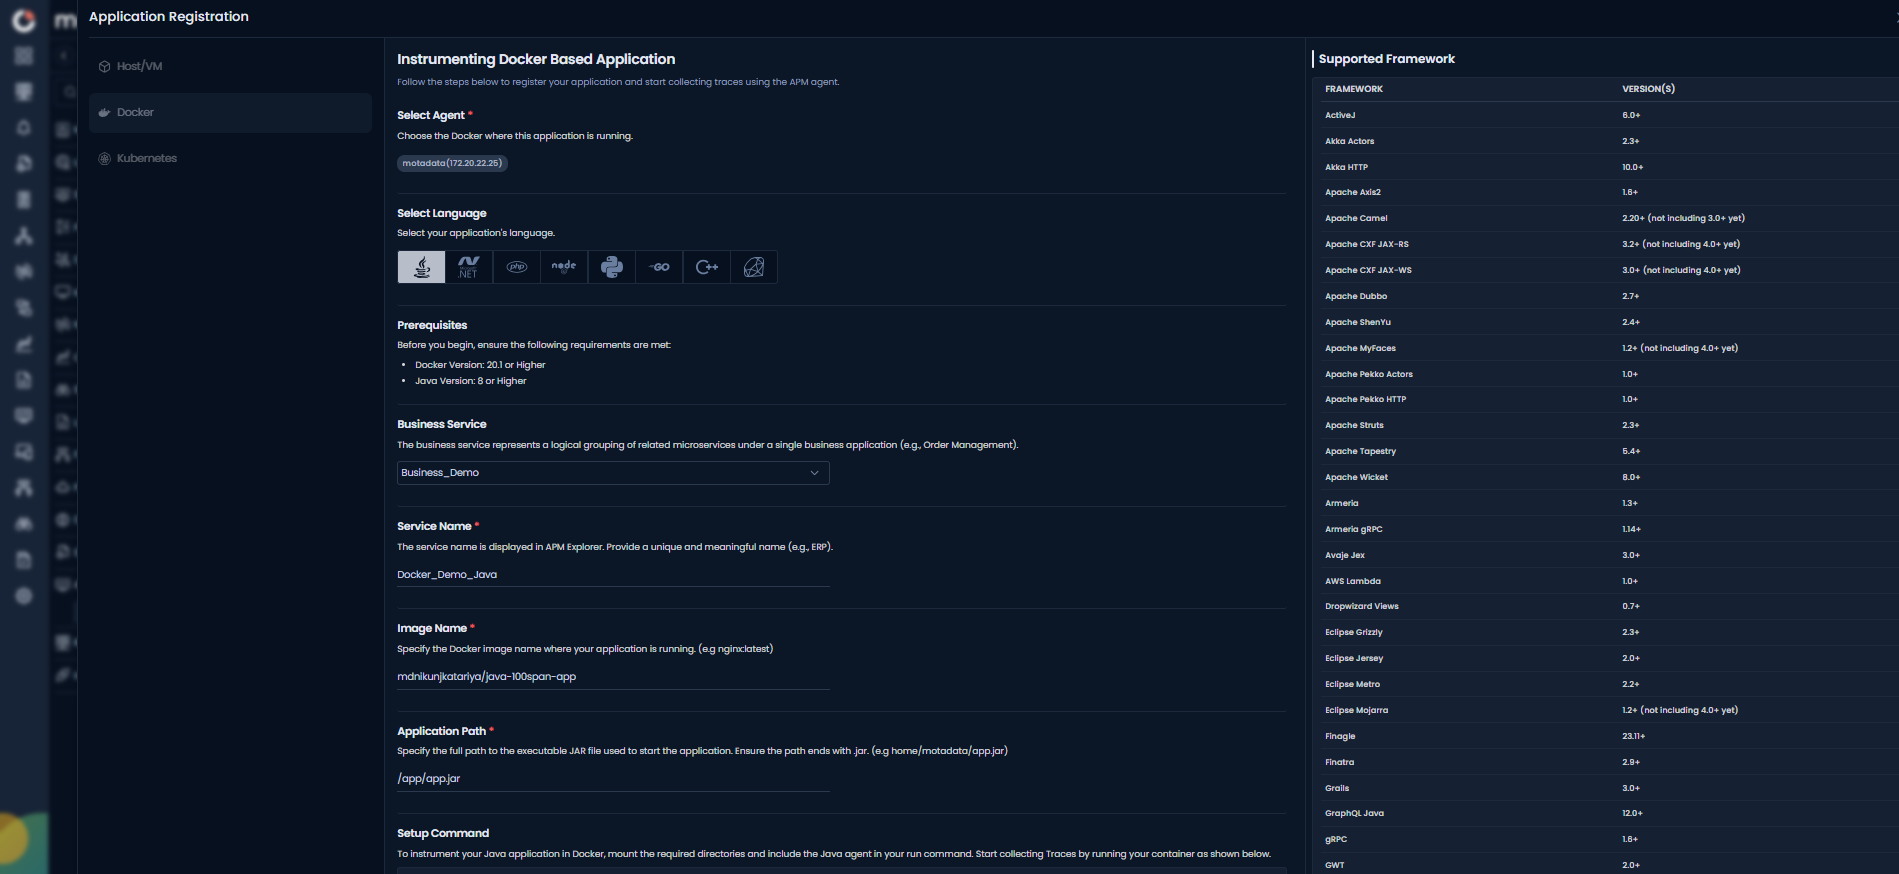
Java Trace Configuration
| Field | Description |
|---|---|
| Select Agent | Select the Linux agent that can access the Docker host where WebLogic is running. |
| Select Language | Select Java from the language icons. |
| Business Service | The business service represents a logical grouping of related microservices under a single business application (for example, Order Management). Add or select an available service group from the drop-down to add your application service to the dedicated business service group. |
| Service Name | Provide a unique and meaningful name (for example, ERP). |
| Application Path | Specify the container-side path as per your runtime standard. |
| Service Attributes (Tags) | Add key-value tags to your application for better filtering and organizing data in Explorer. Attribute keys must be in lowercase (for example, apm.env = prod). To add multiple Key-Value pairs, click the add icon. |
| Add Custom Parameters | Define custom sampling or tagging parameters for advanced use cases. These optional parameters are passed to the agent (for example, version=4). |
Clicking the Apply Configuration button, you need to run the displayed Setup Command to instrument your Java application. Add the displayed argument to your java -jar command and restart the service to collect traces.
Step2: Configure WebLogic for Instrumentation
WebLogic instrumentation loads the Motadata Java Agent on every server startup. Follow the instructions based on how WebLogic is started in your environment.
- startWebLogic.sh Method
- Managed Server Instances Method
WebLogic Admin Server Started Using Startup Script
Locate startWebLogic.sh
Go to your WebLogic domain directory:
<DOMAIN_HOME>/bin/startWebLogic.sh
Replace <DOMAIN_HOME> with your WebLogic domain path (for example, /u01/oracle/domains/base_domain).
Stop WebLogic
Use your standard stop method:
<DOMAIN_HOME>/bin/stopWebLogic.sh
Add Motadata Java Agent Configuration
Open startWebLogic.sh and add the following export before the line that launches the JVM:
export JAVA_OPTIONS="$JAVA_OPTIONS \
-javaagent:/motadata/motadata/instrumentation/agents/java/motadata-javaagent.jar \
-Dotel.javaagent.configuration-file=/motadata/motadata/config/<ServiceName>.properties"
Replace <ServiceName> with the exact service name you registered in Motadata ObserveOps.
Start WebLogic
<DOMAIN_HOME>/bin/startWebLogic.sh
WebLogic Managed Server Instances
Use this method when your application runs on WebLogic Managed Server instances. Configure the Java agent through the WebLogic Admin Console so the arguments apply to the specific Managed Server.
Open the WebLogic Admin Console
Go to your WebLogic Admin Console in a browser:
http://<AdminServerHost>:<AdminServerPort>/console
Navigate to the Managed Server Configuration
- Go to Environment > Servers.
- Click the name of the Managed Server where your application runs.
- Go to the Server Start tab.
Add Motadata Java Agent Configuration
In the Arguments field, add:
-javaagent:/motadata/motadata/instrumentation/agents/java/motadata-javaagent.jar -Dotel.javaagent.configuration-file=/motadata/motadata/config/<ServiceName>.properties
Replace <ServiceName> with the exact service name you registered in Motadata ObserveOps.
- Click Save.
Restart the Managed Server
Restart the Managed Server from the Admin Console or using your standard operational method.
Changes to the Server Start tab take effect only after a full Managed Server restart, not a graceful shutdown.
Ensure WebLogic starts successfully and the Java agent loads without errors.
Step3: Verify APM Trace Ingestion
Once the application is running, verify the following:
- Confirm that the service has been registered successfully.
- On the service registration screen, the Service Trace Collection Status should display Running.
- Generate traffic on the application (open UI pages or call APIs) and confirm traces appear in APM Explorer.
Prerequisites
- The Motadata Agent must be installed and running on the server where the WebLogic-based application is deployed. To verify agent status, press Win + R and open:
services.msc
- Java version must be 8 or higher. Run from Command Prompt:
java -version
- The WebLogic domain directory (i.e.,
DOMAIN_HOME) is available. - You have permission to edit WebLogic domain configuration files and restart WebLogic.
Configuration Steps
Step1: Register the Application Service in Motadata ObserveOps
Go to Menu > Settings > APM > Application Registration. Clicking the Application Registration button, you can register a new application.
From the application registration screen, select the instrumentation type as Host/VM.
Java Trace Configuration
| Field | Description |
|---|---|
| Select Agent | Select the Host/VM where this application is running. |
| Select Language | Select Java from the language icons. |
| Business Service | The business service represents a logical grouping of related microservices under a single business application (for example, Order Management). Add or select an available service group from the drop-down to add your application service to the dedicated business service group. |
| Service Name | Provide a unique and meaningful name (for example, ERP). |
| Application Path | Specify the full path as per your environment standard (if required by your setup). |
| Service Attributes (Tags) | Add key-value tags to your application for better filtering and organizing data in Explorer. Attribute keys must be in lowercase (for example, apm.env = prod). To add multiple Key-Value pairs, click the add icon. |
| Add Custom Parameters | Define custom sampling or tagging parameters for advanced use cases. These optional parameters are passed to the agent (for example, version=4). |
Clicking the Apply Configuration button, you need to run the displayed Setup Command to instrument your Java application. Add the displayed argument to your java -jar command and restart the service to collect traces.
Step2: Configure WebLogic for Instrumentation
WebLogic instrumentation on Windows loads the Motadata Java Agent on every server startup. Choose one method based on how WebLogic runs in your environment.
- startWebLogic.cmd Method
- Managed Server Instances Method
WebLogic Admin Server Started Using Startup Script
Locate startWebLogic.cmd
Go to your WebLogic domain directory:
%DOMAIN_HOME%\bin\startWebLogic.cmd
Replace %DOMAIN_HOME% with your WebLogic domain path (for example, C:\Oracle\Middleware\user_projects\domains\base_domain).
Stop WebLogic
Stop WebLogic using your standard approach before making any configuration changes.
Add Motadata Java Agent Configuration
Open startWebLogic.cmd using Notepad as Administrator and add the following line before the line that launches the JVM:
set JAVA_OPTIONS=%JAVA_OPTIONS% -javaagent:C:\motadata\motadata\instrumentation\agents\java\motadata-javaagent.jar -Dotel.javaagent.configuration-file=C:\motadata\motadata\config\<ServiceName>.properties
Replace <ServiceName> with the exact service name you registered in Motadata ObserveOps.
Start WebLogic
%DOMAIN_HOME%\bin\startWebLogic.cmd
WebLogic Managed Server Instances
Use this method when your application runs on WebLogic Managed Server instances. Configure the Java agent through the WebLogic Admin Console so the arguments apply to the specific Managed Server.
Open the WebLogic Admin Console
Go to your WebLogic Admin Console in a browser:
http://<AdminServerHost>:<AdminServerPort>/console
Navigate to the Managed Server Configuration
- Go to Environment > Servers.
- Click the name of the Managed Server where your application runs.
- Go to the Server Start tab.
Add Motadata Java Agent Configuration
In the Arguments field, add:
-javaagent:C:\motadata\motadata\instrumentation\agents\java\motadata-javaagent.jar -Dotel.javaagent.configuration-file=C:\motadata\motadata\config\<ServiceName>.properties
Replace <ServiceName> with the exact service name you registered in Motadata ObserveOps.
- Click Save.
Restart the Managed Server
Restart the Managed Server from the Admin Console or using your standard operational method.
Changes to the Server Start tab take effect only after a full Managed Server restart, not a graceful shutdown.
Restart WebLogic
Restart WebLogic based on how it runs in your environment.
Script-Based Startup
%DOMAIN_HOME%\bin\startWebLogic.cmd
Windows Service Startup
Restart the WebLogic service from Services (services.msc).
WebLogic now starts with the Motadata Java Agent enabled.
Ensure WebLogic starts successfully and the Java agent loads without errors.
Step3: Verify APM Trace Ingestion
Once the application is running, verify the following:
- Confirm that the service has been registered successfully.
- On the service registration screen, the Service Trace Collection Status should display Running.
- Generate traffic on the application (open UI pages or call APIs) and confirm traces appear in APM Explorer.