Overview
Motadata APM supports Java trace ingestion using OTEL and its custom agent. Java applications must run on supported versions (i.e., Java v8 and above) of the JDK, and trace ingestion is agent-based with runtime instrumentation.
Navigation
Go to Menu > Settings > APM > Application Registration. Clicking the Application Registration button, you can register a new application. From the application registration screen, select the instrumentation type Host/VM or Docker.
Prerequisites
- The Motadata Agent must be installed and running on the server where the Jetty-based application is deployed. Also, the otelcol should be running as part of the Motadata Agent. To check the agent status open a Linux terminal and run the below command:
service motadata-agent status
If the agent is not running, restart it using the below command:
service motadata-agent stop
service motadata-agent start
- Java Version Must Be 8 or Higher. To check the version you can use the below command:
java -version
- Host/VM
- Docker
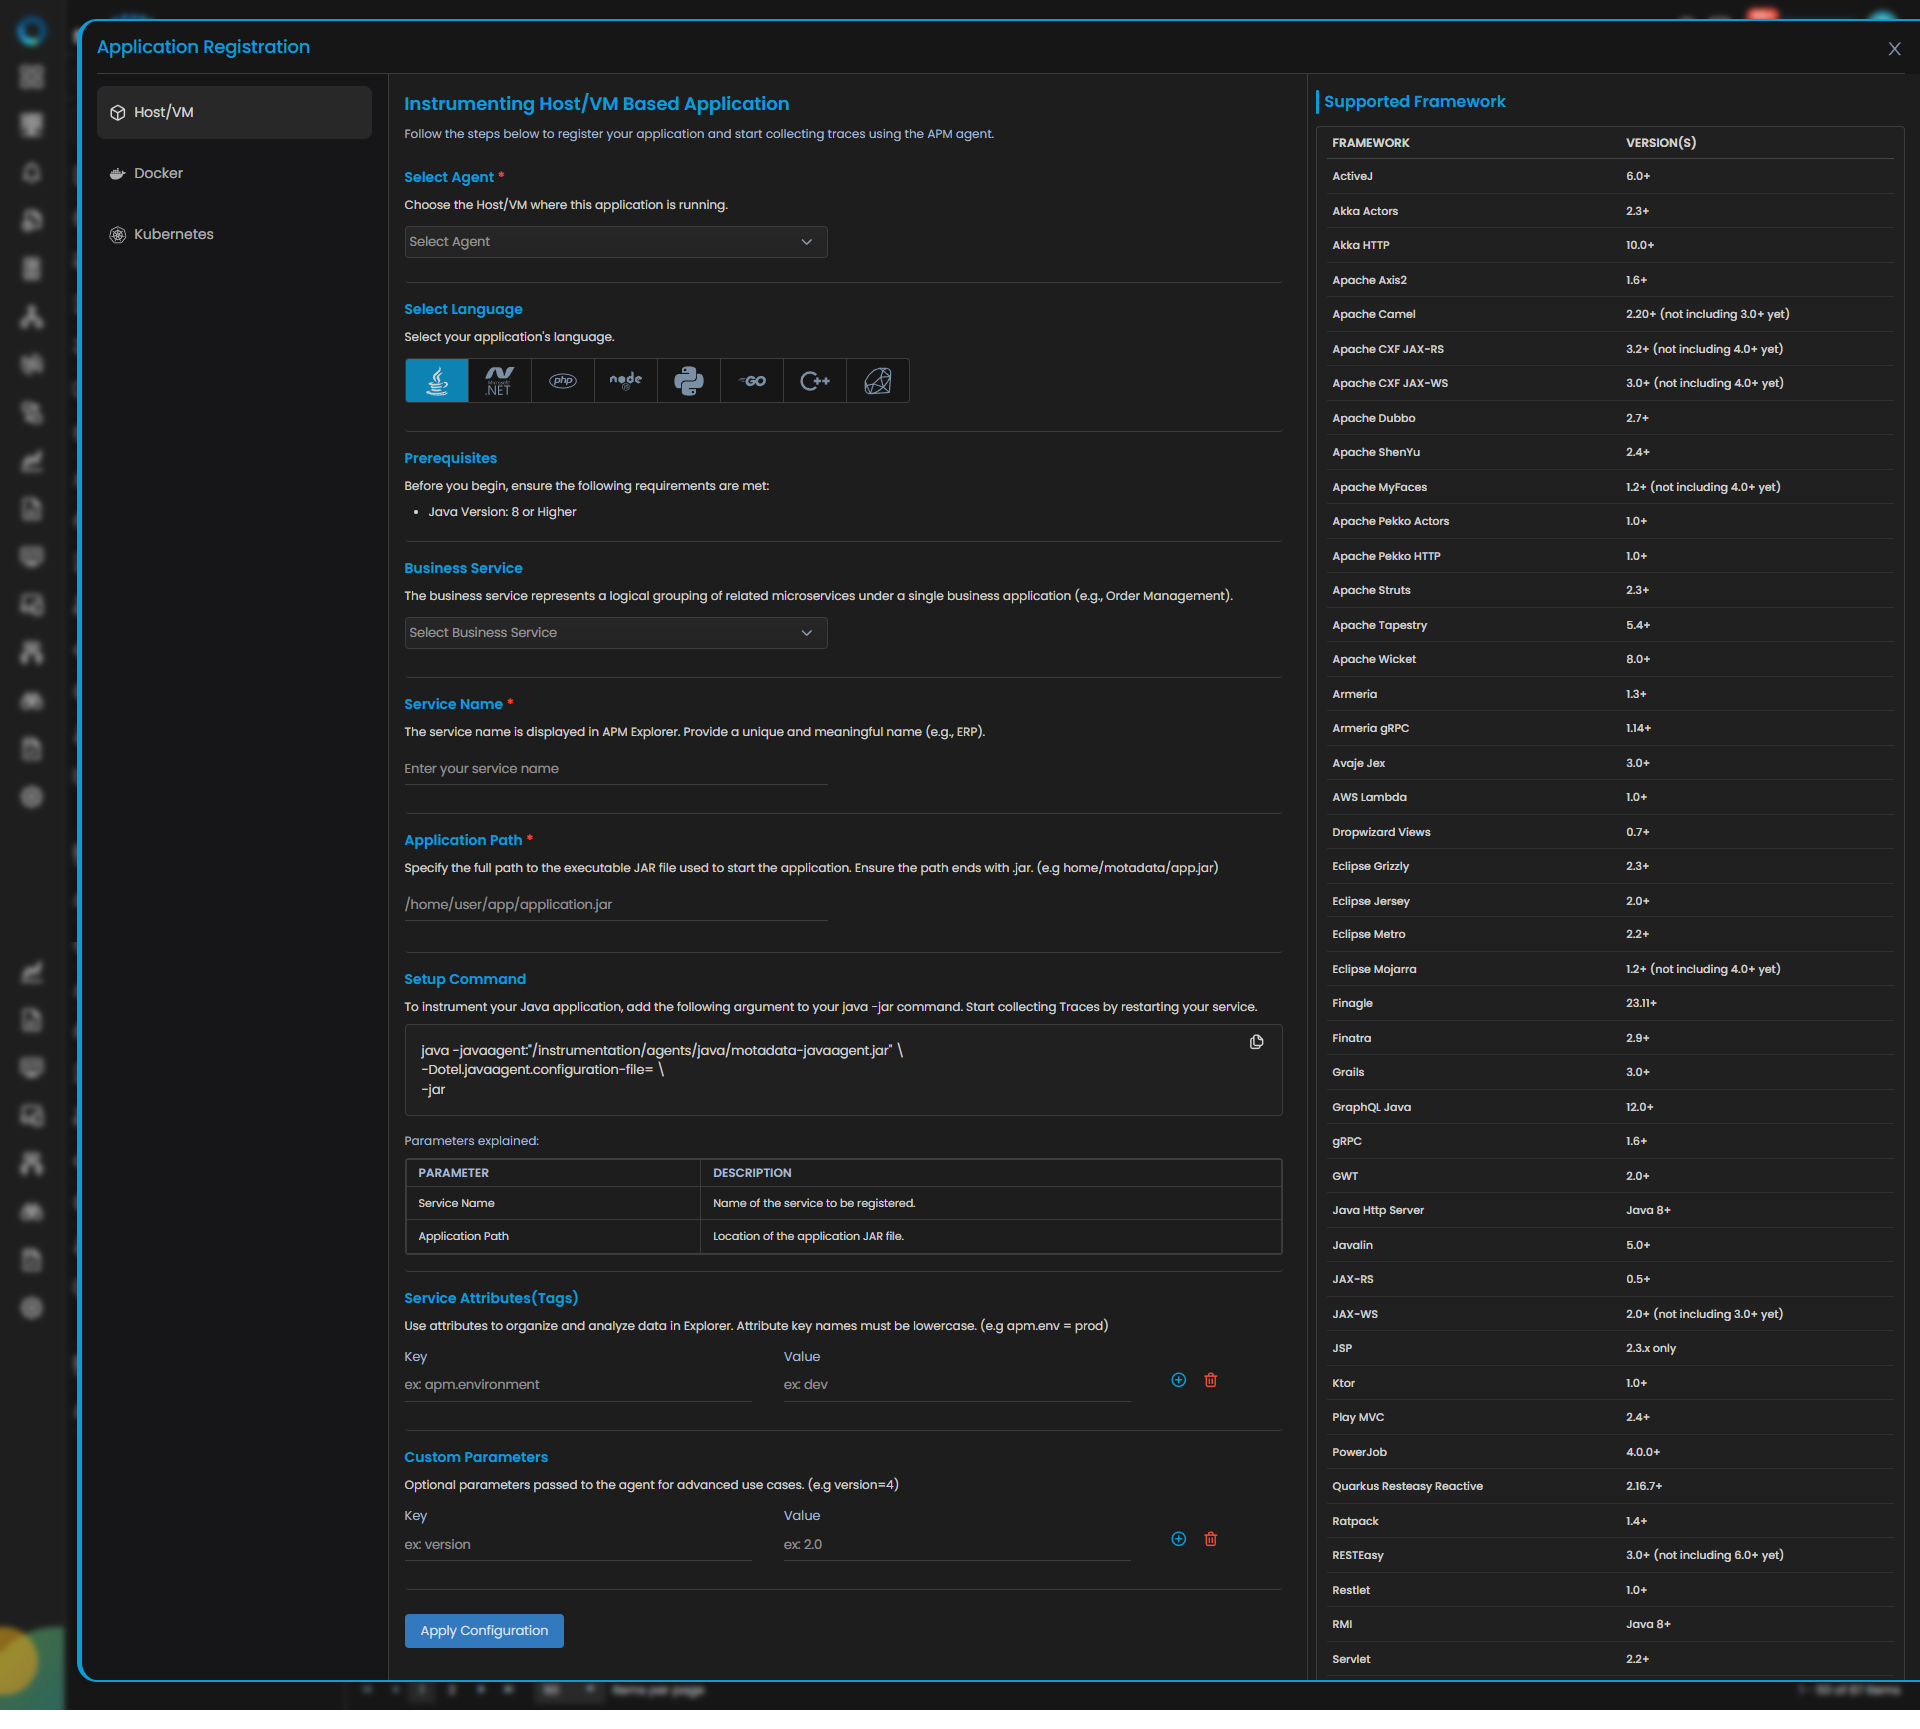
Java Trace Configuration
| Field | Description |
|---|---|
| Select Agent | Select the Host/VM where this application is running. You can configure Java application service for both Windows and Linux type agent. |
| Language | Select Java from the language icons. |
| Business Service | The business service represents a logical grouping of related microservices under a single business application (e.g., Order Management). Adding or selecting the available service group from the drop-down will add your application service to the dedicated business service group. |
| Service Name | Provide a unique and meaningful name (e.g., ERP). |
| Application Path | Specify the full path to the executable JAR file used to start the application. Ensure the path ends with .jar. (e.g home/motadata/app.jar) |
| Service Attributes(Tags) | Add key–value tags to your application for better filtering and organizing data in Explorer. Attribute keys must be in lowercase (for example, apm.env = prod). To add multiple Key-Value pairs you can click the add icon. |
| Add Custom Parameters | Allows you to define custom sampling or tagging parameters for advanced use cases. These optional parameters are passed to the agent (for example, version=4). |
Clicking the Apply Configuration button, you need to run the displayed Setup Command to instrument your Java application.
java -javaagent:"/motadata/motadata/instrumentation/agents/java/motadata-javaagent.jar" \
-Dotel.javaagent.configuration-file="/motadata/motadata/config/JavaAPP_Demo.properties" \
-jar "/root/APM/JDK8-APP/App-1.jar"
Add the displayed argument to your java -jar command using terminal to collect Traces.

You can configure Trace ingestion according to the framework used to build the application. The below mentioned are the supported frameworks.
Supported Frameworks
The following frameworks are supported for instrumentation and monitoring. Ensure your application version aligns with the minimum supported version listed below.
| Framework | Supported Version(s) |
|---|---|
| ActiveJ | 6.0+ |
| Akka Actors | 2.3+ |
| Akka HTTP | 10.0+ |
| Apache Axis2 | 1.6+ |
| Apache Camel | 2.20+ (excluding 3.0+ for now) |
| Apache CXF JAX-RS | 3.2+ (excluding 4.0+ for now) |
| Apache CXF JAX-WS | 3.0+ (excluding 4.0+ for now) |
| Apache Dubbo | 2.7+ |
| Apache ShenYu | 2.4+ |
| Apache MyFaces | 1.2+ (excluding 4.0+ for now) |
| Apache Pekko Actors | 1.0+ |
| Apache Pekko HTTP | 1.0+ |
| Apache Struts | 2.3+ |
| Apache Tapestry | 5.4+ |
| Apache Wicket | 8.0+ |
| Armeria | 1.3+ |
| Armeria gRPC | 1.14+ |
| Avaje Jex | 3.0+ |
| AWS Lambda | 1.0+ |
| Dropwizard Views | 0.7+ |
| Eclipse Grizzly | 2.3+ |
| Eclipse Jersey | 2.0+ |
| Eclipse Metro | 2.2+ |
| Eclipse Mojarra | 1.2+ (excluding 4.0+ for now) |
| Finagle | 23.11+ |
| Finatra | 2.9+ |
| Grails | 3.0+ |
| GraphQL Java | 12.0+ |
| gRPC | 1.6+ |
| GWT | 2.0+ |
| Java HTTP Server | Java 8+ |
| Javalin | 5.0+ |
| JAX-RS | 0.5+ |
| JAX-WS | 2.0+ (excluding 3.0+ for now) |
| JSP | 2.3.x only |
| Ktor | 1.0+ |
| Play MVC | 2.4+ |
| PowerJob | 4.0.0+ |
| Quarkus Resteasy Reactive | 2.16.7+ |
| Ratpack | 1.4+ |
| RESTEasy | 3.0+ (excluding 6.0+ for now) |
| Restlet | 1.0+ |
| RMI | Java 8+ |
| Servlet | 2.2+ |
| Spark Web Framework | 2.3+ |
| Spring Batch | 3.0+ (excluding 5.0+ for now) |
| Spring Boot | All supported production versions |
| Spring Cloud AWS | 3.0+ |
| Spring Cloud Gateway | 2.0+ |
| Spring Core | 2.0+ |
| Spring Integration | 4.1+ (excluding 6.0+ for now) |
| Spring RMI | 4.0+ |
| Spring Scheduling | 3.1+ |
| Spring Web MVC | 3.1+ |
| Spring Web Services | 2.0+ (excluding 4.0+ for now) |
| Spring WebFlux | 5.3+ |
| Undertow | 1.4+ |
| Vaadin | 14.2+ |
| Vert.x Web | 3.0+ |
| XXL-JOB | 1.9.2+ |
| ZIO | 2.0+ |
Supported Database
| Database | Version(s) |
|---|---|
| Alibaba Druid | 1.0+ |
| Apache DBCP | 2.0+ |
| Cassandra Driver | 3.0+ |
| Clickhouse Client | 0.5+ |
| Couchbase Client | 2.0 - 2.7.x |
| Couchbase Client | 3.1+ |
| c3p0 | 0.9.2+ |
| Elasticsearch API Client | 7.16 - 7.17.19, 8.0 - 8.9.+ |
| Elasticsearch REST Client | 5.0+ |
| Elasticsearch Transport Client | 5.0+ |
| Geode Client | 1.4+ |
| Hibernate | 3.3+ |
| Hibernate Reactive | 1.0+ |
| HikariCP | 3.0+ |
| InfluxDB Client | 2.4+ |
| JDBC | Java 8+ |
| Jedis | 1.4+ |
| Lettuce | 4.0+ |
| MongoDB Driver | 3.1+ |
| MyBatis | 3.2+ |
| OpenSearch Rest Client | 1.0+ |
| Oracle UCP | 11.2+ |
| R2DBC | 1.0+ |
| Rediscala | 1.8+ |
| Redisson | 3.0+ |
| Spymemcached | 2.12+ |
| Spring Data | 1.8+ |
| Tomcat JDBC Pool | 8.5+ |
| Vert.x Redis Client | 4.0+ |
| Vert.x SQL Client | 4.0+ |
| Vibur DBCP | 11.0+ |
Supported Queue
| Queue | Version(s) |
|---|---|
| Apache Kafka Producer/Consumer API | 0.11+ |
| Apache Kafka Streams API | 0.11+ |
| Apache Pulsar | 2.8+ |
| Apache RocketMQ gRPC/Protobuf-based Client | 5.0+ |
| Apache RocketMQ Remoting-based Client | 4.8+ |
| JMS | 1.1+ |
| RabbitMQ Client | 2.7+ |
| Spring JMS | 2.0+ |
| Spring Kafka | 2.7+ |
| Spring Pulsar | 1.0+ |
| Spring RabbitMQ | 1.0+ |
| Vert.x Kafka Client | 3.6+ |
Supported Others
| Library | Version(s) |
|---|---|
| Apache HttpAsyncClient | 4.1+ |
| Apache HttpClient | 2.0+ |
| AsyncHttpClient | 1.9+ |
| AWS SDK | 1.11 - 1.12.583, 2.2+ |
| Azure Core | 1.14+ |
| Dropwizard Metrics | 4.0+ (disabled by default) |
| Eclipse Jetty HTTP Client | 9.2 - 9.4.x, 12.0+ |
| Google HTTP Client | 1.19+ |
| Guava ListenableFuture | 10.0+ |
| HttpURLConnection | Java 8+ |
| Hystrix | 1.4+ |
| Java Executors | Java 8+ |
| Java Http Client | Java 11+ |
| java.util.logging | Java 8+ |
| Java Platform | Java 8+ |
| JAX-RS Client | 1.1+ |
| JBoss Log Manager | 1.1+ |
| Jodd Http | 4.2+ |
| Kotlin Coroutines | 1.0+ |
| Kubernetes Client | 7.0+ |
| Log4j 1 | 1.2+ |
| Log4j 2 | 2.11+ |
| Logback | 1.0+ |
| Micrometer | 1.5+ (disabled by default) |
| Netty HTTP codec | 3.8+ |
| OpenAI Java SDK | 1.1+ |
| OkHttp | 2.2+ |
| OSHI | 5.3.1+ |
| Play WS | 1.0+ |
| Quartz | 2.0+ |
| Reactor | 3.1+ |
| Reactor Netty | 0.9+ |
| RxJava | 1.0+ |
| Scala ForkJoinPool | 2.8+ |
| Spring RestTemplate | 3.1+ |
| Twilio | 6.6+ (not including 8.0+ yet) |
| Vert.x HttpClient | 3.0+ |
| Vert.x RxJava2 | 3.5+ |
Once the Application is Running, you need to verify the below points:
- Confirm that the service has been registered successfully.
- On the service registration screen, the Service Trace Collection Status should display "Running."
- The traces will start appearing in the APM Explorer screen.
- Docker Run
- Docker Compose
- Docker Swarm
Java Trace Configuration

| Field | Description |
|---|---|
| Select Agent | Select the Docker where this application is running. You can configure Java application service for Linux type agent. |
| Language | Select Java from the language icons. |
| Business Service | The business service represents a logical grouping of related microservices under a single business application (e.g., Order Management). Adding or selecting the available service group from the drop-down will add your application service to the dedicated business service group. |
| Service Name | Provide a unique and meaningful name (e.g., ERP). |
| Application Path | Specify the full path to the executable JAR file used to start the application. Ensure the path ends with .jar. (e.g home/motadata/app.jar) |
| Service Attributes(Tags) | Add key–value tags to your application for better filtering and organizing data in Explorer. Attribute keys must be in lowercase (for example, apm.env = prod). To add multiple Key-Value pairs you can click the add icon. |
| Add Custom Parameters | Allows you to define custom sampling or tagging parameters for advanced use cases. These optional parameters are passed to the agent (for example, version=4). |
Clicking the Apply Configuration button, you need to run the displayed Setup Command to instrument your Java application.
docker run -d \
--add-host=host.docker.internal:host-gateway \
-v "/motadata/motadata/instrumentation:/motadata/instrumentation" \
-v "/motadata/motadata/config:/motadata/config" \
mdnikunjkatariya/java-100span-app \
-javaagent:"/motadata/instrumentation/agents/java/motadata-javaagent.jar" \
-Dotel.javaagent.configuration-file="/motadata/config/Docker_Demo_Java.properties" \
-jar /app/app.jar
Add the displayed argument to your java -jar command using terminal to collect Traces.

You can configure Trace ingestion according to the framework used to build the application. The below mentioned are the supported frameworks.
Supported Frameworks
The following frameworks are supported for instrumentation and monitoring. Ensure your application version aligns with the minimum supported version listed below.
| Framework | Supported Version(s) |
|---|---|
| ActiveJ | 6.0+ |
| Akka Actors | 2.3+ |
| Akka HTTP | 10.0+ |
| Apache Axis2 | 1.6+ |
| Apache Camel | 2.20+ (excluding 3.0+ for now) |
| Apache CXF JAX-RS | 3.2+ (excluding 4.0+ for now) |
| Apache CXF JAX-WS | 3.0+ (excluding 4.0+ for now) |
| Apache Dubbo | 2.7+ |
| Apache ShenYu | 2.4+ |
| Apache MyFaces | 1.2+ (excluding 4.0+ for now) |
| Apache Pekko Actors | 1.0+ |
| Apache Pekko HTTP | 1.0+ |
| Apache Struts | 2.3+ |
| Apache Tapestry | 5.4+ |
| Apache Wicket | 8.0+ |
| Armeria | 1.3+ |
| Armeria gRPC | 1.14+ |
| Avaje Jex | 3.0+ |
| AWS Lambda | 1.0+ |
| Dropwizard Views | 0.7+ |
| Eclipse Grizzly | 2.3+ |
| Eclipse Jersey | 2.0+ |
| Eclipse Metro | 2.2+ |
| Eclipse Mojarra | 1.2+ (excluding 4.0+ for now) |
| Finagle | 23.11+ |
| Finatra | 2.9+ |
| Grails | 3.0+ |
| GraphQL Java | 12.0+ |
| gRPC | 1.6+ |
| GWT | 2.0+ |
| Java HTTP Server | Java 8+ |
| Javalin | 5.0+ |
| JAX-RS | 0.5+ |
| JAX-WS | 2.0+ (excluding 3.0+ for now) |
| JSP | 2.3.x only |
| Ktor | 1.0+ |
| Play MVC | 2.4+ |
| PowerJob | 4.0.0+ |
| Quarkus Resteasy Reactive | 2.16.7+ |
| Ratpack | 1.4+ |
| RESTEasy | 3.0+ (excluding 6.0+ for now) |
| Restlet | 1.0+ |
| RMI | Java 8+ |
| Servlet | 2.2+ |
| Spark Web Framework | 2.3+ |
| Spring Batch | 3.0+ (excluding 5.0+ for now) |
| Spring Boot | All supported production versions |
| Spring Cloud AWS | 3.0+ |
| Spring Cloud Gateway | 2.0+ |
| Spring Core | 2.0+ |
| Spring Integration | 4.1+ (excluding 6.0+ for now) |
| Spring RMI | 4.0+ |
| Spring Scheduling | 3.1+ |
| Spring Web MVC | 3.1+ |
| Spring Web Services | 2.0+ (excluding 4.0+ for now) |
| Spring WebFlux | 5.3+ |
| Undertow | 1.4+ |
| Vaadin | 14.2+ |
| Vert.x Web | 3.0+ |
| XXL-JOB | 1.9.2+ |
| ZIO | 2.0+ |
Supported Database
| Database | Version(s) |
|---|---|
| Alibaba Druid | 1.0+ |
| Apache DBCP | 2.0+ |
| Cassandra Driver | 3.0+ |
| Clickhouse Client | 0.5+ |
| Couchbase Client | 2.0 - 2.7.x |
| Couchbase Client | 3.1+ |
| c3p0 | 0.9.2+ |
| Elasticsearch API Client | 7.16 - 7.17.19, 8.0 - 8.9.+ |
| Elasticsearch REST Client | 5.0+ |
| Elasticsearch Transport Client | 5.0+ |
| Geode Client | 1.4+ |
| Hibernate | 3.3+ |
| Hibernate Reactive | 1.0+ |
| HikariCP | 3.0+ |
| InfluxDB Client | 2.4+ |
| JDBC | Java 8+ |
| Jedis | 1.4+ |
| Lettuce | 4.0+ |
| MongoDB Driver | 3.1+ |
| MyBatis | 3.2+ |
| OpenSearch Rest Client | 1.0+ |
| Oracle UCP | 11.2+ |
| R2DBC | 1.0+ |
| Rediscala | 1.8+ |
| Redisson | 3.0+ |
| Spymemcached | 2.12+ |
| Spring Data | 1.8+ |
| Tomcat JDBC Pool | 8.5+ |
| Vert.x Redis Client | 4.0+ |
| Vert.x SQL Client | 4.0+ |
| Vibur DBCP | 11.0+ |
Supported Queue
| Queue | Version(s) |
|---|---|
| Apache Kafka Producer/Consumer API | 0.11+ |
| Apache Kafka Streams API | 0.11+ |
| Apache Pulsar | 2.8+ |
| Apache RocketMQ gRPC/Protobuf-based Client | 5.0+ |
| Apache RocketMQ Remoting-based Client | 4.8+ |
| JMS | 1.1+ |
| RabbitMQ Client | 2.7+ |
| Spring JMS | 2.0+ |
| Spring Kafka | 2.7+ |
| Spring Pulsar | 1.0+ |
| Spring RabbitMQ | 1.0+ |
| Vert.x Kafka Client | 3.6+ |
Supported Others
| Library | Version(s) |
|---|---|
| Apache HttpAsyncClient | 4.1+ |
| Apache HttpClient | 2.0+ |
| AsyncHttpClient | 1.9+ |
| AWS SDK | 1.11 - 1.12.583, 2.2+ |
| Azure Core | 1.14+ |
| Dropwizard Metrics | 4.0+ (disabled by default) |
| Eclipse Jetty HTTP Client | 9.2 - 9.4.x, 12.0+ |
| Google HTTP Client | 1.19+ |
| Guava ListenableFuture | 10.0+ |
| HttpURLConnection | Java 8+ |
| Hystrix | 1.4+ |
| Java Executors | Java 8+ |
| Java Http Client | Java 11+ |
| java.util.logging | Java 8+ |
| Java Platform | Java 8+ |
| JAX-RS Client | 1.1+ |
| JBoss Log Manager | 1.1+ |
| Jodd Http | 4.2+ |
| Kotlin Coroutines | 1.0+ |
| Kubernetes Client | 7.0+ |
| Log4j 1 | 1.2+ |
| Log4j 2 | 2.11+ |
| Logback | 1.0+ |
| Micrometer | 1.5+ (disabled by default) |
| Netty HTTP codec | 3.8+ |
| OpenAI Java SDK | 1.1+ |
| OkHttp | 2.2+ |
| OSHI | 5.3.1+ |
| Play WS | 1.0+ |
| Quartz | 2.0+ |
| Reactor | 3.1+ |
| Reactor Netty | 0.9+ |
| RxJava | 1.0+ |
| Scala ForkJoinPool | 2.8+ |
| Spring RestTemplate | 3.1+ |
| Twilio | 6.6+ (not including 8.0+ yet) |
| Vert.x HttpClient | 3.0+ |
| Vert.x RxJava2 | 3.5+ |
Once the Application is Running, you need to verify the below points:
- Confirm that the service has been registered successfully.
- On the service registration screen, the Service Trace Collection Status should display "Running."
- The traces will start appearing in the APM Explorer screen.
Prerequisites
Ensure the following are in place before proceeding:
| Requirement | Details |
|---|---|
| Docker & Docker Compose installed | docker --version and docker-compose --version |
| Application already running via Compose | docker ps shows the app container |
| Java agent JAR available on host | /motadata/motadata/instrumentation/agents/java/motadata-javaagent.jar |
Agent config .properties file available | /motadata/motadata/config/<Service_Name>.properties |
docker-compose.yml accessible | In the application's project directory |
Understanding the Generated Instrumentation Command
Motadata generates an instrumentation command in this format:
docker run -d \
  --add-host=host.docker.internal:host-gateway \
  -v "/motadata/motadata/instrumentation:/motadata/instrumentation" \
  -v "/motadata/motadata/config:/motadata/config" \
  <Image_Name> \
  -javaagent:"/motadata/instrumentation/agents/java/motadata-javaagent.jar" \
  -Dotel.javaagent.configuration-file="/motadata/config/<Service_Name>.properties" \
  -jar <Docker_Application_Path>
Do not run this command directly if the application is managed by Docker Compose. Instead, translate each flag into the docker-compose.yml as described below.
Step 1 — Verify Agent Files on the Host
ls /motadata/motadata/instrumentation/agents/java/motadata-javaagent.jar
ls /motadata/motadata/config/<Service_Name>.properties
If either file is missing, contact the Motadata team before proceeding.
Step 2 — Open docker-compose.yml
Navigate to the application's project directory:
cd /path/to/your/project
cat docker-compose.yml
Identify the app service block — this is the service running the Java application.
Step 3 — Add Volume Mounts
Locate the volumes: section under the app service and append the two instrumentation mounts.
Before:
    volumes:
      - ./logs:/app/logs
After:
    volumes:
      - ./logs:/app/logs
      - /motadata/motadata/instrumentation:/motadata/instrumentation
      - /motadata/motadata/config:/motadata/config
If no
volumes:section exists, add it at the same indentation level asenvironment:,ports:, etc.
Step 4 — Add JAVA_TOOL_OPTIONS Environment Variable
Locate the environment: section and add JAVA_TOOL_OPTIONS with both JVM flags. Replace <Service_Name> with the actual service name from the generated command.
Before:
    environment:
      SERVER_PORT: 8080
After:
    environment:
      SERVER_PORT: 8080
      JAVA_TOOL_OPTIONS: >-
        -javaagent:/motadata/instrumentation/agents/java/motadata-javaagent.jar
        -Dotel.javaagent.configuration-file=/motadata/config/<Service_Name>.properties
JAVA_TOOL_OPTIONSis automatically read by the JVM at startup. No Dockerfile or source code changes are needed.
The
>-YAML block scalar joins the two lines into a single string with a space — required for the JVM to parse both flags correctly.
Step 5 — Validate the YAML
docker-compose config
This prints the resolved configuration. If there are errors, fix them before proceeding.
Step 6 — Restart the Application
docker-compose down
docker-compose up -d --build
Step 7 — Verify Containers Are Running
docker ps
Both the app and any dependent services should show status Up.
Step 8 — Confirm Agent Loaded Successfully
docker logs <container_name> | grep -i "javaagent\|otel\|motadata\|opentelemetry"
A successful load will show output similar to:
[otel.javaagent] opentelemetry-javaagent - version: x.x.x
[otel.javaagent] Motadata APM Java agent initialized
Prerequisites
Ensure the following requirements are met before proceeding with instrumentation.
| Prerequisite | Requirement / Details |
|---|---|
| Docker & Docker Swarm enabled | Docker 20.10 or higher; run docker swarm init on the manager node |
| Docker image available | The service image must be accessible (local registry or Docker Hub) |
| Java agent JAR available on host | /motadata/motadata/instrumentation/agents/java/motadata-javaagent.jar |
Agent config .properties file available | /motadata/motadata/config/<Service_Name>.properties |
docker-compose.yml accessible | In the application's project directory |
All worker nodes must be joined to the swarm before deploying instrumented services.
Understanding the Generated Instrumentation Command
Motadata generates a docker run instrumentation command when you click Apply Configuration. Do not run this command directly if the application is managed by Docker Swarm. Instead, translate each flag into docker-compose.yml as described below.
Step 1 — Verify Agent Files on the Host
Confirm the agent JAR and config file exist on the manager node:
ls /motadata/motadata/instrumentation/agents/java/motadata-javaagent.jar
ls /motadata/motadata/config/<Service_Name>.properties
If either file is missing, contact the Motadata team before proceeding.
Step 2 — Open docker-compose.yml
Navigate to the application's project directory:
cd /path/to/your/project
cat docker-compose.yml
Identify the app service block — this is the service running the Java application.
Step 3 — Add extra_hosts
Add the host gateway mapping so the agent inside the container can reach the APM collector on the host:
Before:
    ports:
      - "8080:8080"
After:
    ports:
      - "8080:8080"

    extra_hosts:
      - "host.docker.internal:host-gateway"
Step 4 — Add Volume Mounts
Append the two instrumentation mounts to the volumes: section under the app service:
Before:
    volumes:
      - ./logs:/app/logs
After:
    volumes:
      - ./logs:/app/logs
      - /motadata/motadata/instrumentation:/motadata/instrumentation
      - /motadata/motadata/config:/motadata/config
If no
volumes:section exists, add it at the same indentation level asenvironment:,ports:, etc.
Step 5 — Add Custom entrypoint
Override the default container entrypoint to inject the Java agent at JVM startup. Replace <Service_Name> and <application.jar> with the actual values from the generated command:
    entrypoint:
      - "java"
      - "-javaagent:/motadata/instrumentation/agents/java/motadata-javaagent.jar"
      - "-Dotel.javaagent.configuration-file=/motadata/config/<Service_Name>.properties"
      - "-jar"
      - "/app/<application.jar>"
Step 6 — Validate the YAML
docker-compose config
This prints the resolved configuration. If there are errors, fix them before proceeding.
Step 7 — Deploy the Stack
docker stack deploy -c docker-compose.yml <stack_name>
To update an already-running stack:
docker stack deploy -c docker-compose.yml <stack_name> --with-registry-auth
Step 8 — Verify Services Are Running
docker service ls
The instrumented service should show the expected number of replicas in the REPLICAS column (e.g. 2/2).
Step 9 — Confirm Agent Loaded Successfully
Retrieve the container ID of a running task and check the logs:
docker service ps <stack_name>_<service_name>
docker logs <container_id> | grep -i "javaagent\|otel\|motadata\|opentelemetry"
A successful load will show output similar to:
[otel.javaagent] opentelemetry-javaagent - version: x.x.x
[otel.javaagent] Motadata APM Java agent initialized