APM Explorer
The APM Explorer provides a comprehensive, real-time view of trace data collected across your registered services. It helps you understand how requests flow through your system, identify performance bottlenecks, and diagnose errors efficiently.
The Explorer enables you to drill down into traces and spans for in-depth analysis, helping teams pinpoint issues and resolve them faster. Whether you're troubleshooting application errors, identifying slow services, or tracking key performance metrics, APM Explorer allows you to visualize the data and gain actionable insights.
Understanding APM Explorer
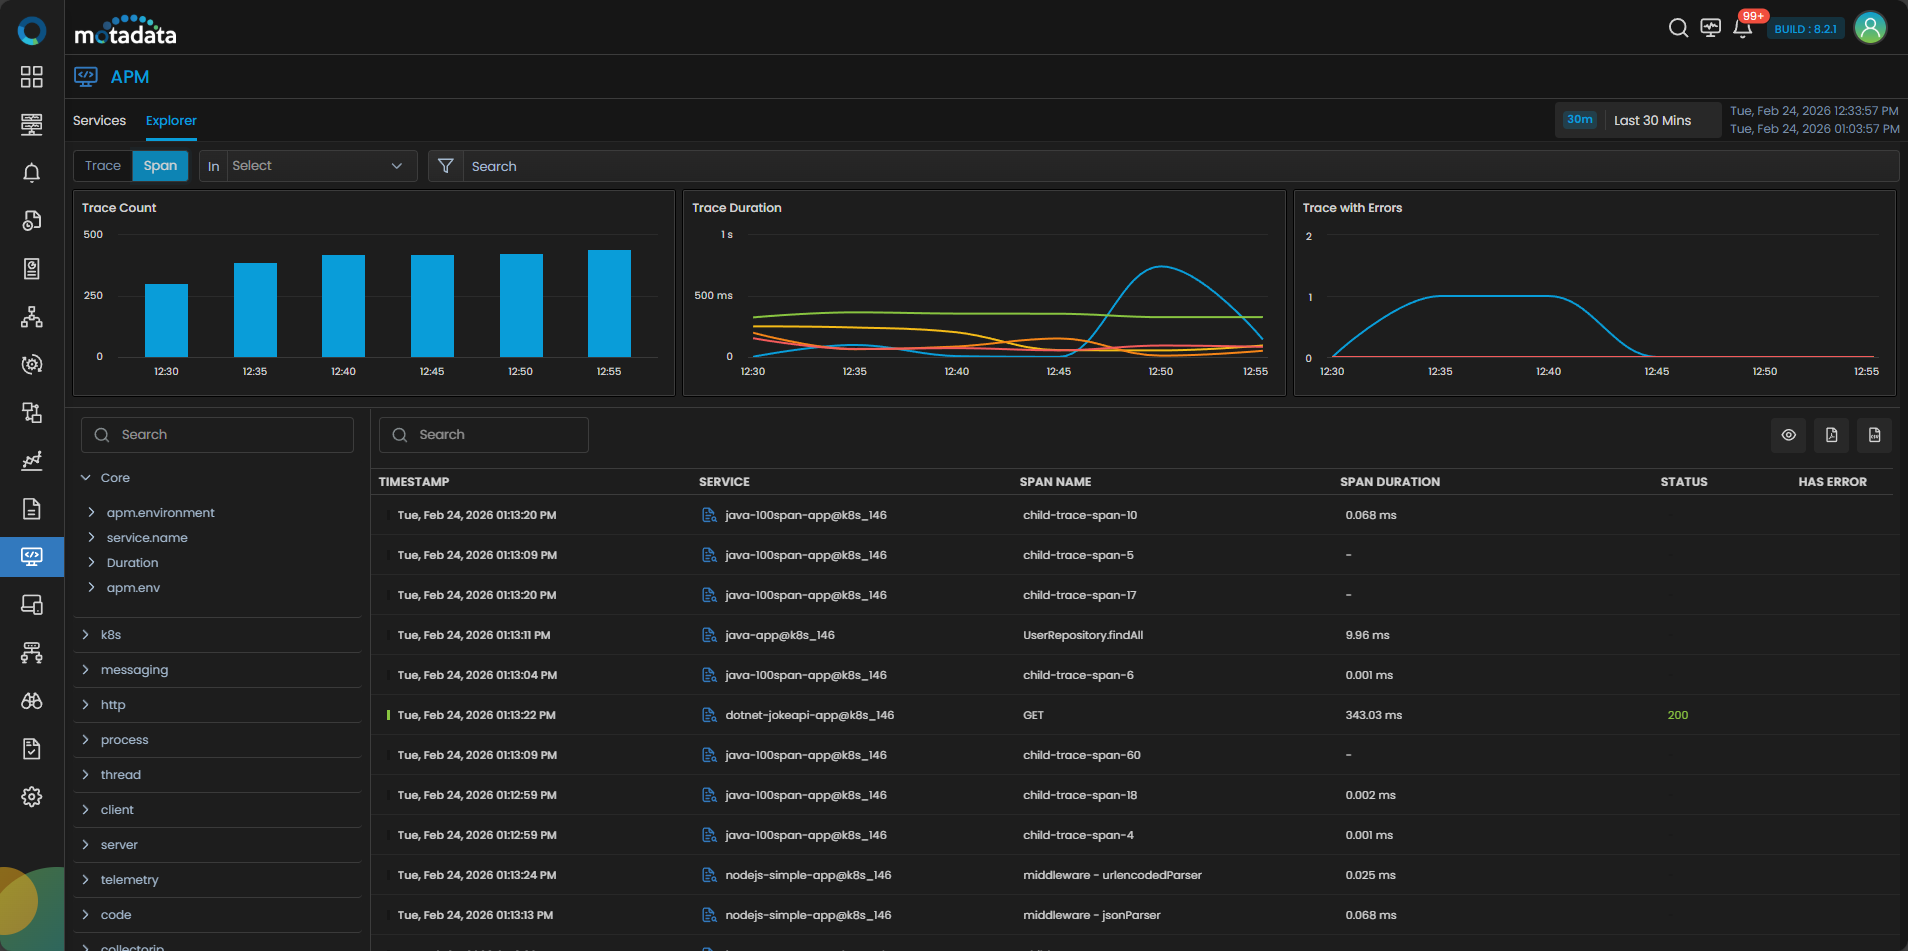
The APM Explorer section in Motadata AIOps allows you to visualize and analyze traces by filtering with Trace and Span.
Once your APM agent is set up and tracing data begins to flow in, you can start analyzing through different graphical methods:
- Trace Count: The total number of traces recorded.
- Trace Duration: The total duration of each trace.
- Trace with Errors: Displays traces that have encountered errors.
Switching Between Trace View and Span View
In the APM Explorer, you can select options between Trace and Span views at the left side top of the screen. This allows you to drill down into data at different levels of granularity.
- Trace View: Displays root spans and their aggregated data.
- Span View: Displays individual spans and their metrics for more detailed analysis.
By selecting either view, the entire interface dynamically adjusts to show data relevant to the chosen mode.
Metric Insight
Metric Insight is available across APM metric charts — including service-level, infrastructure-level, and process-level line chart widgets. While investigating traces, spans, or service performance in APM Explorer, the Metric Insight icon appears on the header of line chart widgets. Clicking it opens an insight panel that analyzes the metric being visualized using the same time range applied to the widget, giving you statistical depth without leaving the APM investigation context.
Statistical Insight
The Statistical Insight tab provides a comprehensive set of computed statistics for the metric over the selected time range:
| Statistic | Description |
|---|---|
| Average | The mean value of the metric across the selected time range. |
| Peak | The highest value recorded, along with the timestamp at which it occurred. |
| Minimum | The lowest value recorded, along with the timestamp at which it occurred. |
| P95 | The 95th percentile value — 95% of recorded values fall at or below this point. |
| Standard Deviation | Measures how much the metric values vary around the average. |
| Stability Score | An indicator of how consistently the metric behaves over the selected period. |
| Major Spikes | Lists the top spike events detected — sudden sharp increases that deviate from normal behavior. |
| Trend Overview | A high-level description of whether the metric is trending upward, downward, or remaining stable. |
| Short-Term Dynamics | Captures recent fluctuation behavior to highlight any immediate changes in the metric pattern. |
| Consistency Window | Identifies the period during which the metric remained within a stable range. |
| Anomaly Summary | A summary of detected anomalies within the selected time range. |
Statistical Summary
The Statistical Summary tab translates the computed statistics into a plain-language narrative covering trend direction, level of volatility, and any notable anomalies detected over the selected time range.
KPI Summary
The KPI Summary tab provides a health interpretation of the metric based on configured thresholds or baseline values:
| Status | Meaning |
|---|---|
| Healthy | The metric is performing within expected bounds. |
| Degrading | The metric is showing signs of deterioration and may require attention. |
| Critical | The metric has breached critical thresholds and requires immediate action. |
The Metric Insight panel always reflects the time range of the widget and updates accordingly when the time range changes.
Key Features in APM Explorer
Trace Visualization
In Trace View, the APM Explorer displays aggregated metrics for traces, such as:
- Trace Count: The total number of traces within the selected time window.
- Trace Duration: A graph showing how long each trace takes to complete, helping you identify any performance issues.
- Trace with Errors: A graph showing traces that encountered errors, which helps you identify problem areas.
Each service tile in the APM Explorer displays the relevant trace data and allows you to click on the timestamp to investigate deeper.

Span-Level Details
In Span View, individual spans are listed with more detailed information. Each row represents a single span, with the following metrics:
- Service: The service to which the span belongs.
- Duration: The time taken by the span.
- Status: The HTTP status or result of the span (e.g., 200, 404, 500).
- Resource: The resource (endpoint or operation) associated with the span.
- Spans: The number of spans tied to a specific trace.
Search and Filtering
You can use the search bar and filters at the top of the APM Explorer to narrow down your results. The filters allow you to refine your analysis by selecting In criteria. You can select options such as Service, Span, and Event Source from the In drop-down. Depending on this selection the search bar allows you to select counters for the pre-filters.
Exploring Trace Information
The APM Explorer displays a detailed grid with information about each trace:
| Field | Description |
|---|---|
| Timestamp | The time when the trace was recorded. |
| Services | The services involved in the trace (e.g., java-app, node-app). |
| Duration | The total duration of the trace. |
| Status | The HTTP status or response code of the span (e.g., 200, 500). |
| Resource | The operation or resource name (e.g., GET /products). |
| Spans | The number of spans tied to the trace. |
You can use Free Text Search to filter specific results in the displayed grid. From the displayed grid, you can click on the Timestamp of a span to view the complete journey of the Trace.  It will display all the child spans, methods used for the spans, and a lot more information. To learn more about it head to the Analyze Root Span Using Scattered Plot Chart section.
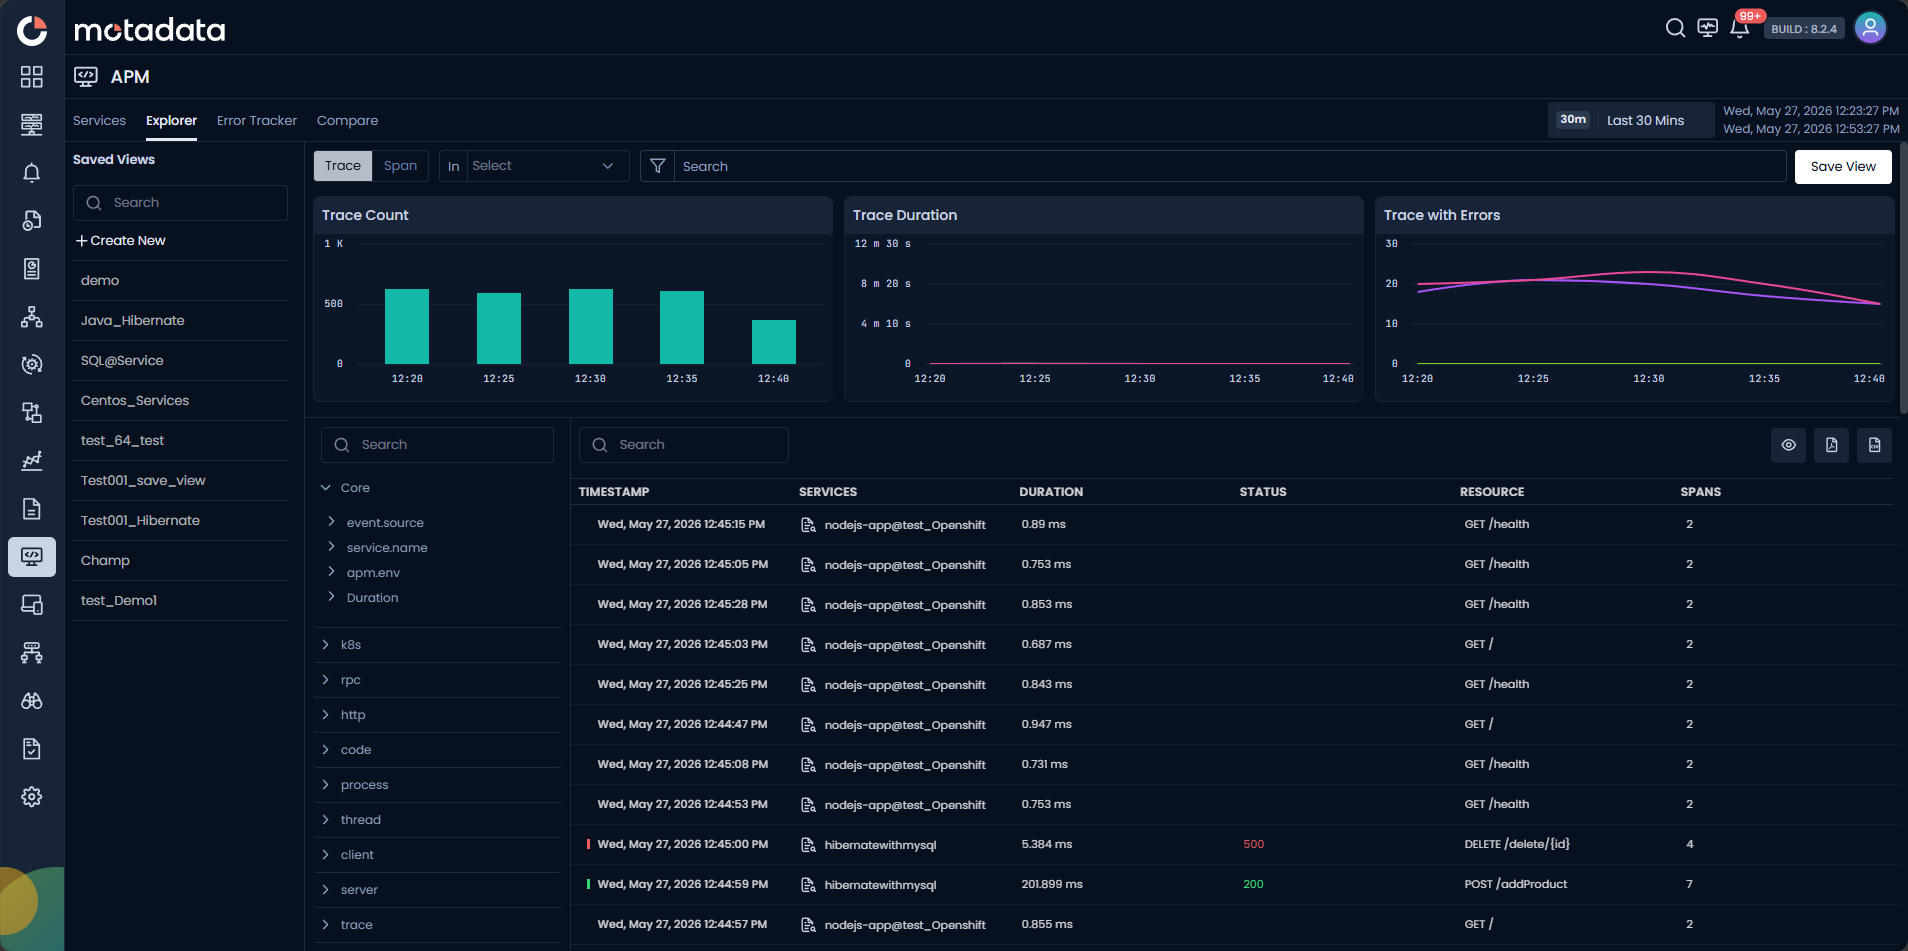
Saved Views
Saved Views lets you capture and reuse your current APM Explorer configuration as a named view. Instead of rebuilding the same filters, view type, and timeframe every time you investigate a recurring issue, you save the configuration once and apply it instantly on your next visit.
Saved Views work across both Trace view and Span view, and saved configurations persist across page refreshes, logouts, and navigation.
Save a View
The Save View button sits beside the Export Report button at the top right corner of APM Explorer.
To save a view configure your APM Explorer state by setting your search query, filters, view type (Trace or Span), timeframe, and sort then click Save View. Enter a Name, Description and Security as Public/ Private. Configuring this you can click the Save button.
If you select the Private security option, you can configure with whom you want to share it such as Users or User Profiles. According to this selection you can select the respective user(s) or user profile(s) from the drop-down list.
ObserveOps saves the following as part of a Saved View:
| Configuration | Description |
|---|---|
| Filters | All active filter criteria, including Service, Span, and Event Source. |
| View type | Whether the Explorer was in Trace view or Span view. |
| Timeframe | The selected time range at the time of saving. |
Access and Apply Saved Views
Saved views are available from the Saved Views panel on the left side. Click a view name to apply it instantly. ObserveOps immediately restores all saved configurations — the search query, filters, view type, timeframe, and sort order update to match the saved state.
If a saved view contains a filter that no longer matches any available data, ObserveOps applies the remaining valid configurations and displays the explorer without breaking. No error state is triggered.
You can modify the configurations to the selected saved view and click the Update View button in the top right corner, if required to update the saved view.
You can use the Delete option next to the view and confirm removal if required.