How to Configure Memory and Connection Pool?
Maximize your ServiceOps performance and stability by fine-tuning memory allocation and database connection pools to match your specific workload.
Proper memory and connection pool configuration is essential for optimizing ServiceOps performance, ensuring efficient resource utilization, and maintaining system stability under varying workloads. This guide provides comprehensive procedures for configuring memory allocation and database connection pools across all ServiceOps components.
ServiceOps performance optimization involves two critical aspects:
- Memory Configuration: Optimizing Java heap sizes for different services
- Connection Pool Configuration: Managing database connection pools for optimal throughput
Proper configuration of these parameters can significantly improve application responsiveness, reduce latency, and enhance scalability.
Prerequisites
Before configuring memory and connection pools:
System Requirements
- Root Access: Administrative privileges on the ServiceOps server
- Service Status: All services must be operational before configuration
- Backup: Always backup configuration files before making changes
- Elasticsearch: Must be running before configuring other services
Important Notes
- Update Order: Always update Elasticsearch memory first, then other services
- Memory Validation: Ensure minimum memory is always less than maximum memory
- Backup Requirement: Take configuration backups before any changes
- Service Dependencies: Understand service dependencies and startup order
Memory Configuration
Memory configuration involves setting Java heap sizes for different ServiceOps services. Proper memory allocation ensures optimal performance and prevents out-of-memory errors.
Set Java Heap Sizes
Two critical JVM parameters control memory allocation:
-Xms: Initial heap size (minimum memory allocated at startup)-Xmx: Maximum heap size (maximum memory the JVM can use)
Memory Allocation Matrix
The following matrix provides recommended memory settings based on total server memory:
| Memory Martix | ||||||
|---|---|---|---|---|---|---|
| ServiceOps Services | 16 GB | 32 GB | 64 GB | |||
| Minimum | Maximum | Minimum | Maximum | Minimum | Maximum | |
| Main Server | 1024 | 4096 | 4096 | 10240 | 1024 | 24576 |
| Analytics Server | 1024 | 4096 | 4096 | 8192 | 1024 | 16384 |
| Plugin Server | 512 | 1024 | 512 | 1024 | 512 | 2048 |
| Elasticsearch | 512 | 1024 | 512 | 1024 | 512 | 2048 |
- Allocate 50-75% of total server memory to Java heap sizes
- Reserve remaining memory for operating system and other processes
- Consider workload patterns when choosing between minimum and maximum values
- Monitor memory usage after configuration to optimize settings
Configuring Main Server Memory
The main server handles core ServiceOps functionality and requires significant memory allocation.
Stop Main Server Service:
systemctl stop ft-main-server
systemctl status ft-main-server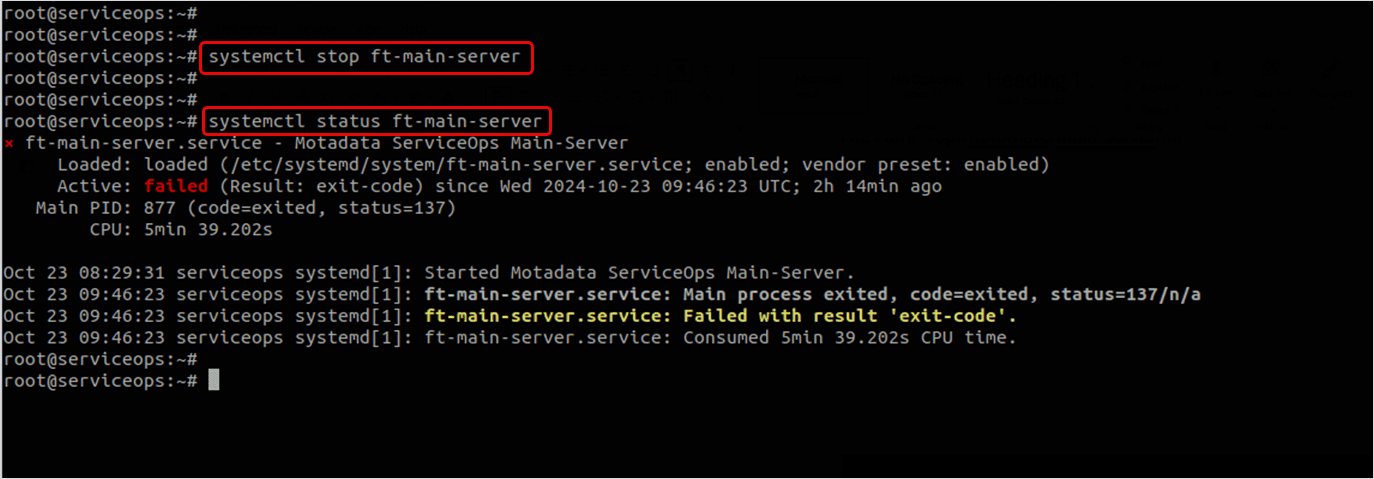
Edit Configuration File:
cd /opt/flotomate/main-server/lib/
vim boot-hosted-exec.conf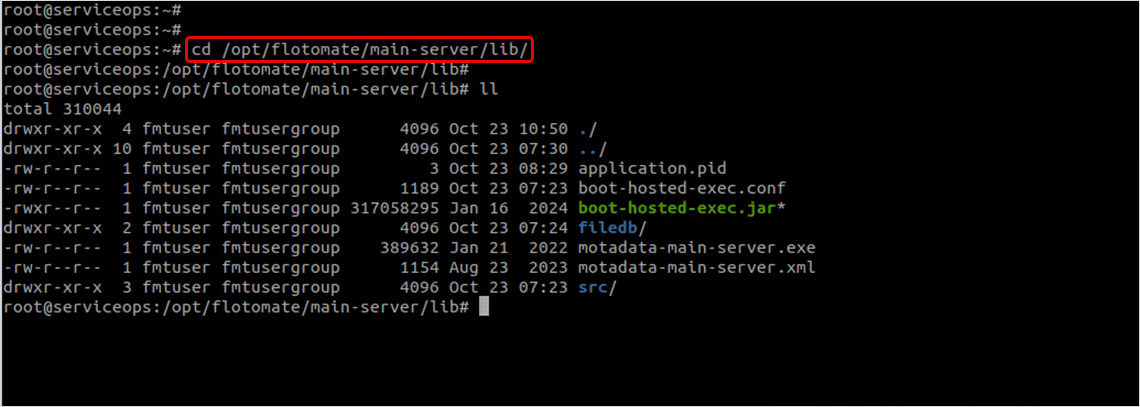
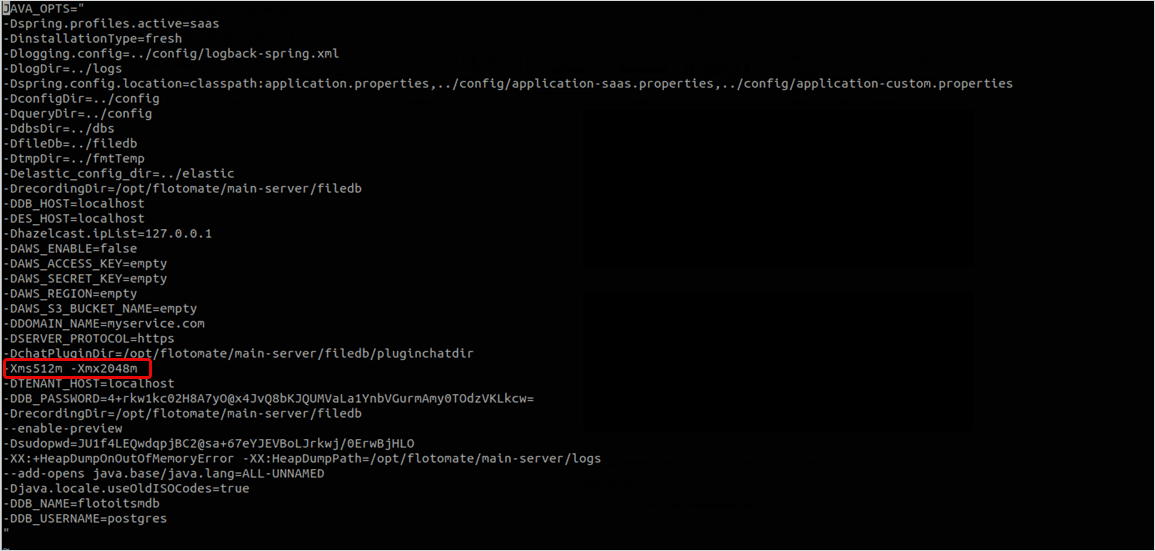
Update Memory Settings:
The default memory value is -Xms512m -Xms2048m. Replace it with a new value based on the total server memory. To allocate memory, use the above memory matrix table. For example, If the Total Server Memory is 16 GB, you can assign the main-server with min 1024 and max 5120 memory.
Example: -Xms1024m -Xms5120m
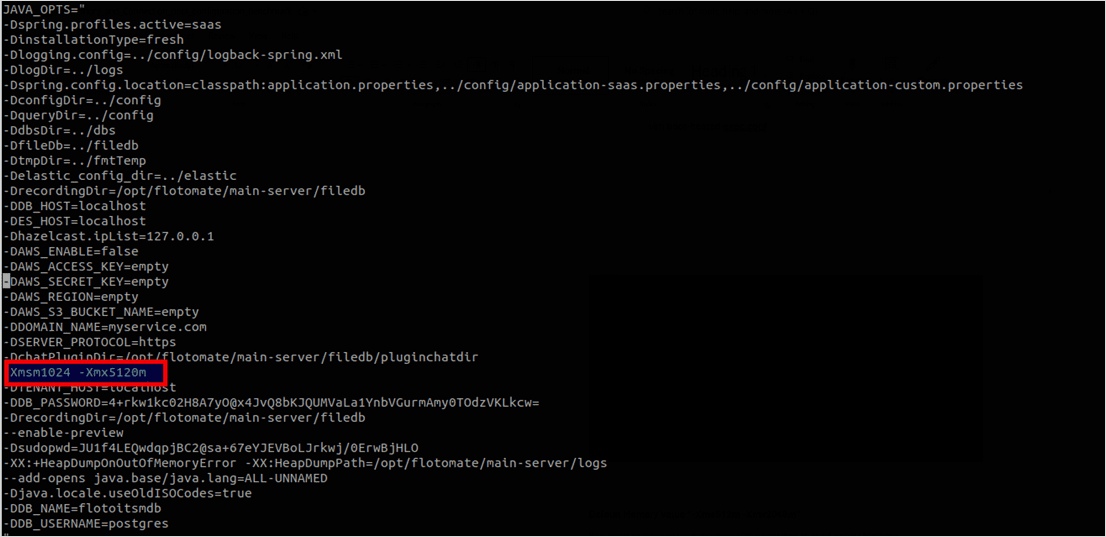
Once done, save the file.
Save and Restart Service:
Check the main-server service status, start its service, and again verify its status using the below commands:
# Save the file and restart service
systemctl status ft-main-server
systemctl start ft-main-server
systemctl status ft-main-server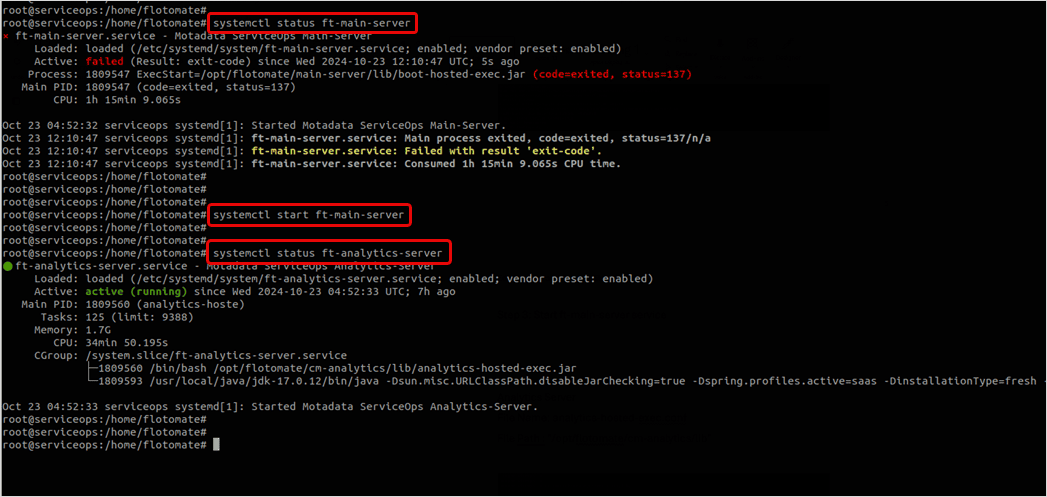
Configuring Analytics Server Memory
The analytics server handles reporting and analytics functions.
Login
Login to the terminal server using the root user.
Stop Analytics Server Service:
systemctl stop ft-analytics-server
systemctl status ft-analytics-server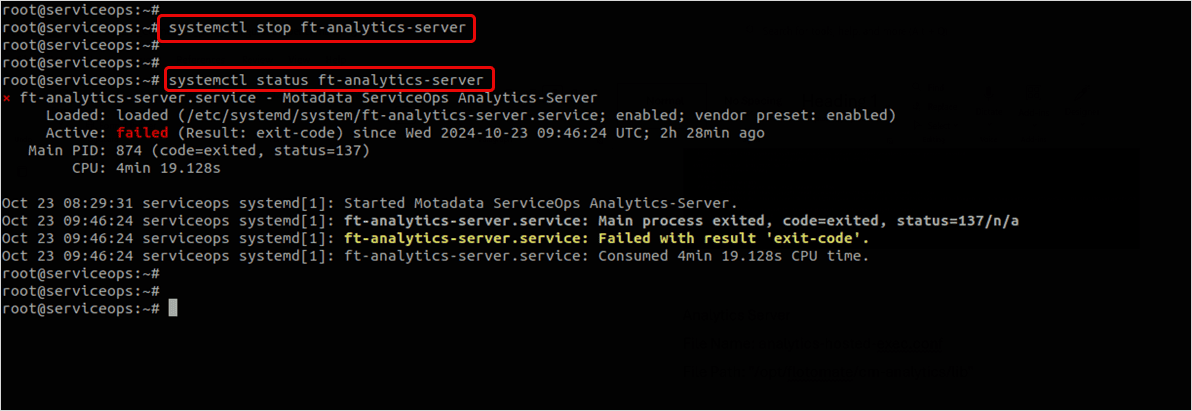
Edit Configuration File:
cd /opt/flotomate/cm-analytics/lib/
vim analytics-hosted-exec.conf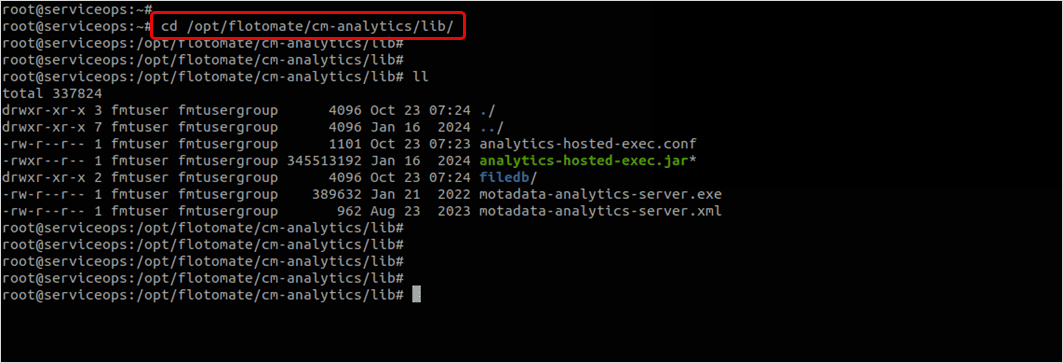
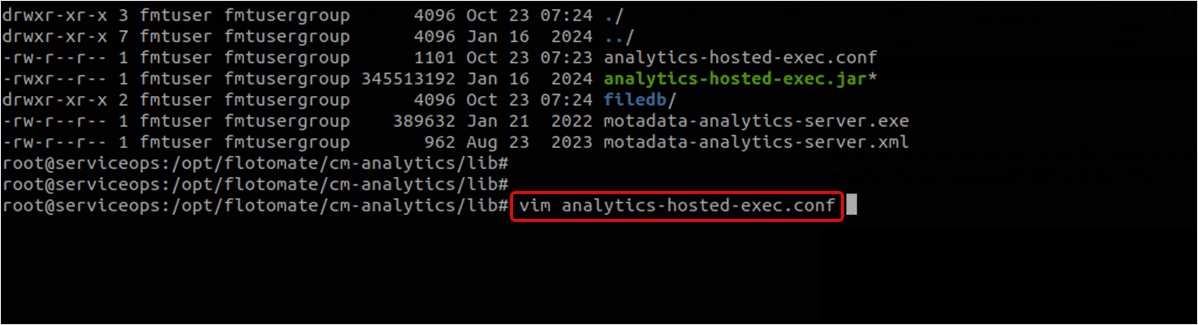
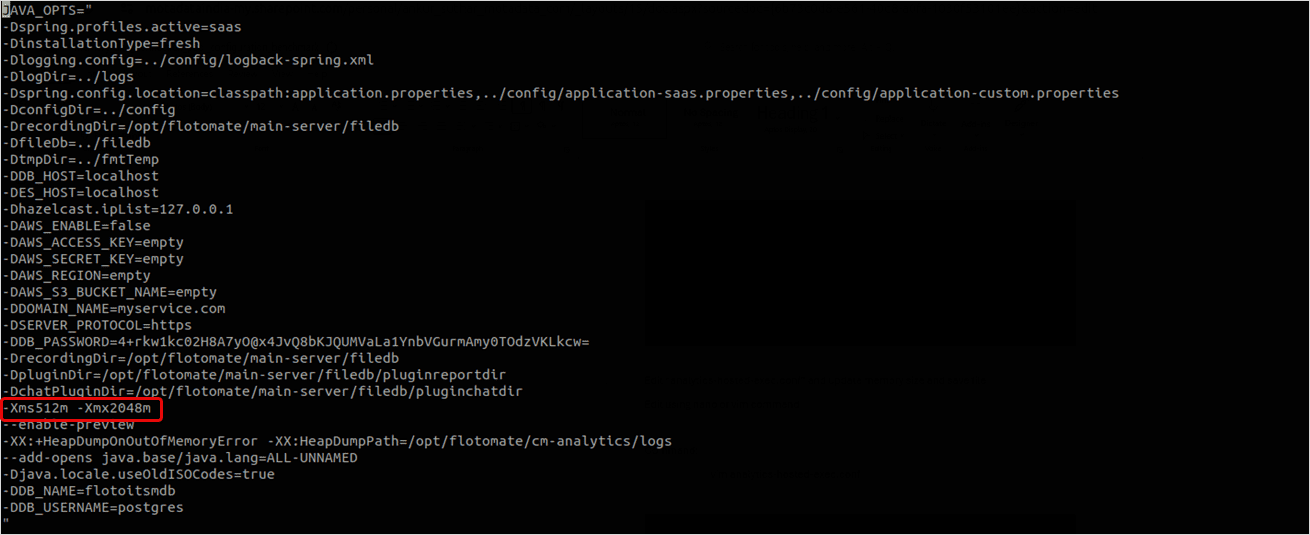
Update Memory Settings:
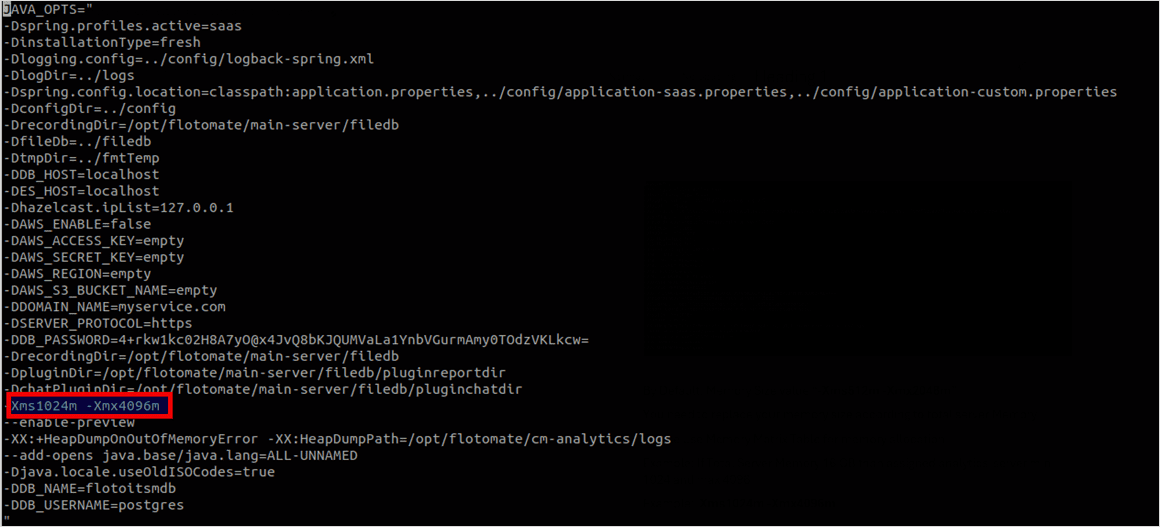
The default memory value which is -Xms512m -Xms2048m. Replace it with a new value based on the total server memory. To allocate memory, use the above memory matrix table. For example, If the Total Server Memory is 16 GB, you can assign the analytics-server with min 1024 and max 4096 memory.
Example: -Xms1024m -Xms4096m
Save and Restart Service:
Check the analytics server service status, start its service, and again verify its status using the below commands:
systemctl status ft-analytics-server
systemctl start ft-analytics-server
systemctl status ft-analytics-server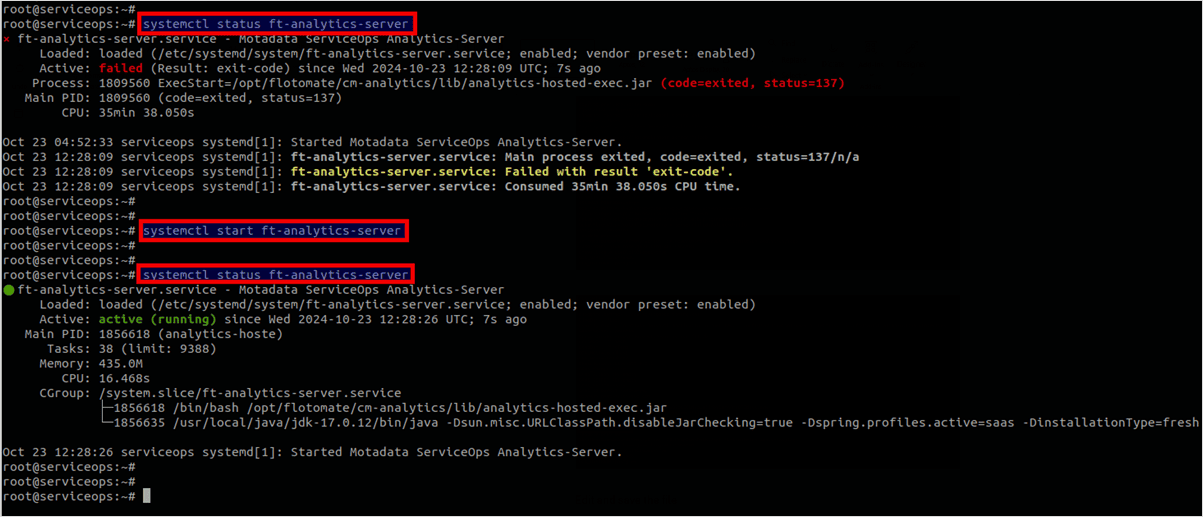
Configuring Plugin Server Memory
The plugin server handles third-party integrations and plugins.
Login
Login to the terminal server using the root user.
Stop Plugin Server Service:
systemctl stop ft-plugins-server
systemctl status ft-plugins-server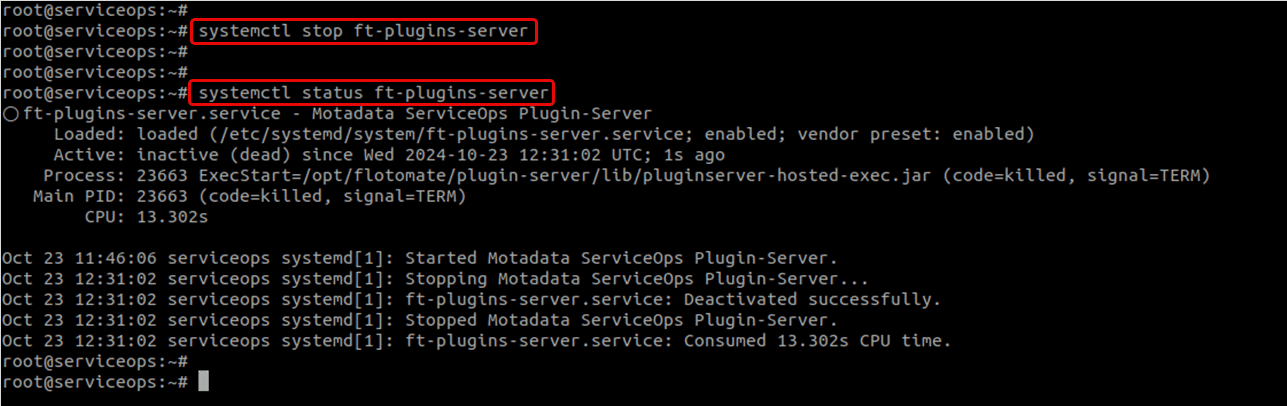
Edit Configuration File:
cd /opt/flotomate/plugin-server/lib/
vim pluginserver-hosted-exec.conf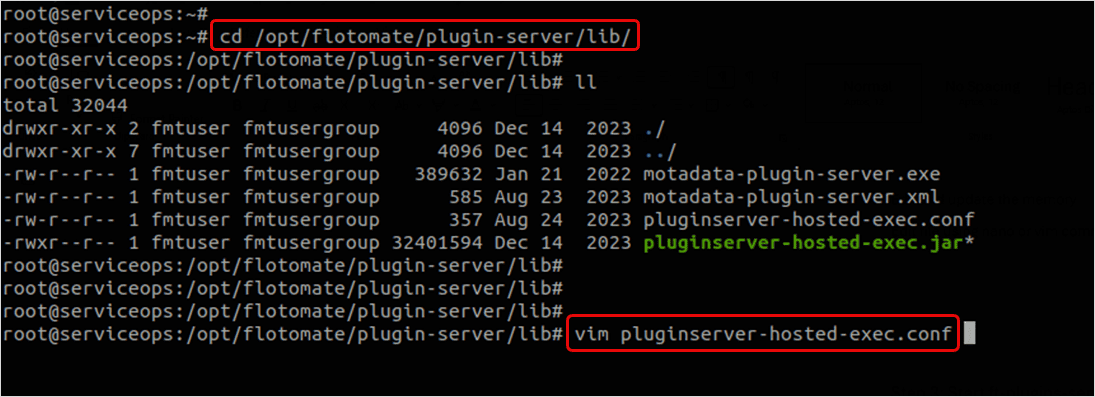
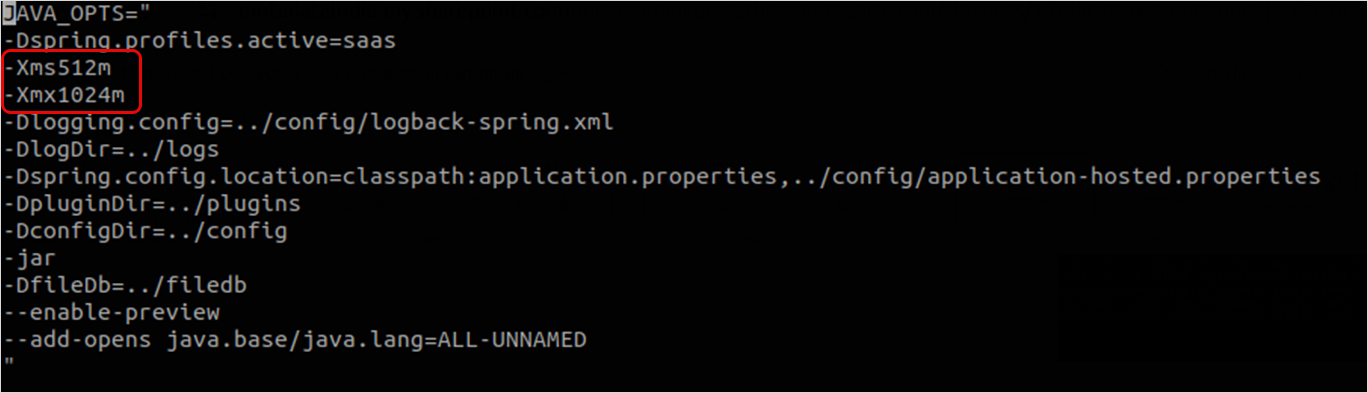
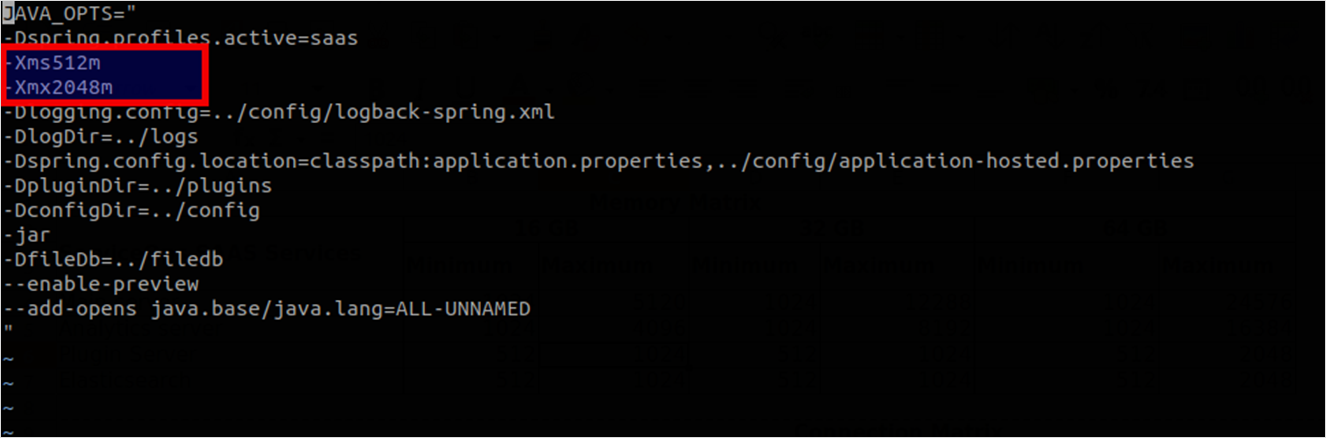
Update Memory Settings: The default memory value which is -Xms512m -Xms1024m. Replace it with a new value based on the total server memory. To allocate memory, use the above memory matrix table. For example, if the Total Server Memory is 64 GB, you can assign the plugin-server with min 512 and max 2048 memory.
Example: -Xms512m -Xms2048m
Save and Restart Service:
Check the plugins-server service status, start its service, and again verify its status using the below commands:
systemctl status ft-plugins-server
systemctl start ft-plugins-server
systemctl status ft-plugins-server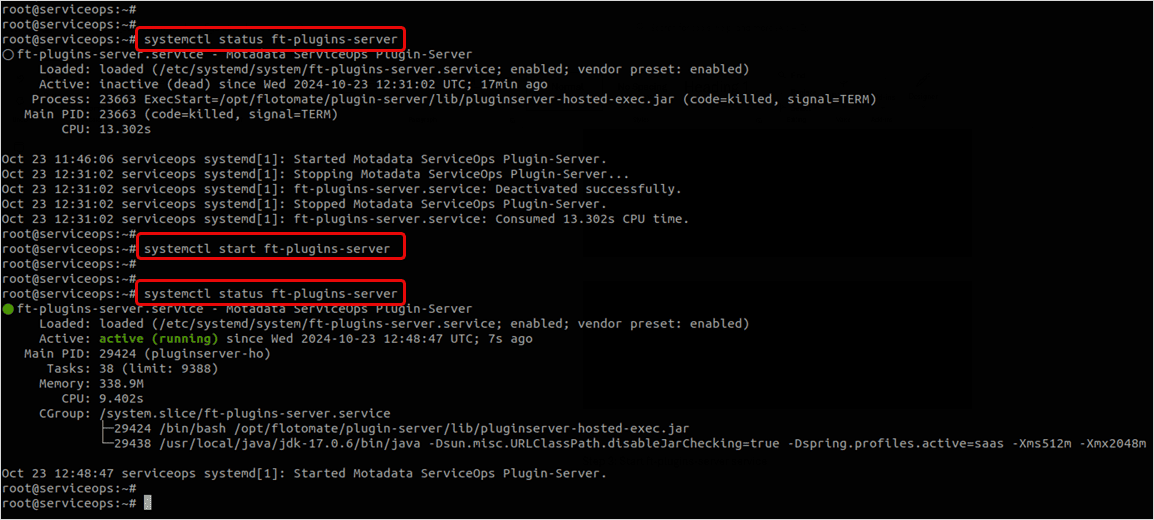
Configuring Elastic Search Memory
Elasticsearch requires careful memory configuration as it uses JVM heap for both data storage and search operations.
Stop Elastic Search Service:
systemctl stop elasticsearch
systemctl status elasticsearch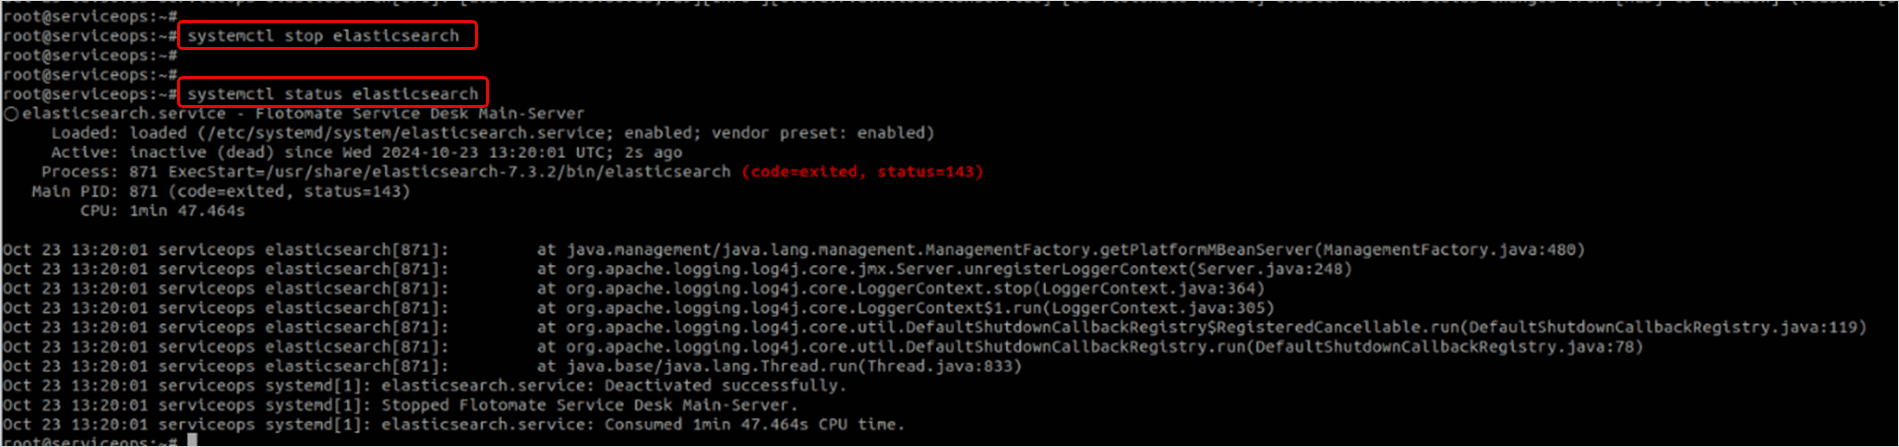
Edit Configuration File:
cd /usr/share/elasticsearch-7.3.2/config
vim jvm.options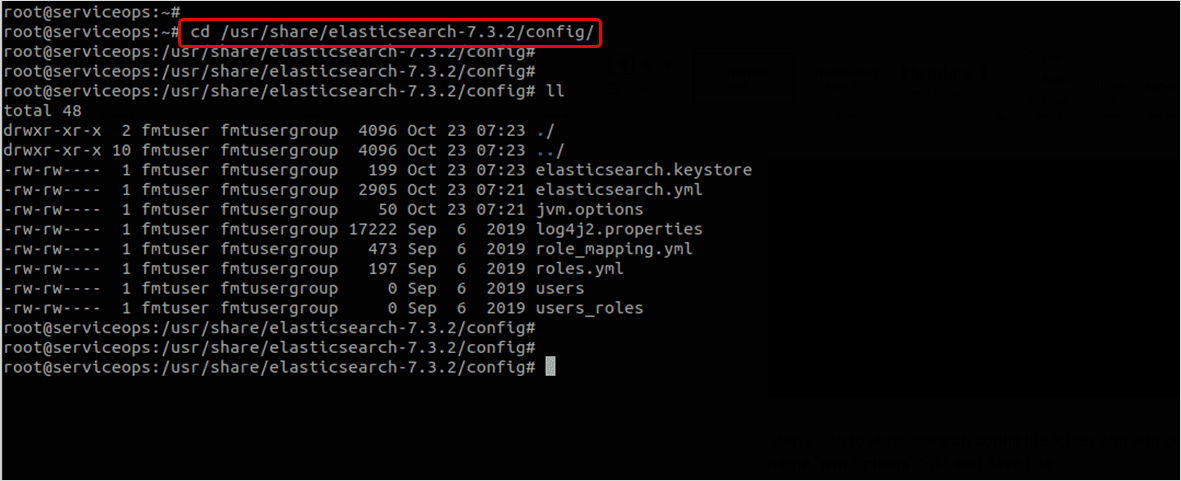
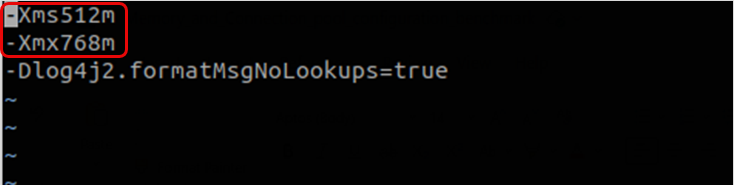
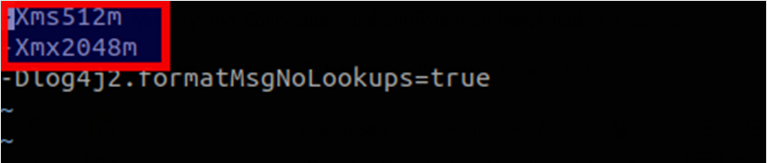
Update Memory Settings:
The default memory value which is -Xms512m -Xms768m. Replace it with a new value based on the total server memory. To allocate memory, use the above memory matrix table. For example, if the total server memory is 64 GB, you can assign the elasticsearch with min 1024 and max 4096 memory.
Example: -Xms512m -Xms2048m
Save and Restart Service:
Check the elastic search service status, start its service, and again verify its status using the below commands:
systemctl status elasticsearch
systemctl start elasticsearch
systemctl status elasticsearch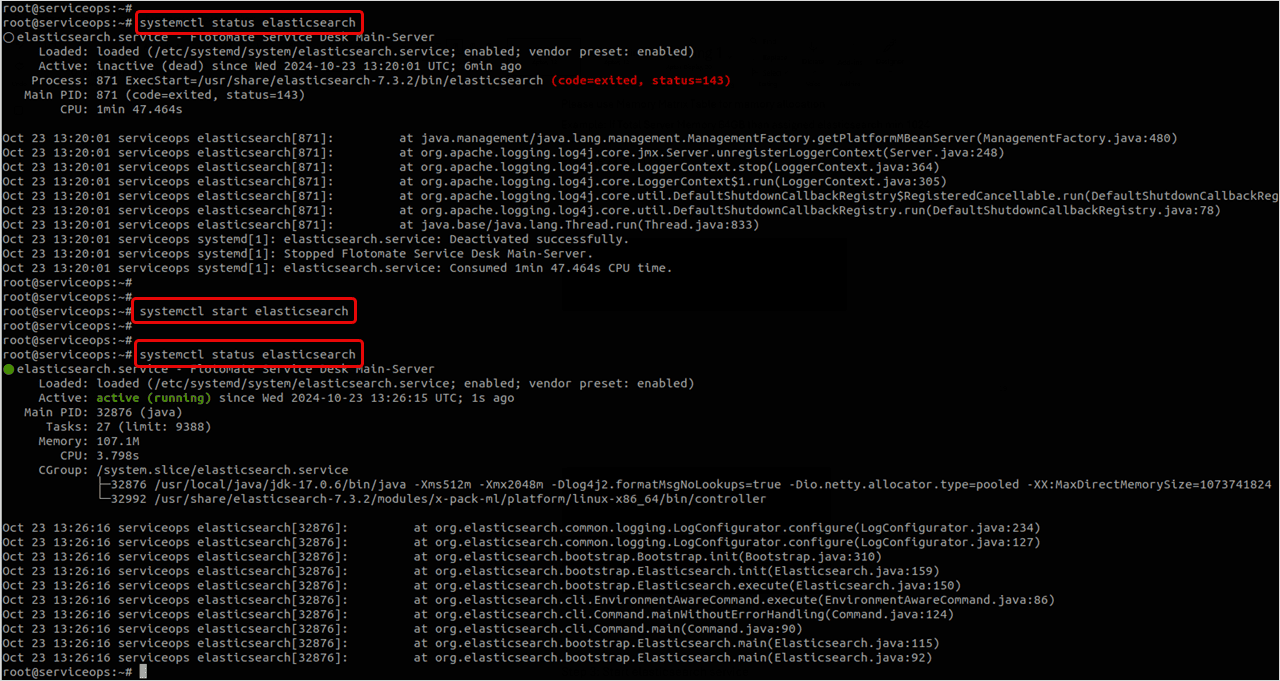
- Never allocate more than 50% of total system memory to Elasticsearch
- Elasticsearch heap should not exceed 32GB (even on larger servers)
- Ensure sufficient memory for file system cache
- Monitor heap usage to prevent out-of-memory errors
Connection Pool Configuration
Connection pooling manages database connections efficiently, reducing connection overhead and improving application performance.
Terms:
- Maximum Pool Size: The maximum number of connections that can be opened simultaneously. It must be configured based on the expected peak load and database capacity.
- Minimum Pool Size: The minimum number of connections to keep open in the pool to reduce latency during peak times.
Connection Pool Matrix
The following matrix provides recommended connection pool settings based on technician count and IT asset count:
| Connection Matix | ||||||||||
|---|---|---|---|---|---|---|---|---|---|---|
| ServiceOps Database Connection | Technicians | IT Assets | ||||||||
| 20 | 50 | 100 | 150 | 200 | 2000 | 5000 | 10000 | 15000 | 20000 | |
| Main Service - Min | 10 | 20 | 20 | 20 | 20 | 10 | 20 | 20 | 20 | 20 |
| Main Service - Max | 50 | 100 | 150 | 200 | 250 | 50 | 100 | 150 | 200 | 300 |
| Analytics Service - Min | 5 | 10 | 20 | 20 | 20 | 5 | 10 | 20 | 20 | 20 |
| Analytics Service - Max | 40 | 50 | 100 | 150 | 200 | 40 | 50 | 100 | 100 | 150 |
- For a fresh installation, the application-custom.properties file will be blank. You need to update it manually.
- Verify the file after ServiceOps upgrade.
- Please take a backup of the configuration before making any changes.
- Base settings on expected peak concurrent users
- Consider database server capacity when setting maximum connections
- Monitor connection pool usage to optimize settings
- Balance between performance and resource utilization
Configuring Main Server Connection Pool
Please back up the config files before making any changes.
Navigate to Configuration Directory:
cd /opt/flotomate/main-server/config/
vim application-custom.properties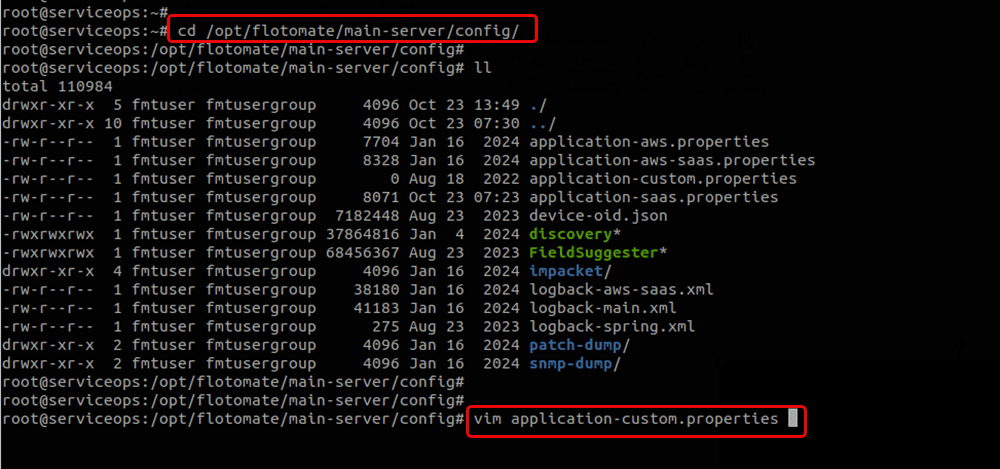

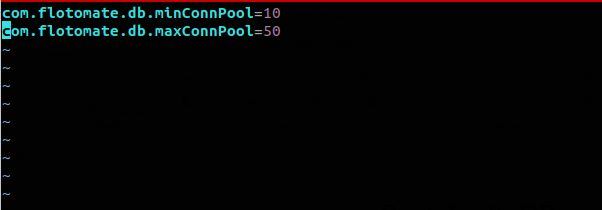
Update Connection Pool Settings:
Update the DB connection values based on the technician count and using the database connection matrix table.
# Default values
com.flotomate.db.minConnPool=20
com.flotomate.db.maxConnPool=30

# Example for 20 technicians
com.flotomate.db.minConnPool=10
com.flotomate.db.maxConnPool=50

# Example for 100 technicians
com.flotomate.db.minConnPool=20
com.flotomate.db.maxConnPool=150
Update the required custom changes and once done, save the file.
- Restart Main Server Service:
systemctl stop ft-main-server
systemctl start ft-main-server
Configuring Analytics Server Connection Pool
Please back up the config files before making any changes.
Navigate to Configuration Directory:
cd /opt/flotomate/cm-analytics/config/
vim application-custom.properties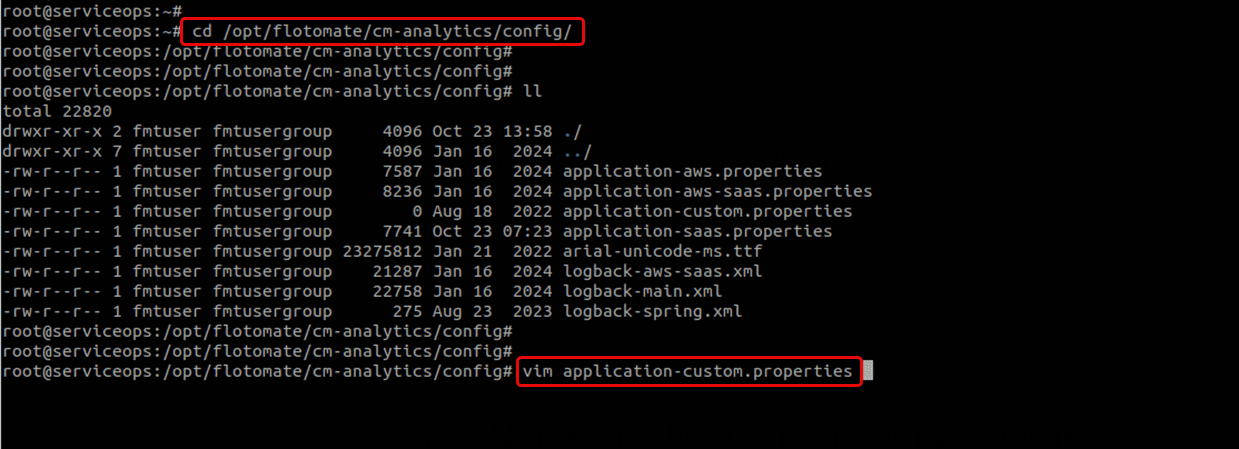

Update Connection Pool Settings:
Update the DB connection values based on the technician count and using the database connection matrix table.
# Default values
com.flotomate.db.minConnPool=10
com.flotomate.db.maxConnPool=25

# Example for 20 technicians
com.flotomate.db.minConnPool=5
com.flotomate.db.maxConnPool=40

# Example for 100 technicians
com.flotomate.db.minConnPool=20
com.flotomate.db.maxConnPool=100
Update the required custom changes and once done, save the file.
- Restart Analytics Server Service:
systemctl stop ft-analytics-server
systemctl start ft-analytics-server
Performance Monitoring and Optimization
Memory Monitoring
Monitor memory usage after configuration:
# Check JVM memory usage
jstat -gc <process_id>

# Monitor system memory
free -h

# Check service memory usage
ps aux | grep java
Connection Pool Monitoring
Monitor database connection usage:
# Check PostgreSQL connections
psql -U postgres -c "SELECT count(*) FROM pg_stat_activity;"

# Monitor connection pool metrics
# Check application logs for connection pool statistics
tail -f /opt/flotomate/main-server/logs/application.log
Performance Tuning Recommendations
Memory Optimization:
- Monitor garbage collection frequency
- Adjust heap sizes based on usage patterns
- Consider G1GC garbage collector for large heaps
Connection Pool Optimization:
- Monitor connection wait times
- Adjust pool sizes based on peak usage
- Consider connection timeout settings
System-Level Optimization:
- Ensure adequate swap space
- Monitor disk I/O performance
- Optimize network settings
Troubleshooting
- Common Issues
- Diagnostic Commands
Out of Memory Errors
- Problem: Java heap space errors or system memory exhaustion
- Solution:
- Increase heap size within recommended limits
- Monitor memory usage patterns
- Consider reducing concurrent load
- Check for memory leaks in applications
Connection Pool Exhaustion
- Problem: Database connection timeouts or pool exhaustion
- Solution:
- Increase maximum connection pool size
- Check for connection leaks
- Monitor database server capacity
- Optimize query performance
Service Startup Failures
- Problem: Services fail to start after configuration changes
- Solution:
- Verify configuration file syntax
- Check memory allocation values
- Ensure sufficient system resources
- Review service logs for specific errors
# Check service status
systemctl status ft-main-server
systemctl status ft-analytics-server
systemctl status ft-plugins-server
systemctl status elasticsearch

# Check memory usage
free -h
top -p $(pgrep java)

# Check configuration files
cat /opt/flotomate/main-server/lib/boot-hosted-exec.conf | grep -E "Xms|Xmx"
cat /opt/flotomate/main-server/config/application-custom.properties | grep ConnPool

# Check application logs
tail -f /opt/flotomate/main-server/logs/application.log
tail -f /opt/flotomate/cm-analytics/logs/application.log

# Monitor database connections
psql -U postgres -c "SELECT count(*) FROM pg_stat_activity WHERE state = 'active';"
Best Practices
- Configuration
- Monitoring & Maintenance
Memory Allocation
- Start with conservative settings and adjust based on monitoring.
- Never allocate more than 75% of total system memory.
- Keep minimum and maximum heap sizes close for stability.
- Monitor garbage collection patterns.
Connection Pool Management
- Base settings on actual usage patterns, not theoretical maximums.
- Monitor connection wait times and adjust accordingly.
- Consider database server capacity when setting maximum connections.
- Implement connection timeout settings.
Change Management
- Always backup configuration files before changes.
- Test changes in a non-production environment first.
- Make incremental changes and monitor the impact.
- Document all configuration changes.
Regular Monitoring
- Monitor memory usage patterns.
- Track connection pool utilization.
- Monitor application performance metrics.
- Review system resource usage.
Performance Optimization
- Adjust settings based on usage patterns.
- Consider workload changes and seasonal variations.
- Optimize based on performance metrics.
- Plan for capacity growth.
Documentation
- Maintain configuration documentation.
- Record performance baselines.
- Document troubleshooting procedures.
- Keep a change history.
Related Topics
- System Requirements
- ServiceOps Server Installation Overview
- High Availability Configuration
- Backup and Restore Procedures
Next Steps
After configuring memory and connection pools:
- Monitor Performance: Establish baseline metrics and monitor regularly
- Optimize Settings: Adjust configurations based on actual usage patterns
- Plan for Growth: Consider future capacity requirements
- Document Configuration: Maintain detailed configuration documentation
- Regular Reviews: Schedule periodic performance reviews and optimizations
Your memory and connection pool configuration is successful when:
- All services start without memory errors
- Application response times are acceptable
- Database connections are stable
- System resources are utilized efficiently
- Performance metrics meet business requirements
- No out-of-memory errors occur during peak usage