Analytics
Analytics provides administrators with comprehensive visibility into AI usage and credit consumption within ServiceOps, enabling effective monitoring and management of AI resources.
The Analytics dashboard offers a clear picture of how AI is being utilized across your organization. It allows you to monitor key metrics related to AI credit consumption, agent activity, and team engagement. You can select a specific time range to analyze usage patterns and trends, helping you make informed decisions about resource allocation and policy adjustments.
Key Features:
- Time Filter: Select a predefined time range or a custom period to analyze AI usage metrics. Options include:
- Today
- Last 7 Days
- Last 15 Days
- Last 30 Days
- This Week
- Last Week
- This Month
- Last Month
- Custom
- Auto Refresh Interval: Configure the dashboard to automatically refresh at specified intervals, ensuring you always have the latest data. Options include:
- None
- 5 Minutes
- 10 Minutes
- 15 Minutes
- 20 Minutes
- 30 Minutes
- Comprehensive Metrics: Gain insights into credit usage, active agents, and team performance.
- Usage Trends: Understand how AI is adopted and utilized over time to identify anomalies or opportunities for optimization.
Usage Metrics
The Analytics dashboard presents several key metrics to help you understand AI consumption and activity. These metrics provide a high-level summary of AI performance within your ServiceOps environment.
Viewing Usage Metrics
To view the Analytics dashboard, navigate to Admin > AI > Governance, then select Analytics from the left-hand menu.
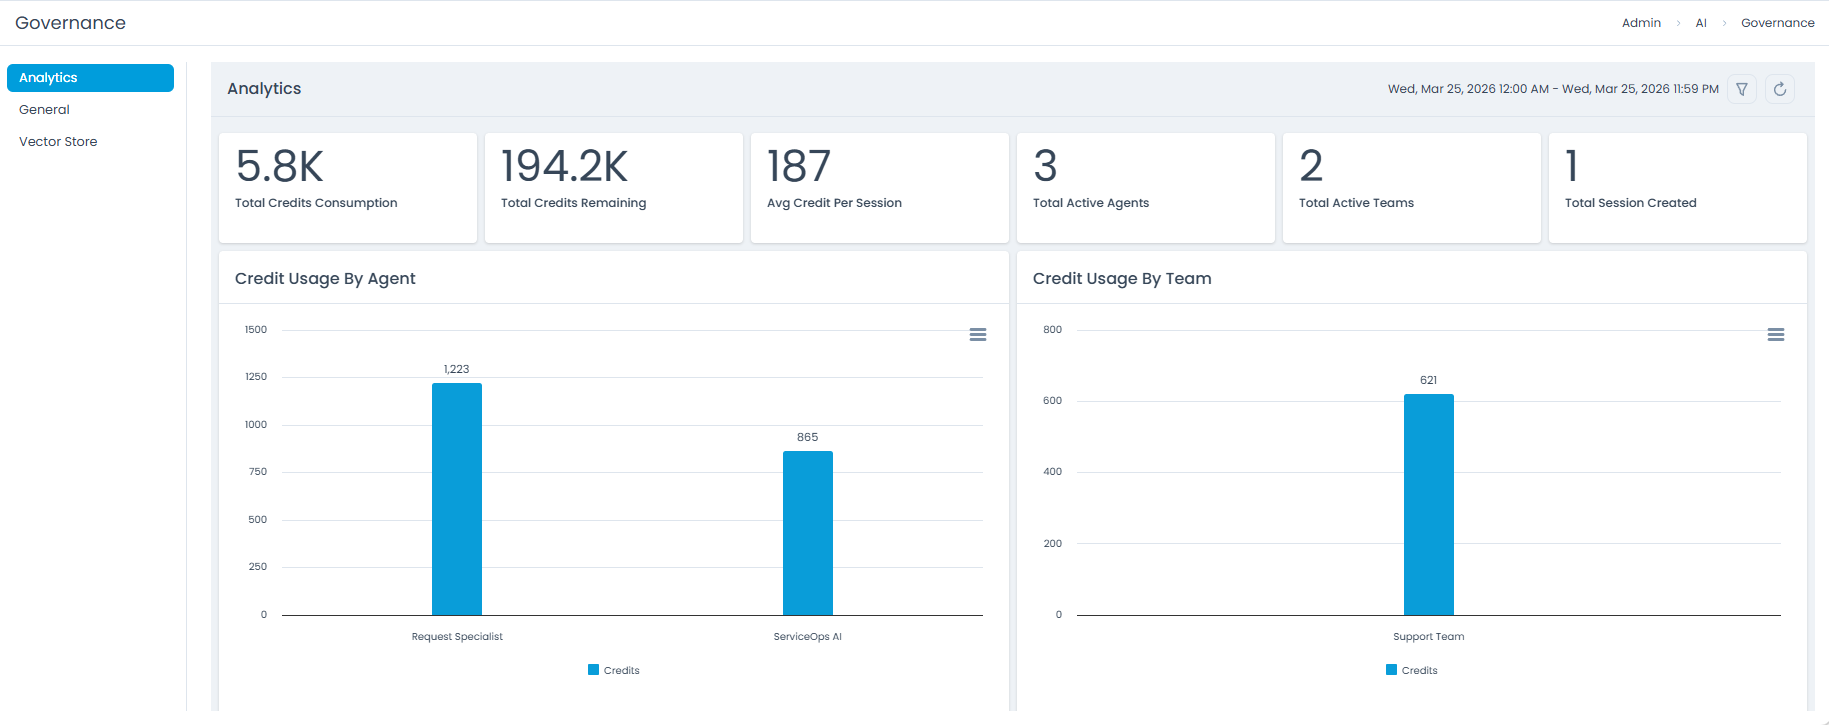
- Total Credits Consumption: Displays the total amount of AI credits consumed across all AI agents and teams within the selected time range.
- Example: As shown in the image, "4.7K" indicates 4700 credits consumed.
- Total Credits Remaining: Shows the number of AI credits still available.
- Example: "0" in the image indicates no credits remaining.
- Average Credit per Session: Calculates the average credits used for each AI session created.
- Example: "11" suggests an average of 11 credits per session.
- Total Active Agents: Indicates the number of unique AI agents that have been active during the selected period.
- Example: "4" active agents.
- Total Active Teams: Shows the number of AI teams that have utilized AI features.
- Example: "2" active teams.
- Total Sessions Created: Represents the total count of AI interaction sessions initiated.
- Example: "1" session created.
Credit Usage Insights
Beyond the summary metrics, the Analytics dashboard provides granular insights into credit usage, allowing you to pinpoint consumption patterns by individual agents and teams. This helps in identifying high-usage areas, optimizing resource allocation, and ensuring fair distribution of AI capabilities.
Credit Usage by Agent
This section displays a breakdown of credit consumption by each AI agent. This allows administrators to see which agents are most active and consuming the most credits, facilitating performance monitoring and resource management.

Also, each credit usage widget features a context menu (represented by an icon with three horizontal lines) that provides the following options for data interaction and export:
- View in full screen: Expands the widget to occupy the entire screen for a detailed view.
- Download PNG image: Downloads the widget's content as a PNG image file.
- Download JPEG image: Downloads the widget's content as a JPEG image file.
- Download PDF document: Downloads the widget's content as a PDF document.
- Download CSV: Downloads the underlying data of the widget in CSV format.
- Download XLS: Downloads the underlying data of the widget in XLS (Excel) format.
Credit Usage by Team
This section illustrates credit consumption at the team level, providing an overview of how different teams are utilizing AI. This insight helps in understanding team-specific AI adoption and identifying potential training or optimization needs.

Also, each credit usage widget features a context menu (represented by an icon with three horizontal lines) that provides the following options for data interaction and export:
- View in full screen: Expands the widget to occupy the entire screen for a detailed view.
- Download PNG image: Downloads the widget's content as a PNG image file.
- Download JPEG image: Downloads the widget's content as a JPEG image file.
- Download PDF document: Downloads the widget's content as a PDF document.
- Download CSV: Downloads the underlying data of the widget in CSV format.
- Download XLS: Downloads the underlying data of the widget in XLS (Excel) format.
Interpreting Usage Trends
By analyzing the trends in credit consumption across agents and teams, you can:
- Identify Power Users: Recognize agents or teams that frequently leverage AI, potentially indicating areas of high efficiency or specific needs.
- Optimize Allocation: Use data to adjust credit allocations or modify AI access policies for better resource management.