Webhook Endpoints
The Webhook Endpoints feature in Motadata ServiceOps allows administrators to configure endpoints that external systems can use to send data or trigger actions within ServiceOps. This capability supports automation use cases by enabling real-time interaction between ServiceOps and third-party systems.
This feature is available for both On-Premises and SaaS deployment models and is included under all licensing tiers.
Prerequisites
- Plugin Server must be installed. For more details, refer to the Plugin Server Installation Guide.
- Plugin must be pre-registered from the Plugin tab.
Accessing Webhook Endpoints
To access the Webhook Endpoints configuration:
- Navigate to Admin > Automations > Integrations.
- Click on the Webhook Endpoints tab and the following page appears.
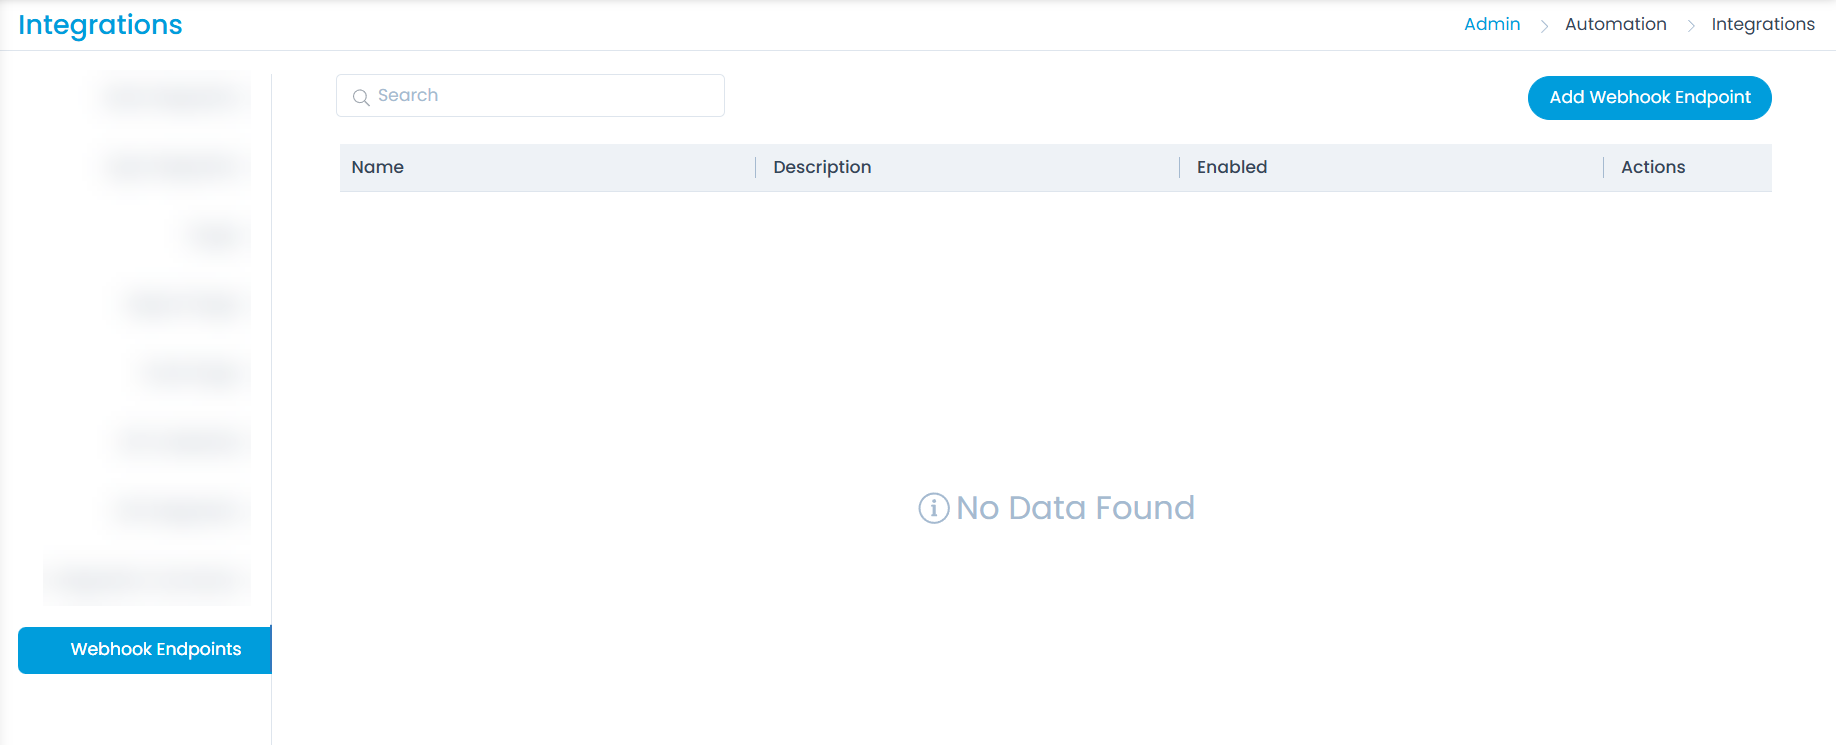
Webhook Endpoints List View
The list page displays all the configured webhook endpoints with the following details:
- Name: The identifier for the webhook.
- Description: A brief explanation of the webhook purpose.
- Enabled: Indicates if the webhook is currently active.
- Actions: Edit or delete the webhook configuration.
Use the Add Webhook Endpoint button in the top-right corner to create a new endpoint.
Adding a Webhook Endpoint
- Click the Add Webhook Endpoint and the following popup appears.

- Enter the required fields:
- Name (Mandatory): Enter a unique name for the webhook.
- Webhook Endpoint: Enter the client end point name.
- Description (Optional): Add a brief description for reference.
- Webhook Auth Type: Select the type of authentication method for authenticating incoming webhook requests. The options are:
- Auth Header: Generates a read-only Endpoint URL and Authorization Key. Both the values can be copied for use in external systems.
- Auth Query Param: Generates a read-only query parameter for authentication. Copy and apply this when setting up the webhook in external tools.
- Action on Webhook Trigger: Configure what action should be performed when a valid event is received. Currently supports Execute Plugin.
- Plugin: Select the required plugin from the list of registered plugins. These can be registered from the Plugin tab.
Once done, click Add, and the endpoint will be configured.
Now, when a webhook is triggered and successfully authenticated, the selected plugin will be executed automatically.
Audit Logging
Any creation, update, or deletion of a webhook endpoint is recorded in the Configuration Audit, ensuring traceability and compliance.
- This feature is applicable only to Server-side operations.
- Plugins must be pre-registered to be available for selection in the action configuration.
By enabling Webhook Endpoints, ServiceOps extends its automation and integration capabilities, allowing seamless communication with external systems through secure, configurable, and auditable endpoints.
Sample Use Case:
Integrating ServiceOps with a Third-Party Monitoring Tool Using Webhook Endpoints
Scenario:
An organization uses a third-party infrastructure monitoring tool (e.g., NMS) that detects system anomalies such as CPU spikes, memory leaks, or service downtime. The IT operations team requires these alerts to trigger specific automated workflows within Motadata ServiceOps—such as creating incidents or running remediation scripts—without manual intervention.
Objective:
Configure a Webhook Endpoint in ServiceOps to allow the monitoring tool to notify ServiceOps of specific events, which in turn should execute a pre-defined plugin for automated remediation or incident registration.
Configuration Steps
Webhook Setup in ServiceOps:
Navigate to Admin > Automations > Integrations > Webhook Endpoints.
Click Add Webhook Endpoint.
Configure the following:
Name:
Infra Monitoring Alert TriggerWebhook Endpoint: request-plugin
Description: Triggers a plugin upon receiving alerts from external monitoring systems.
Webhook Auth Type:
- Select Auth Header.
- Copy the generated Endpoint URL and Auth Header values.
Action on Webhook Trigger:
- Select Execute Plugin.
- Choose the plugin
Auto-Create Incident From Alert.
Plugin Configuration:
- Ensure the plugin
Auto-Create Incident From Alertis registered within the ServiceOps plugin registry. For more details, refer to the Plugin page. - The plugin should parse incoming JSON payloads (e.g., host, metric type, severity) and map them to incident attributes.
- Ensure the plugin
External System Configuration:
In the monitoring tool, configure an HTTP POST webhook notification.
Use the copied Endpoint URL and add the Auth Header in the request headers.
Structure the payload in JSON format:
{
  "host": "webserver-02",
  "metric": "CPU_Usage",
  "value": "95%",
  "severity": "Critical",
  "timestamp": "2025-05-15T10:45:00Z"
}
Result
Whenever the monitoring tool detects an anomaly exceeding predefined thresholds, it sends a webhook request to the ServiceOps endpoint. Upon successful authentication, the selected plugin is executed, resulting in the automatic creation of an incident ticket categorized by severity and linked to the affected asset. This integration facilitates immediate action without human oversight, reducing response times and enhancing operational efficiency.
This use case illustrates how Webhook Endpoints in ServiceOps can streamline integrations with external platforms, enabling intelligent automation and seamless cross-system communication within IT service management ecosystems.