NOC View in ObserveOps
NOC View is a dedicated display mode in ObserveOps (formerly known as AIOps) designed for large-screen, continuous monitoring environments such as Network Operations Centers. Instead of navigating between dashboards manually, NOC View aggregates multiple dashboards into a single auto-rotating sequence that plays unattended on a wall display or shared screen.
NOC View is a separate entity from dashboards. It does not modify any dashboard — it references existing dashboards and cycles through them at a configured interval.
Accessing NOC View
Go to Main Menu and select Dashboard. The dashboard screen displays two tabs at the top: Dashboard and NOC View.
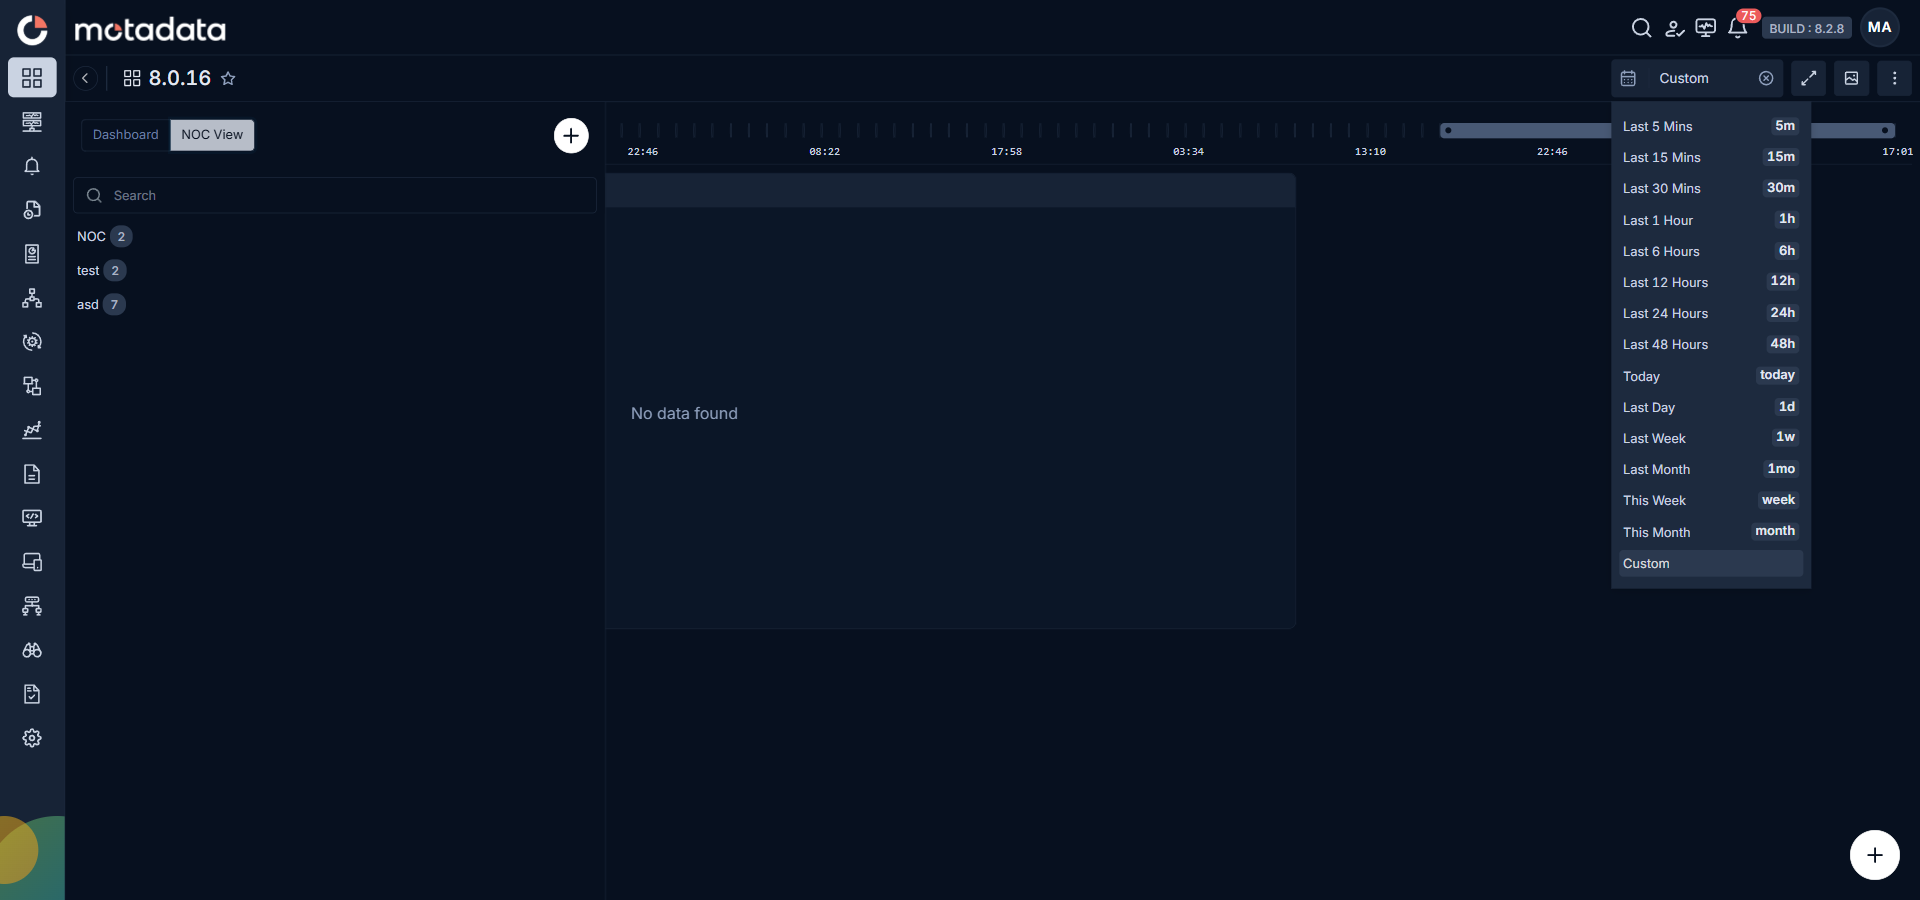
Select the NOC View tab to switch to the NOC View listing screen. All existing NOC Views are displayed here.
Creating a NOC View
From the NOC View tab, click the + icon to open the Create NOC panel.
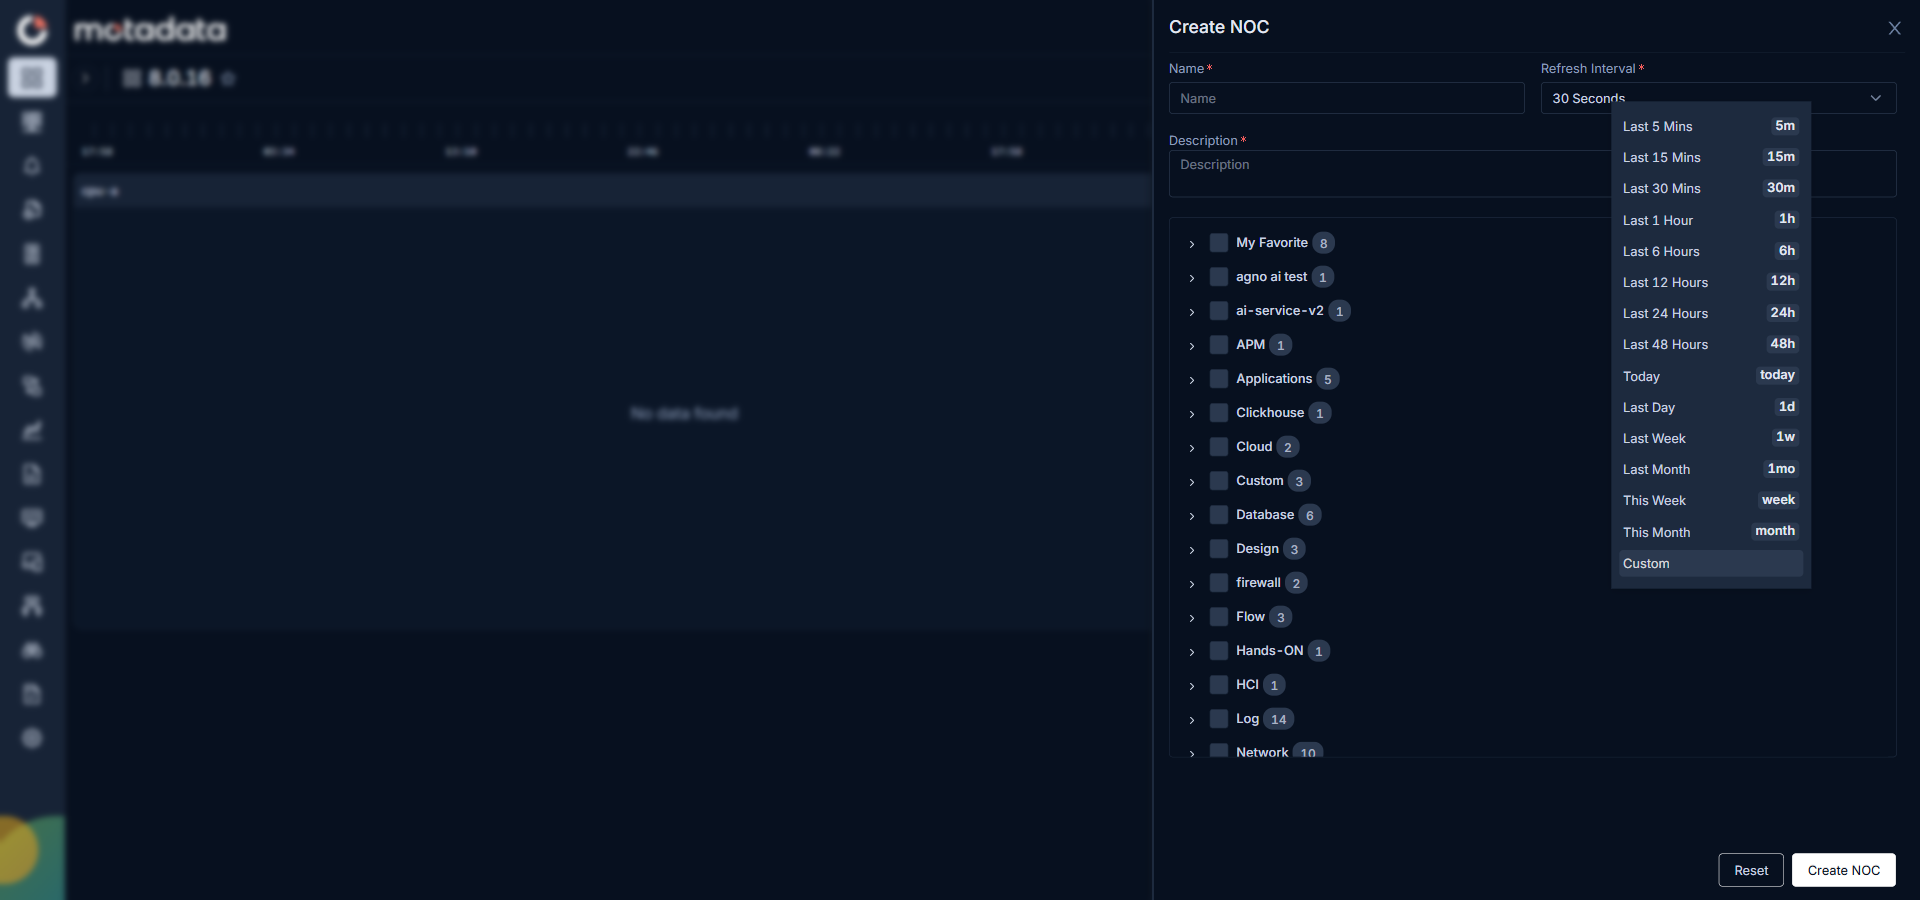
Fill in the following fields:
| Field | Required | Description |
|---|---|---|
| Name | Yes | Enter a unique name for the NOC View. |
| Refresh Interval | Yes | Select how long each dashboard is displayed before rotating to the next. Default is 30 Seconds. |
| Description | Yes | Enter a description for the NOC View. |
| Dashboards | Yes | Select one or more dashboards from the grouped list. Dashboards are grouped by category, with a count shown per category. Expand a category to select individual dashboards. |
Click Create NOC to save the NOC View, or Reset to clear all entered values.
Only dashboards that you have visibility access to appear in the dashboard picker. See Dashboard Visibility below for details.
Dashboard Visibility in NOC View
The dashboards available for selection when creating a NOC View — and the dashboards visible during playback — follow these rules:
| Dashboard Type | Visible in NOC View |
|---|---|
| Out-of-the-box (OOB) dashboards | Visible to all users. |
| Custom dashboards set to Public | Visible to all users. |
| Custom dashboards set to Private | Visible only if the NOC View creator and the dashboard creator are the same user. |
Playing a NOC View
From the NOC View listing, click a NOC View to open and start playback. ObserveOps displays the dashboards in the order they were selected, rotating automatically at the configured refresh interval.
Dashboard Tab Strip
A horizontal dashboard tab strip is shown at the top of the NOC View during playback. Every dashboard included in the rotation appears as a tab in the order it was selected, so operators can see the full sequence at a glance.
| Indicator | What It Shows |
|---|---|
| Active tab | The tab of the dashboard currently being displayed is highlighted, so it is clear which dashboard is on screen right now. |
| Time remaining | A countdown next to the active tab shows how much time is left before the view moves to the next dashboard, based on the configured refresh interval. |
| Direct jump | Click any tab to jump directly to that dashboard without waiting for the rotation. The countdown restarts from the top of the interval. |
Playback Controls
The following controls are available during playback:
| Control | Description |
|---|---|
| Pause / Resume | Pause auto-rotation to stay on the current dashboard. Resume to continue the sequence. |
| Manual Navigation | Move forward or backward through the dashboard sequence manually while paused. |
| Arrow Keys | Use the Left and Right arrow keys on your keyboard to navigate directly to the previous or next dashboard in the sequence at any time. |
| Pin (Push) | Lock a specific dashboard in place so it does not rotate out automatically. Useful when an active incident requires prolonged visibility. Unpin to resume rotation. |
| Full-Screen | Expand the NOC View to fill the entire screen. Press Esc to exit full-screen mode. |
Metric Insight
Metric Insight is available during NOC View playback. While a dashboard is being displayed in the rotation, line chart widgets within that dashboard show the Metric Insight icon on the widget header. Clicking it opens an insight panel that analyzes the metric being visualized, using the same time range applied to the dashboard at that point in the playback.
This allows operators monitoring on large screens to drill into statistical context for any metric without interrupting or exiting the NOC playback.
Statistical Insight
The Statistical Insight tab provides a comprehensive set of computed statistics for the metric over the selected time range:
| Statistic | Description |
|---|---|
| Average | The mean value of the metric across the selected time range. |
| Peak | The highest value recorded, along with the timestamp at which it occurred. |
| Minimum | The lowest value recorded, along with the timestamp at which it occurred. |
| P95 | The 95th percentile value — 95% of recorded values fall at or below this point. |
| Standard Deviation | Measures how much the metric values vary around the average. |
| Stability Score | An indicator of how consistently the metric behaves over the selected period. |
| Major Spikes | Lists the top spike events detected — sudden sharp increases that deviate from normal behavior. |
| Trend Overview | A high-level description of whether the metric is trending upward, downward, or remaining stable. |
| Short-Term Dynamics | Captures recent fluctuation behavior to highlight any immediate changes in the metric pattern. |
| Consistency Window | Identifies the period during which the metric remained within a stable range. |
| Anomaly Summary | A summary of detected anomalies within the selected time range. |
Statistical Summary
The Statistical Summary tab translates the computed statistics into a plain-language narrative covering trend direction, level of volatility, and any notable anomalies detected over the selected time range.
KPI Summary
The KPI Summary tab provides a health interpretation of the metric based on configured thresholds or baseline values:
| Status | Meaning |
|---|---|
| Healthy | The metric is performing within expected bounds. |
| Degrading | The metric is showing signs of deterioration and may require attention. |
| Critical | The metric has breached critical thresholds and requires immediate action. |
Managing NOC Views
NOC View Listing
The NOC View tab displays all NOC Views available to you. Each entry shows the NOC View name and the number of dashboards it references.
The tab also includes a Search input above the list. Use it to filter NOC Views by name when you have many configured.
Users who have permission to create dashboards and NOC Views will see the + icon at the top-right of the panel to create a new NOC View. Users without this permission can view and play existing NOC Views but cannot create new ones.
Ownership and Edit Control
Only the creator of a NOC View can edit its configuration. Non-owner users see no edit controls on NOC Views they did not create.
If a non-owner attempts to access the edit screen directly via URL, ObserveOps denies access.
The owner can update or delete the following at any time:
- NOC View name
- Selected dashboards and their order
- Refresh interval
- Description