Global Settings
Global Settings consists of the following:
Alert Notification: Motadata polls the monitor at a regular interval (generally 5 mins). After polling it alerts you about the health of the monitor. You can choose the behavior of alert here. You have 3 options:
- Notify me when monitor’s status turns to clear.
- Notify me only specific number of times if monitor severity does not change.
- Notify me continuously about the status of monitor if not clear.

Alert Notification Sound: Alert sound notification plays the sound whenever the alerts are triggered. The sound is played to the logged-in users. Four different sounds for each type of alert are available for use.
To use the sound notification, enable the Alert Sound Notification. The available sound notifications are: ‘Beep’ ‘Dingdong’ ‘Unreachable’ and ‘Warning’.

Select the sound type from drop-down in each alert type and click update.
Alert Correlation Engine:
- Alert Correlation Engine: It enables to correlate the devices within a topology in the form of parent-child. If you do not wish to use the feature, disable it. Here, the flag will be ‘Disabled’ by default. Also, audit logs will be logged in for all entries.
- Availability Report with correlation: Enable to generate the availability report containing the devices associated with correlations. If enabled it will display the details like Up Time, Down Time, Disabled Time, and Effective Up Time.

Horizontal CSV Export: Horizontal CSV Export will enable the visualization of report in Horizontal direction when exported. If you do not wish to use the feature, disable it.

SLA Contract Penalty Export: Enable to view the SLA Contract penalty details in the SLA report when exported. By default, it is enabled.

Log Search:
- Full Text Search: Turn on/off full text search. It is a prerequisite of the Log search (Search > Logs) menu.
- View Parsed Logs: Turn on/off the ‘view parsed logs’. When turned on, the logs will show logs from both Clickhouse and Lucene database. When turned off, the logs will show only from Lucene database.

Topology
- Manually link/unlink functionality: (By default - Off) When turned on, people can manually link/unlink the nodes in the Topology menu. The Link Node option will be available in the Infrastructure View.
- WAN Infrastructure View: (By default - Off) When turned on, you can view the WAN topology in the infrastructure view as well as configure it. Once enabled, you can add a cloud in the network and connect the nodes to it. Also, the Link Cloud option will be available.

Scheduler Calendar View: (By default - Off) When turned on, users can view the Scheduler in Calendar format.
Widget: When you turn on this setting, Motadata will store and use values from cookies to show widget data. The cookies are maintained for 10 minutes for metric widgets. For log/flow widgets, cookies are maintained for 2 minutes. When you want Motadata to make fresh call to database every time you visit the dashboard/reports page, turn off the feature.

Visualization: Set the maximum number of widgets in a single dashboard. Maximum visualization limit in Motadata is 25.
Currency: Set the currency in which you want to see all the price/amount/values in Motadata. Note that this currency is only for representation only and we do not do currency conversion. You can choose from available currency. If your currency is not visible here, contact Motadata support.

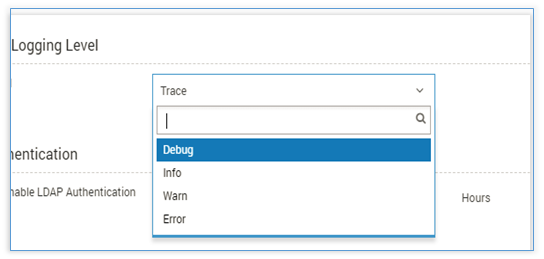
Motadata Logging Level: Choose the logging level for the logs generated in the back-end. By default, warning logs are sufficient for troubleshooting. Other logs are enabled when the network engineer or Motadata expert needs to look into a particular issue.
- Info – Contains informational logs
- Warn – Contains warning logs
- Error – Contains all the error logs
- Debug – Operations (Success/Failure)
- Trace – Detailed logs

LDAP Authentication: To use the LDAP server, enable the LDAP Authentication. Motadata will fetch data from LDAP at regular intervals. Use LDAP Sync Time as the duration of the interval.

Local Engine ID: Every server will have its static local Engine ID, which will be helpful while forwarding the traps.
Login Details: This fields allows to configure the Maximum Login Attempts and Lock duration period after multiple trials of wrong password.

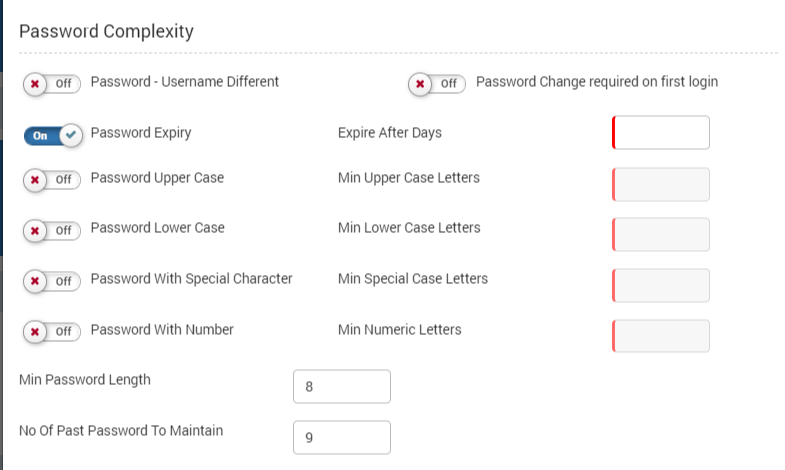
Password Complexity: This section includes various settings for managing password policies.

Here, you can enable/disable flags as below:
- Password-Username Different: Enable this flag if you desire to keep the username and password different. If not, keep it disabled. By default:disabled
- Password change required on first login: Enable this flag if you desire to change the password on very first login. If not, keep it disabled. By default:disabled
- Password Expiry: Enable this flag and mention the number of days after which the password should expire automatically. If not, keep it disabled. By default:disabled
- Password Uppercase: Enable this flag if you wish to include any Uppercase letters in password as mandatory. Aside, mention the minimum number of uppercase letters required. If not, keep it disabled. By default:disabled
- Password Lowercase: Enable this flag if you wish to include any Uppercase letters in password as mandatory. Aside, mention the minimum number of Lowercase letters required. If not, keep it disabled. By default:disabled
- Password with Special Character: Enable this flag if you wish to include any Special Character in your password as mandatory. Aside, mention the minimum number of Special Case letters required. If not, keep it disabled. By default:disabled
- Password with Number: Enable this flag if you wish to include any Number in your password as mandatory. Aside, mention the minimum number of numeric letters required. If not, keep it disabled. By default:disabled
- Minimum Password Length: Enable this flag and mention the minimum length of password. If not, keep it disabled. By default:disabled
- Number of Past Password to maintain: Enable this flag and mention the minimum number of passwords you wish the system to store. If not, keep it disabled. By default:disabled
Motadata Report: This section includes the settings for exporting the report.

- Unplanned Activity Export: Enable if you want the unplanned activity data to be available in the exported report. If disabled, the unplanned activity will not be visible in the exported report. By default it is enabled.
- DD:HH:MM:SS Time Format Export: Enable to download the report for Availability Grid, Availability TopN, and Alert Grid in the DD:HH:MM:SS format.
- Report Export Limit: Set the number of lines limit you wish when the report is exported.
Allow Monitor Polling Issue Mail: To get an email and global notification on the screen when the monitor doesn’t respond to Motadata’s poll request, enable this feature. When Motadata doesn’t get a response from the monitor, it sends an email and global notification. If the monitor is still not responding, Motadata will not send further emails. When monitor responds to poll request, Motadata will send you an email and global notification again.
You can configure for which monitors Motadata should send an email and global notification and who should receive them. Use the filter conditions and values to select the monitors (or their range). Use the ‘Action’ to select the email addresses.

Auto Refresh: Configure the auto-refresh time to refresh the GUI on Home page and Alert Stream page. The default time is 5 minutes (same as polling time).
License Expiry Configuration: Configure the number of days for the trap generation of the License Expiry. For Example, you require the trap to be generated before 5 days of License Expiry, configure ‘5’ days here.

Motadata System Username and Password: Type the Motadata server User and Password (The password that you use to access the back-end of Motadata) The User can be any created. By default: root here. This password is required to see data in Motadata Health.

Motadata System SSH Key and Passphrase: Enter the Client specific SSH Key and Passphrase. This Key needs to be generated in backend from Client’s end.

Google Map API Key: The Google Map API Key is a key you get from the Google maps. This key is required for communication between Motadata and Google Maps. You need to enter Google Map API key to use Google Maps in the Widgets.

Firmware Repository Path: You can mention the path of the Repository path to be considered for the scanning and discovery.

White Labeling: You can change the logo of Motadata to white label the product under your organization’s brand. Upload the logo file (up to 1 MB) and save the settings.
