Live Trail in ObserveOps
The Live Trail gives you a real-time stream of every log arriving in ObserveOps. Use it to confirm your log sources are sending data, verify that timestamps are being extracted correctly, and check what's flowing through the system before you build or adjust pipelines.
Prerequisites
- Log ingestion is configured. See Log Ingestion.
- You have access to Settings > Observability Pipeline > Log Pipeline.
How It Works
The Live Trail streams logs as they arrive. ObserveOps extracts the timestamp from each log automatically. For at least 95% of all log types, the correct timestamp is extracted. For the remaining cases where extraction is not possible, ObserveOps uses the ingestion time as the timestamp.
Access the Live Trail
Go to Settings > Observability Pipeline > Log Pipeline, then click Live Trail to expand the section.
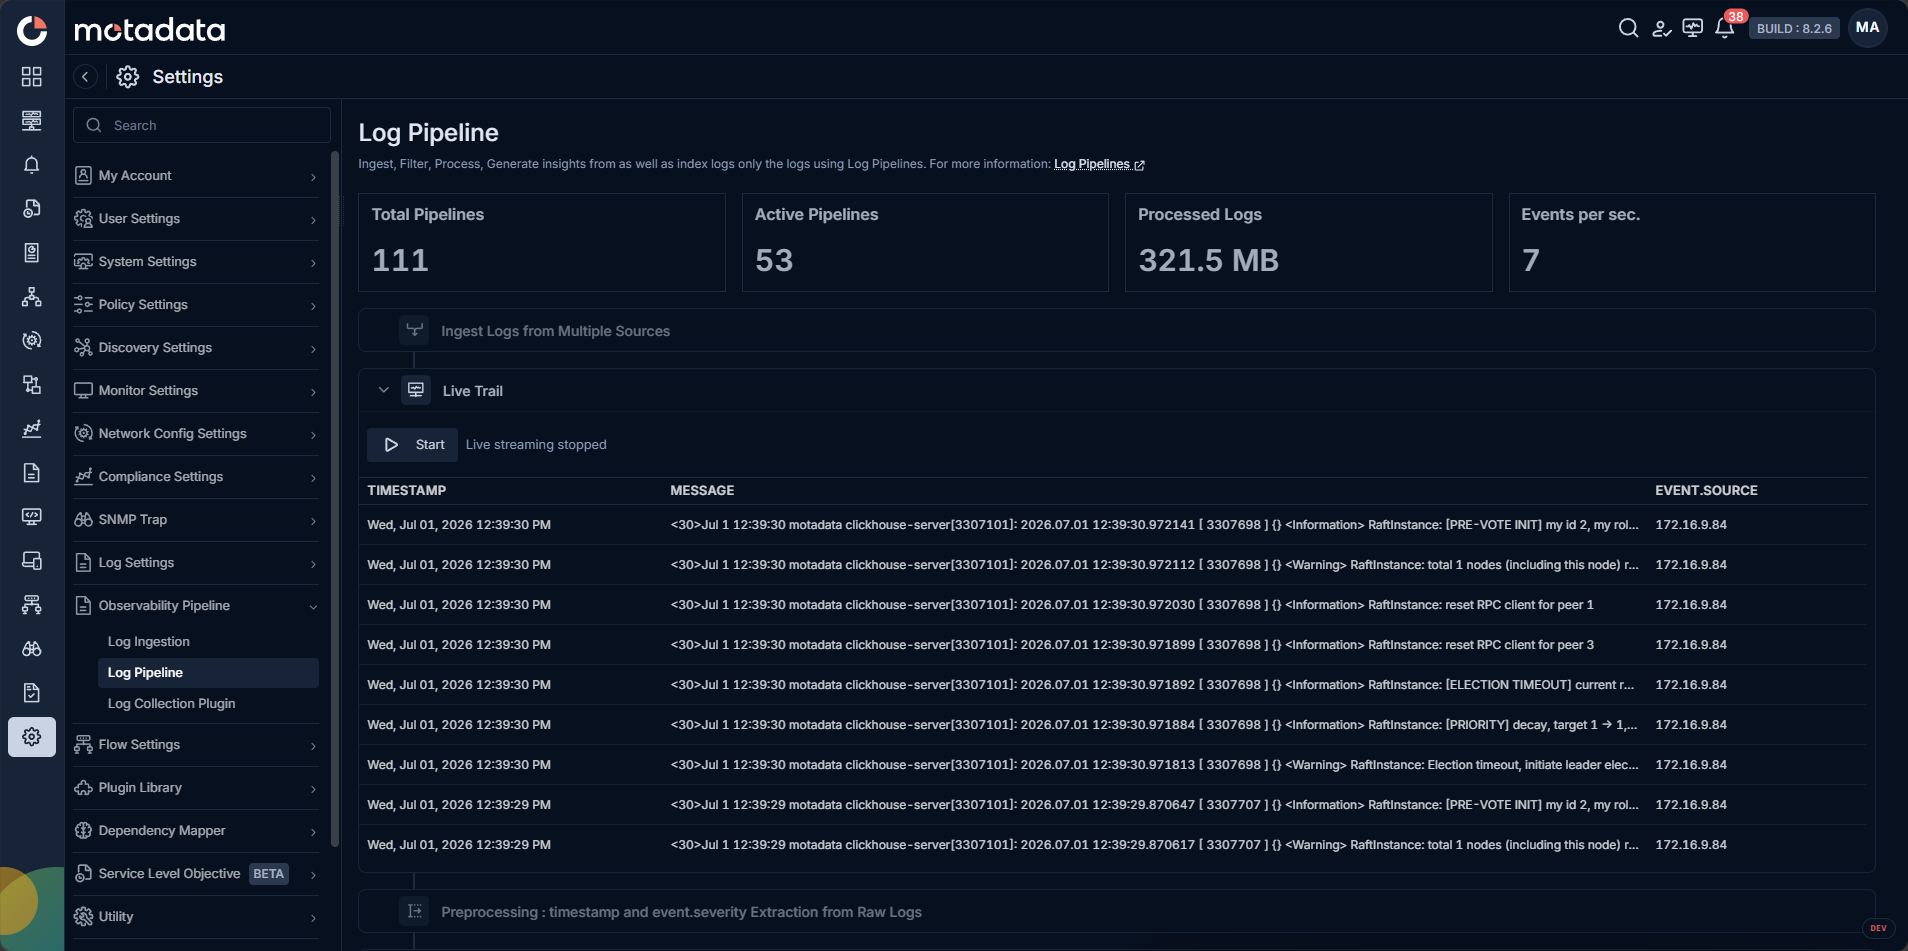
Click Start to begin streaming. The stream shows logs as they arrive.
What You See
Each row in the Live Trail shows three columns:
| Column | Description |
|---|---|
| TIMESTAMP | The timestamp extracted from the log. When extraction fails, this shows the ingestion time. |
| MESSAGE | The full log message as it arrived |
| EVENT SOURCE | The source that sent this log |
Log Detail Panel
Click any log in the Live Trail to open a detail panel. The panel shows all parsed fields for that log — the same view as Log Explorer.
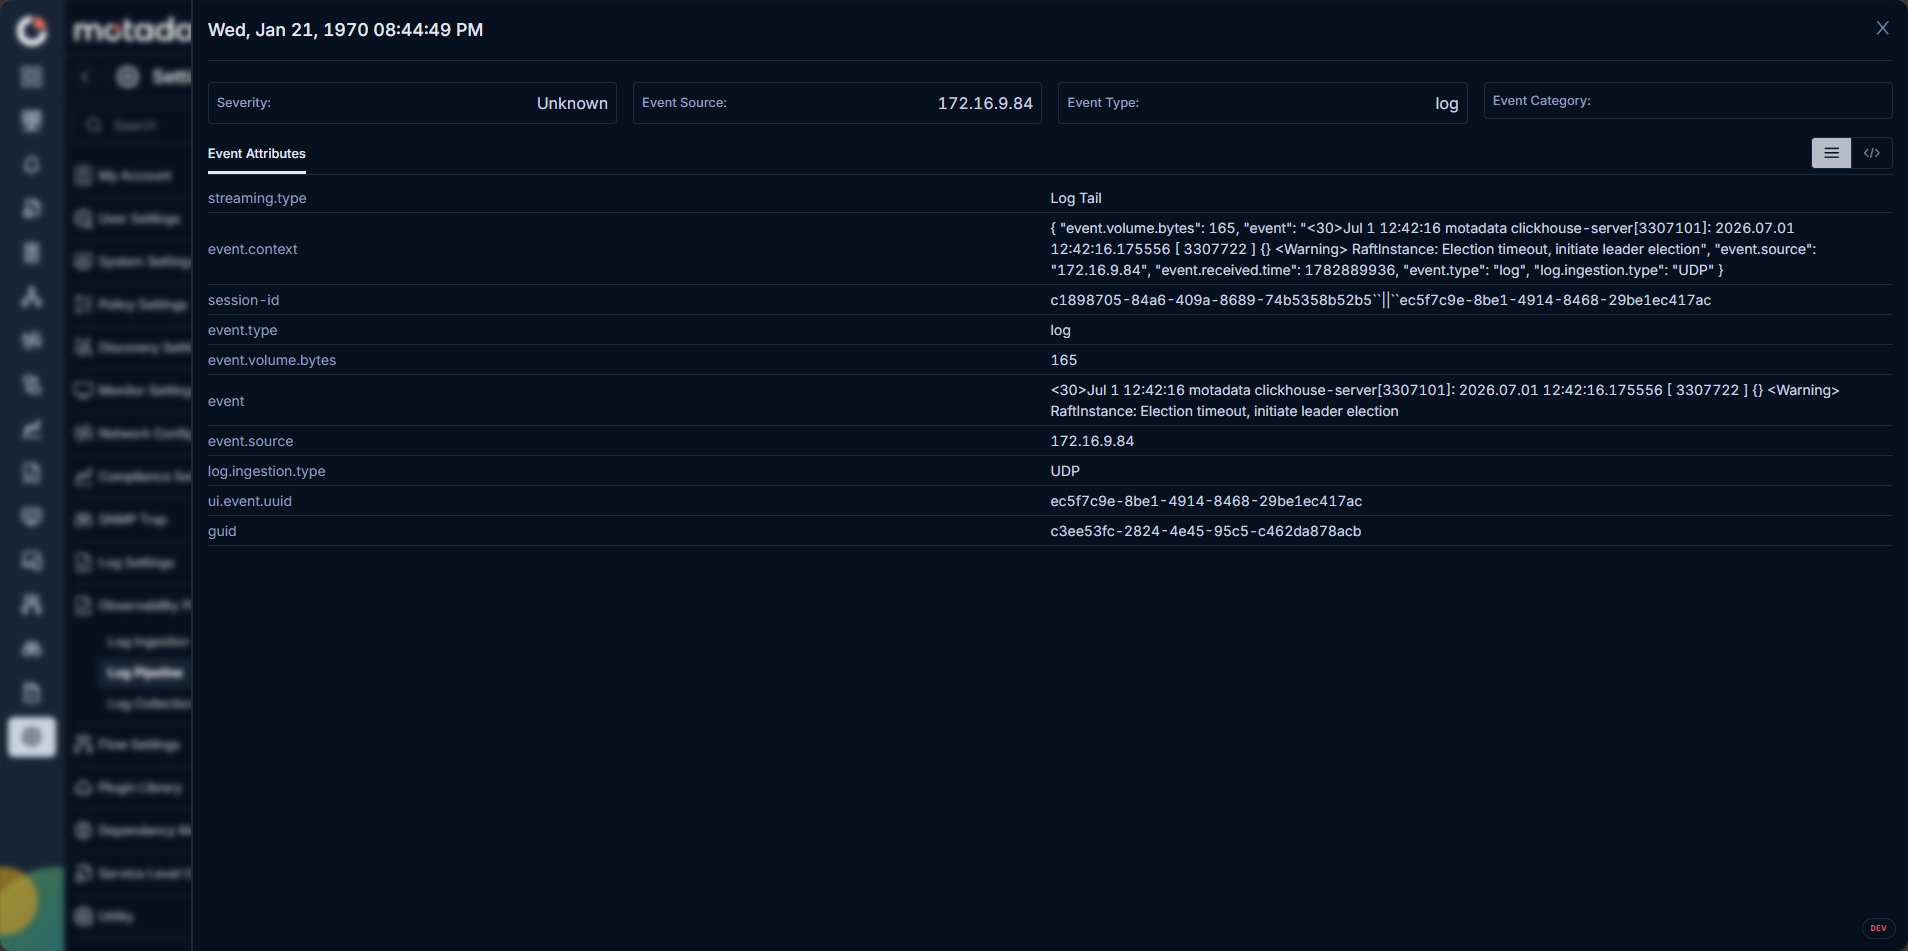
The detail panel shows:
- Severity, Event Source, Event Type, Event Category at the top
- All Event Attributes in a table with field names and values
Use the Live Trail as your first check whenever you add a new log source. Confirm logs are arriving and timestamps look correct before you build parsers.