Log Pattern in ObserveOps
Log Pattern in ObserveOps automatically groups similar log messages into patterns. Instead of scrolling through thousands of individual log lines, you see a condensed list of distinct patterns, each with a count of how many logs match it. Spot anomalies, detect brute force attempts, and identify high-volume noise sources in seconds — without writing a single query.
Prerequisites
- Logs are flowing into ObserveOps. See Log Ingestion.
- At least one log source is sending data and logs are visible in Log Search.
How Log Pattern Works
When you open the Log Pattern tab, ObserveOps takes the current log results (filtered or unfiltered) and runs a tokenization algorithm across every log message. It replaces variable parts of each message with typed placeholders and groups logs that share the same structural template.
Pattern Generation Triggers
Log Patterns generate automatically in these situations:
- When the Log Pattern tab first loads
- When you change a filter or adjust the time range
- When you refresh the page
Pattern generation always reflects the same query that produced the current Event Log results. You do not need to be on the Log Pattern tab for patterns to generate.
Tokenization
ObserveOps identifies the variable parts of each log message and replaces them with typed tokens. The fixed parts of the message stay visible. This makes similar messages cluster into a single pattern.
Token Types:
| Token | What It Masks |
|---|---|
| NUM | Numeric values, including integers and decimals |
| IP | IPv4 and IPv6 addresses |
| Email addresses | |
| URL | Web links and URLs |
| GUID | Globally unique identifiers (UUID format) |
| ID | Generic identifiers that do not match other types |
| SEQ | Sequence numbers |
| HEX | Hexadecimal values |
| CMD | Command strings |
Any value that does not match one of these categories is masked as *****.
Tokenization delimiters: ObserveOps splits messages using spaces, caret (^), pipe (|), colon (:), and equals (=). Any content inside double quotes ("") is treated as a single token.
Example: These three log lines all produce the same pattern:
Failed password for root from 192.168.1.10 port 22 ssh2
Failed password for root from 10.0.0.5 port 22 ssh2
Failed password for root from 172.16.0.2 port 22 ssh2
Pattern: Failed password for root from IP port NUM ssh2
All three map to one pattern. The count shows 3.
Access Log Pattern
- Go to the main menu and select Log Explorer.
- Apply any filters or time range you need.
- Click the Log Pattern tab.
The tab shows all patterns derived from the current query results.
Read the Log Pattern List
The Log Pattern list shows each distinct pattern with:
| Column | What It Shows |
|---|---|
| Count | Number of logs that match this pattern |
| Pattern | The log message template with variable parts replaced by typed tokens |
| event.severity | The severity level of logs matching this pattern |
If logs under the same structural pattern have different severities (for example, because a custom remapper assigns different severity values), ObserveOps groups them into separate rows — one per severity.
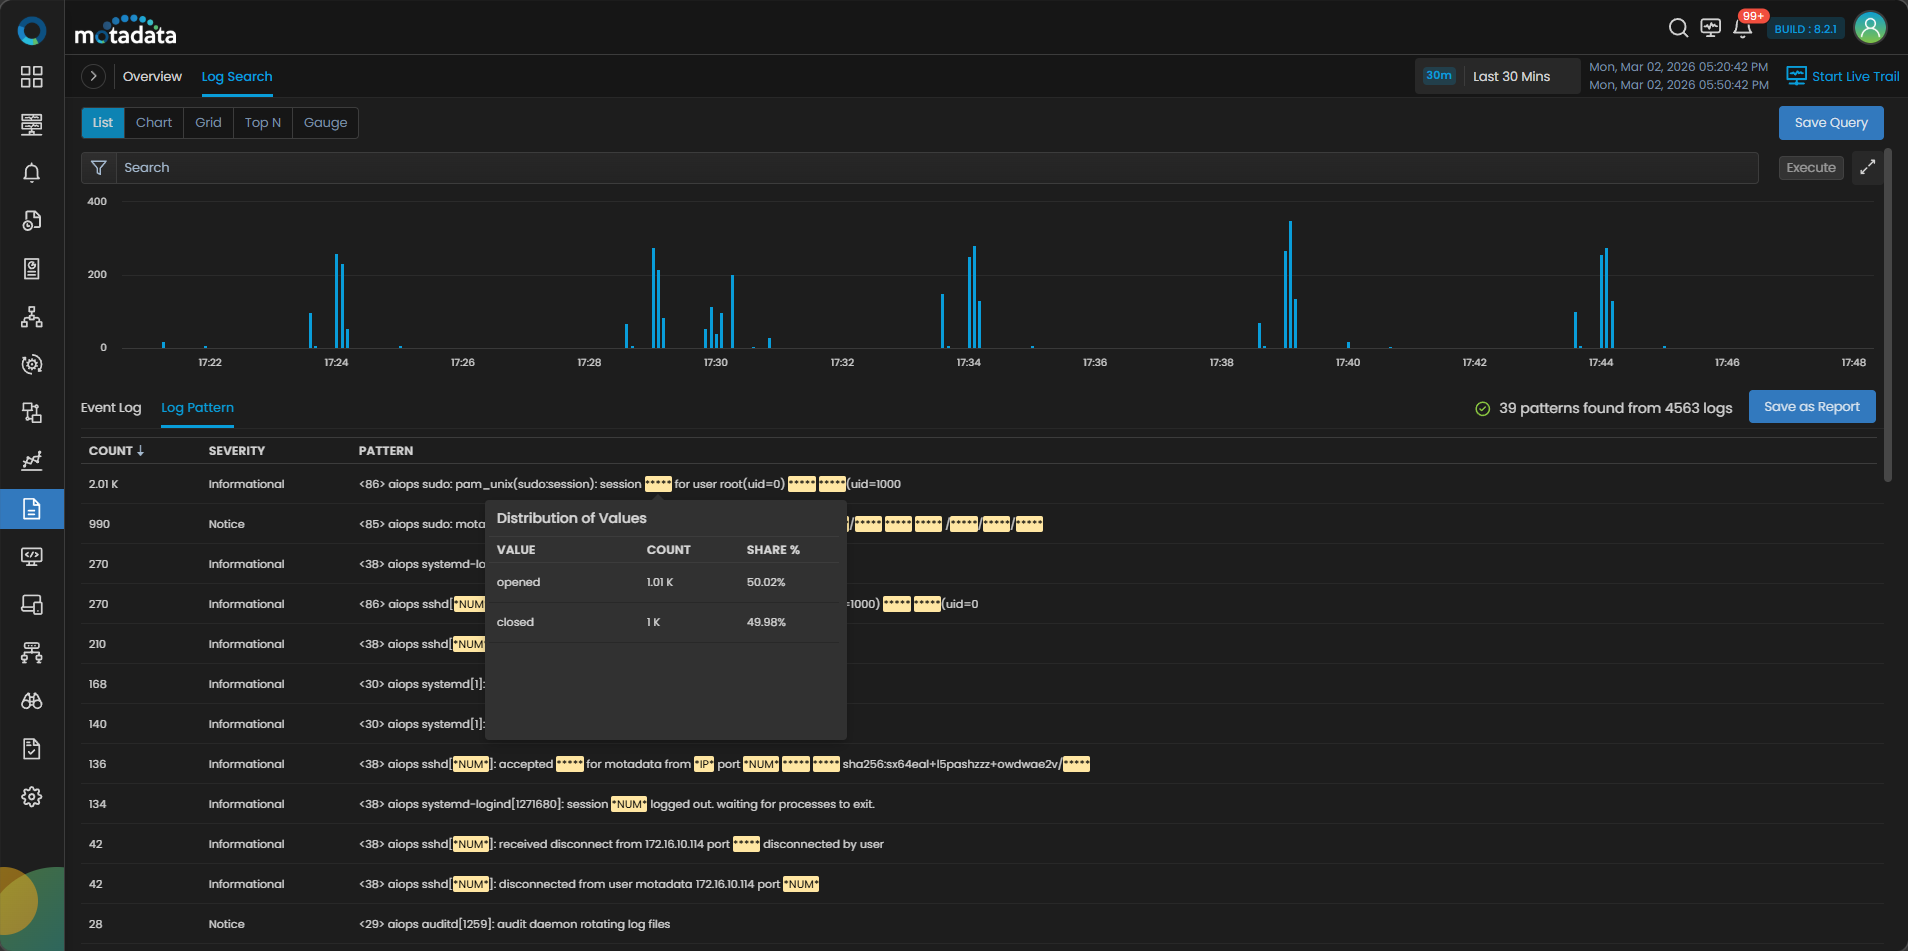
Distribution of Values
Every masked token in a pattern is interactive. Hover over any highlighted token to open the Distribution of Values panel. It shows the actual values that appeared in logs grouped under that token position.
| Column | What It Shows |
|---|---|
| Value | The actual value observed in that position |
| Count | How many logs contain that specific value |
| Share % | Percentage of the pattern total. Formula: (Value Count / Pattern Count) × 100 |
What you can do with it:
- See which IP addresses generated the most failed SSH logins
- Find which user IDs appear most often in authentication failures
- Identify which status codes dominate an error pattern
- Confirm which specific command strings produced a spike
Example: You see the pattern Failed password for root from IP port NUM ssh2 with a count of 450. Hover over the IP token. The Distribution of Values shows:
| Value | Count | Share % |
|---|---|---|
| 185.220.101.5 | 312 | 69.3% |
| 45.33.32.156 | 98 | 21.8% |
| 192.168.1.10 | 40 | 8.9% |
One external IP accounts for 69% of all failed login attempts. That's your brute force source.
Use Cases
Detect Brute Force Attacks
A Failed password pattern with a very high count and concentrated IP distribution is a classic brute force signal. Use the Distribution of Values on the IP token to identify the attacking address. Cross-reference with your firewall or security tools.
Spot High-Volume Noise
Some log patterns appear thousands of times a day but carry no operational value. Patterns with high counts and no meaningful variance in their tokens are noise candidates. Feed these patterns into Exclude Unwanted Logs to remove them from storage.
Identify Outliers
Sort the pattern list by Count ascending. Low-count patterns are outliers. A one-time pattern in an otherwise stable system is often worth investigating. It could be an unusual authentication event, a config change, or the first sign of a new error class.
Compare Pattern Volume Over Time
Apply a short time range (last 1 hour) and note pattern counts. Apply a longer range (last 24 hours) and compare. A pattern that suddenly increased in count in the last hour stands out against the baseline.
Triage Application Errors
After a deployment, open Log Pattern filtered to your application's log type. New patterns that did not exist before the deployment point to new error conditions introduced by the release.
Relationship to Log Search Filters
Log Pattern always reads from the same query as the Event Log tab. Any filter you apply in Log Search — by source, severity, log type, or custom field — also applies to Log Pattern. You do not need to re-enter filters when switching tabs.
This means you can:
- Filter to a specific service or host in Log Search
- Switch to Log Pattern to see all distinct message templates for that service
- Hover over tokens to drill into specific values
- Switch back to Event Log to read the full log lines for any pattern you want to investigate
Expandable Key-Based Filters
The left panel in Log Search shows all parsed log field keys with their value counts. These filters apply to Log Pattern as well. Expand any field to see its value breakdown. Select a value to filter. Combine multiple field values to narrow patterns to an exact subset of logs.
For example, expand event.severity and select ERROR to limit Log Pattern to only error-level messages. Expand source.host and select a specific host to see only that host's patterns.
Known Limitations
- Log Pattern works on the current query results up to the result limit. Very large result sets may produce fewer patterns than the full log volume contains.
- Patterns use message-level tokenization only. Structured field values (from parsers) are not pattern-matched.
- Severity grouping applies to
event.severityonly. Other severity fields do not split patterns. - Pattern generation happens client-side after results load. Very long message strings may affect grouping quality.
Troubleshooting
The Log Pattern tab shows no patterns
Cause: No logs match the current filter and time range, or the page did not finish loading.
Fix: Check the Event Log tab for results first. If Event Log shows logs, refresh the page. If Event Log is also empty, adjust the time range or remove filters.
All messages appear as a single pattern
Cause: The messages are highly uniform — either they have no variable parts, or they are all unstructured text that tokenizes the same way.
Fix: Check the raw log content in Event Log to confirm the messages differ. If they do differ but pattern the same, the differences may be inside quoted strings (treated as single tokens) or using delimiters not in the tokenizer set.
Pattern counts do not match Event Log counts
Cause: Patterns aggregate across all logs in the result set. If a log message partially matches multiple pattern structures, it may be counted once in one pattern.
Fix: This is expected behavior. The total across all pattern counts equals the total log count for the current query.
Distribution of Values shows only a few entries
Cause: Only a small number of distinct values appeared at that token position in the current result set.
Fix: Expand the time range to include more logs and recheck the distribution.