Adding Software Defined Network Devices for Monitoring
Software Defined Networking (SDN) is a modern approach to running a network where the entire network is set up, changed, and monitored from a single software layer instead of being configured device by device. This makes networks faster to roll out, easier to keep consistent, and simpler for teams to operate at scale.
ObserveOps (formerly known as AIOps) is a single, unified platform for monitoring the critical KPIs of the leading SDN technologies used in enterprise environments today. It brings health, capacity, performance, and connectivity data from across the SDN estate into one place, so teams no longer have to switch between vendor consoles to understand what is happening on the network.
This guide walks you through discovering these SDN environments and provisioning them as monitors in ObserveOps, after which the platform continuously collects metrics and raises alerts the moment an issue is detected.
SDN Solutions Supported
| Vendor |
|---|
| Cisco Catalyst SD-WAN |
| Cisco Meraki |
| Cisco ACI |
| VMware NSX-T |
Prerequisites
These apply to every SDN vendor listed below. Confirm each item before you start discovery.
- The ObserveOps collector must be able to reach each SDN platform (Cisco Catalyst SD-WAN, Cisco Meraki, Cisco ACI, and VMware NSX-T) on its API endpoint.
- If you use an FQDN instead of an IP address, make sure the FQDN is resolvable through your DNS.
- Firewalls and proxies in the network path must not block traffic between the ObserveOps collector and the SDN platforms so that discovery completes smoothly.
- Cisco Catalyst SD-WAN
- Cisco Meraki
- Cisco ACI
- VMware NSX-T
Adding a Cisco Catalyst SD-WAN Device
ObserveOps supports discovery of Manager, Controller, Validator, and WAN-Edge devices. Discovery of Controller, Validator, and WAN-Edge runs through the Manager, which also fetches tunnel information. Each Controller, Validator, and WAN-Edge device provisions as an individual monitor.
1. Credential Profile
To create the credential profile, go to Menu. Select Settings  . Select Discovery Settings
  . Select Credential Profile. Select Create Credential Profile.
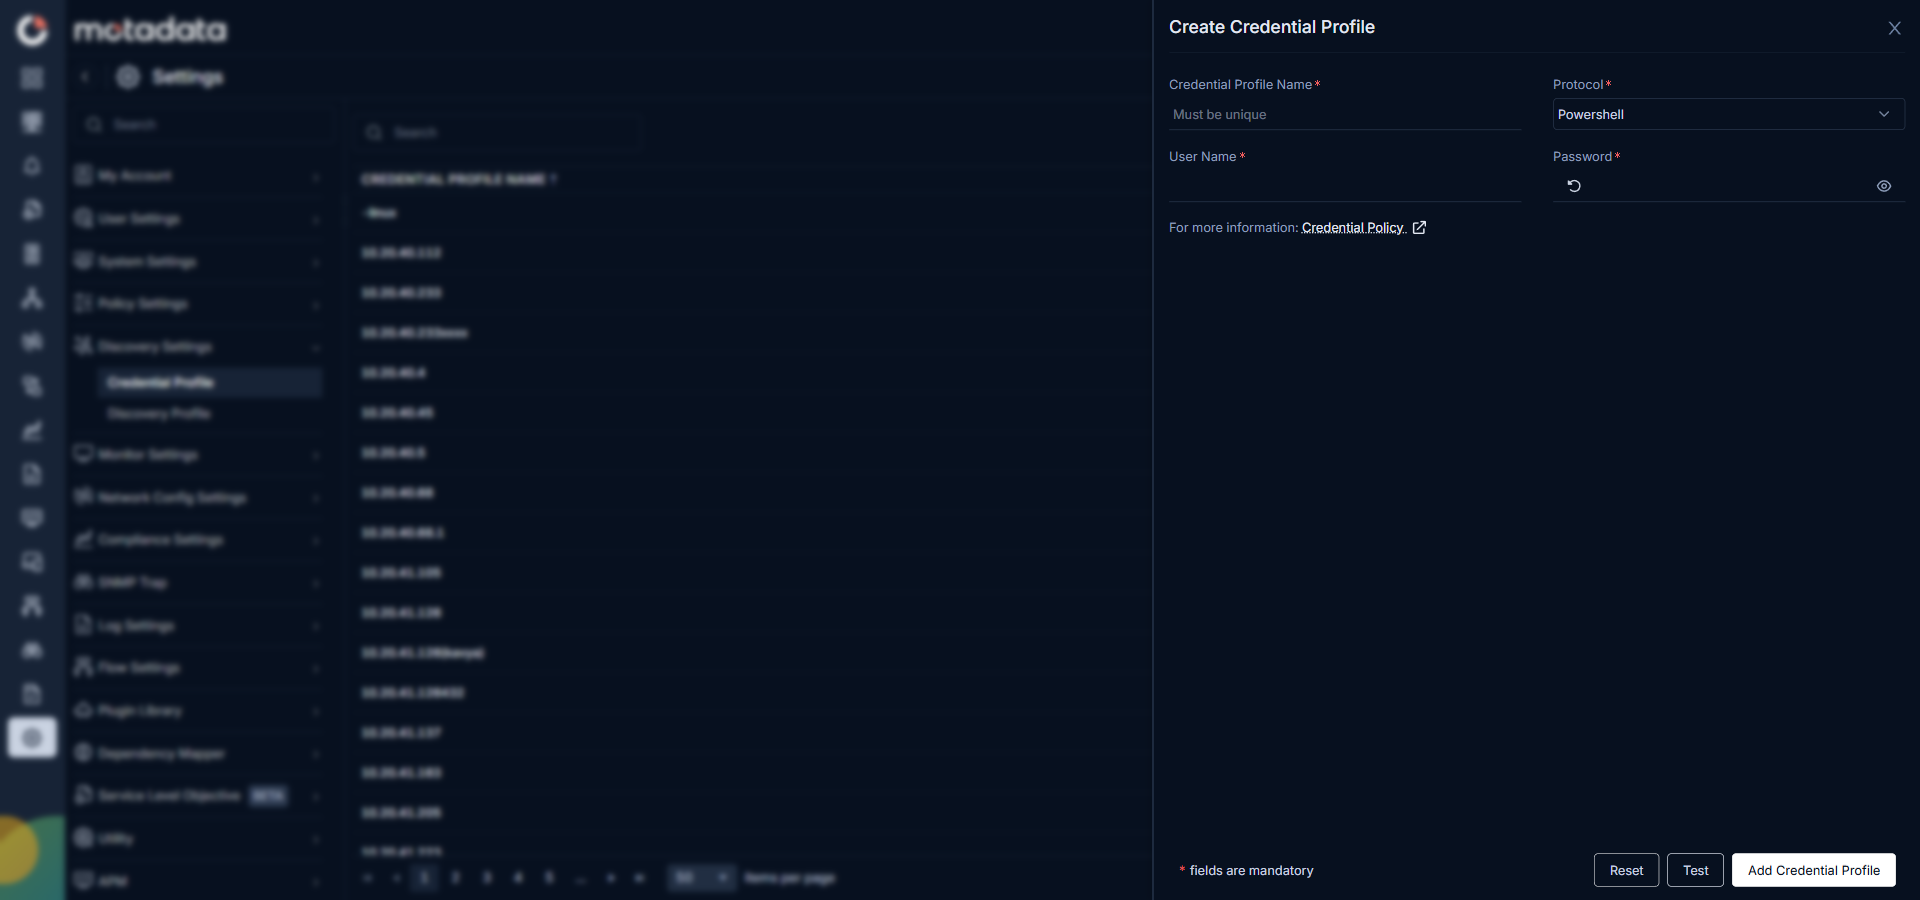
Enter the following on the Create Credential Profile form.
| Field | What to Enter |
|---|---|
| Credential Profile Name | A unique name to identify this profile. |
| Protocol | Select HTTP/HTTPS. |
| Authentication Type | Select Basic. |
| Username | The vManage (Manager) username. |
| Password | The password for that account. |
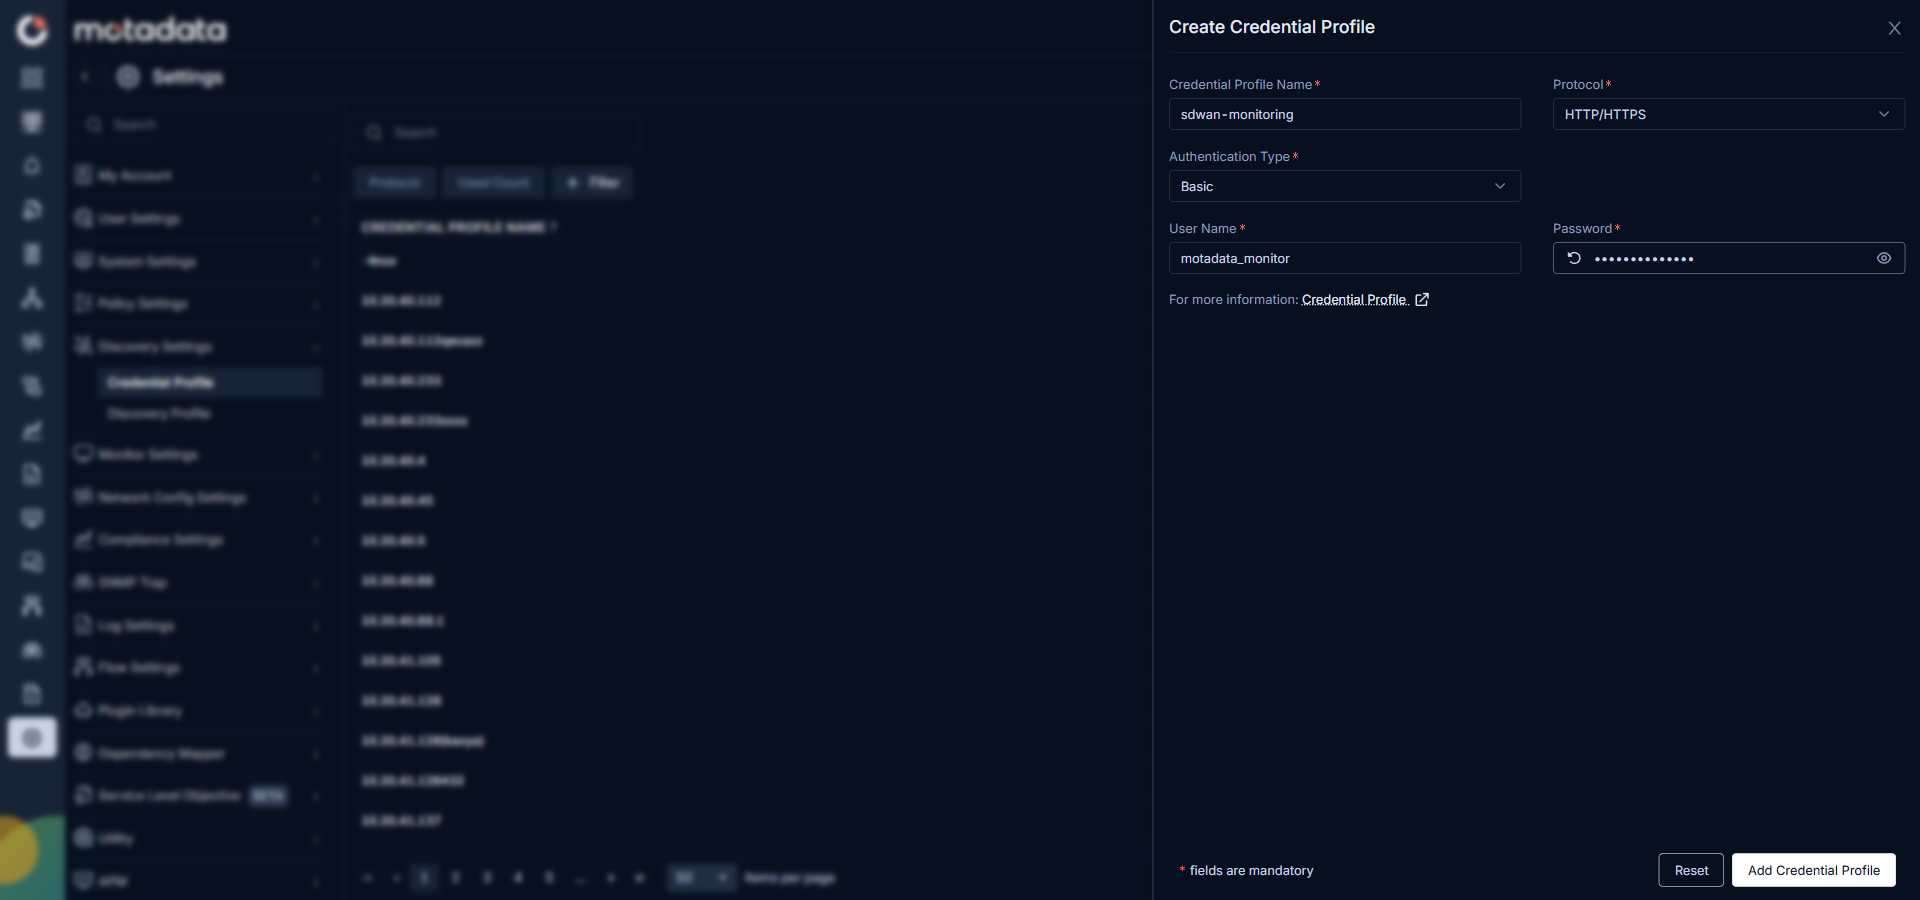
Select Add Credential Profile to save.
2. Create a Discovery Profile
Go to Menu. Select Settings . Select Discovery Settings . Select Discovery Profile. The Discovery Profile screen opens. Select Create Discovery Profile.
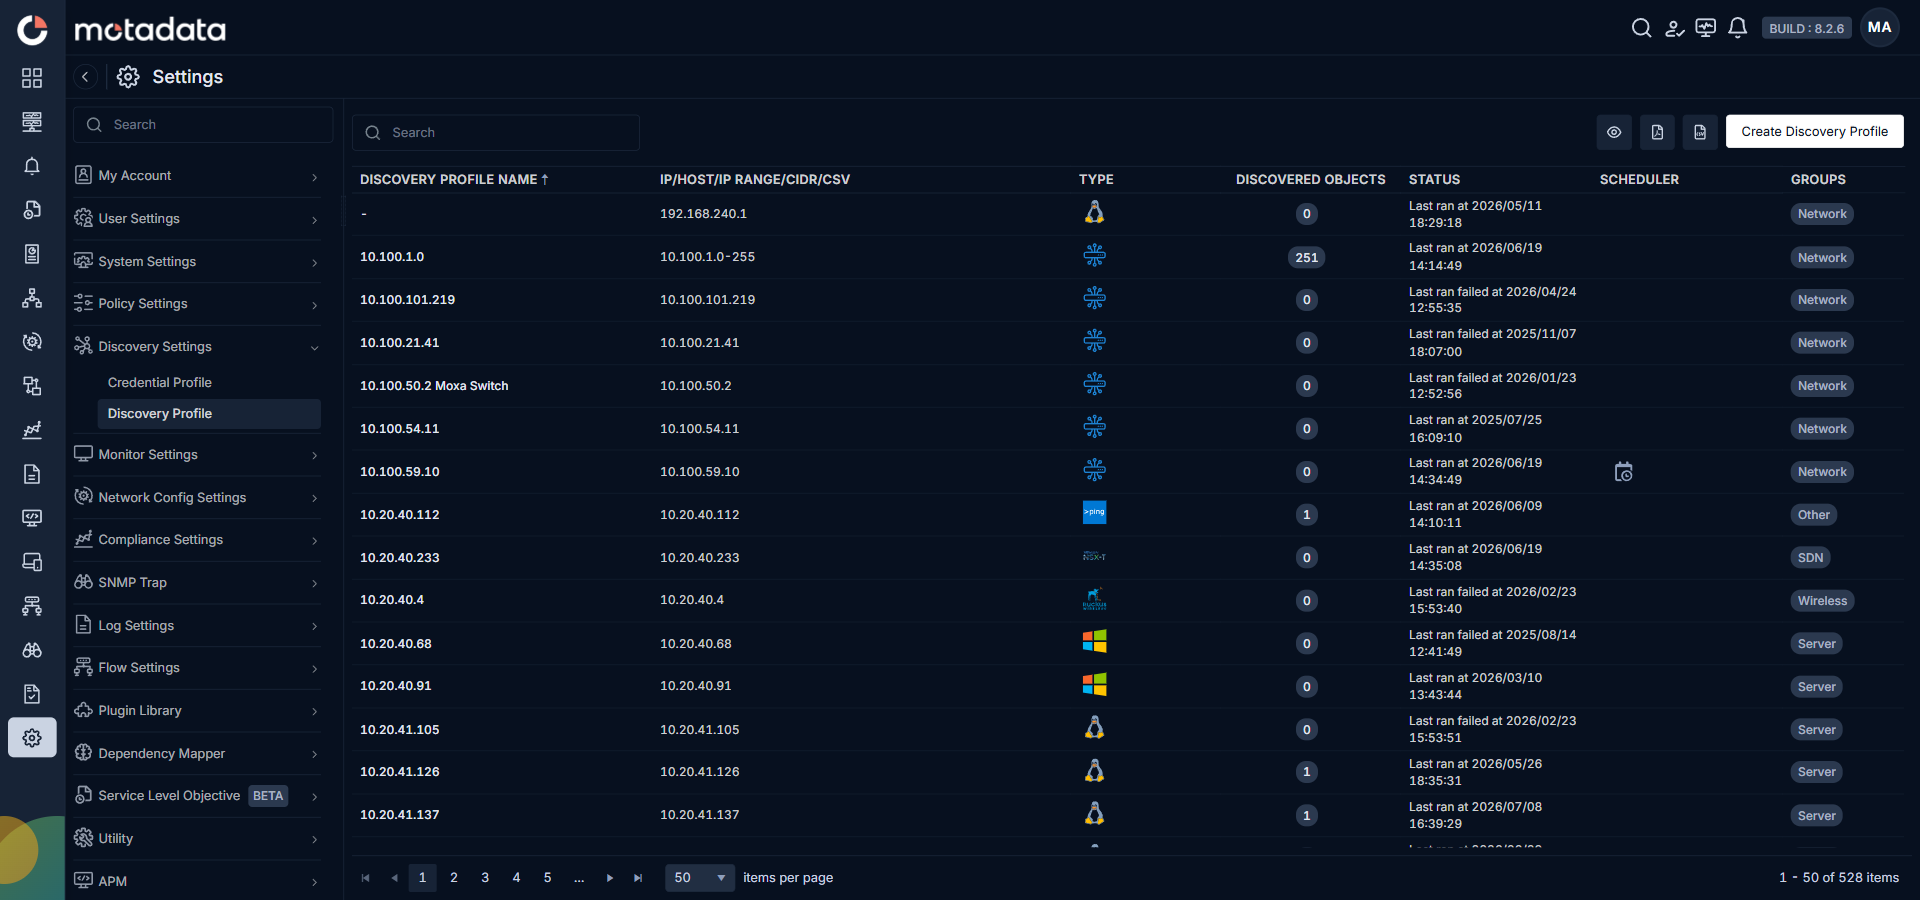
The Create Discovery Profile form opens. Select SDN from the sidebar. Select Cisco Catalyst SD-WAN.
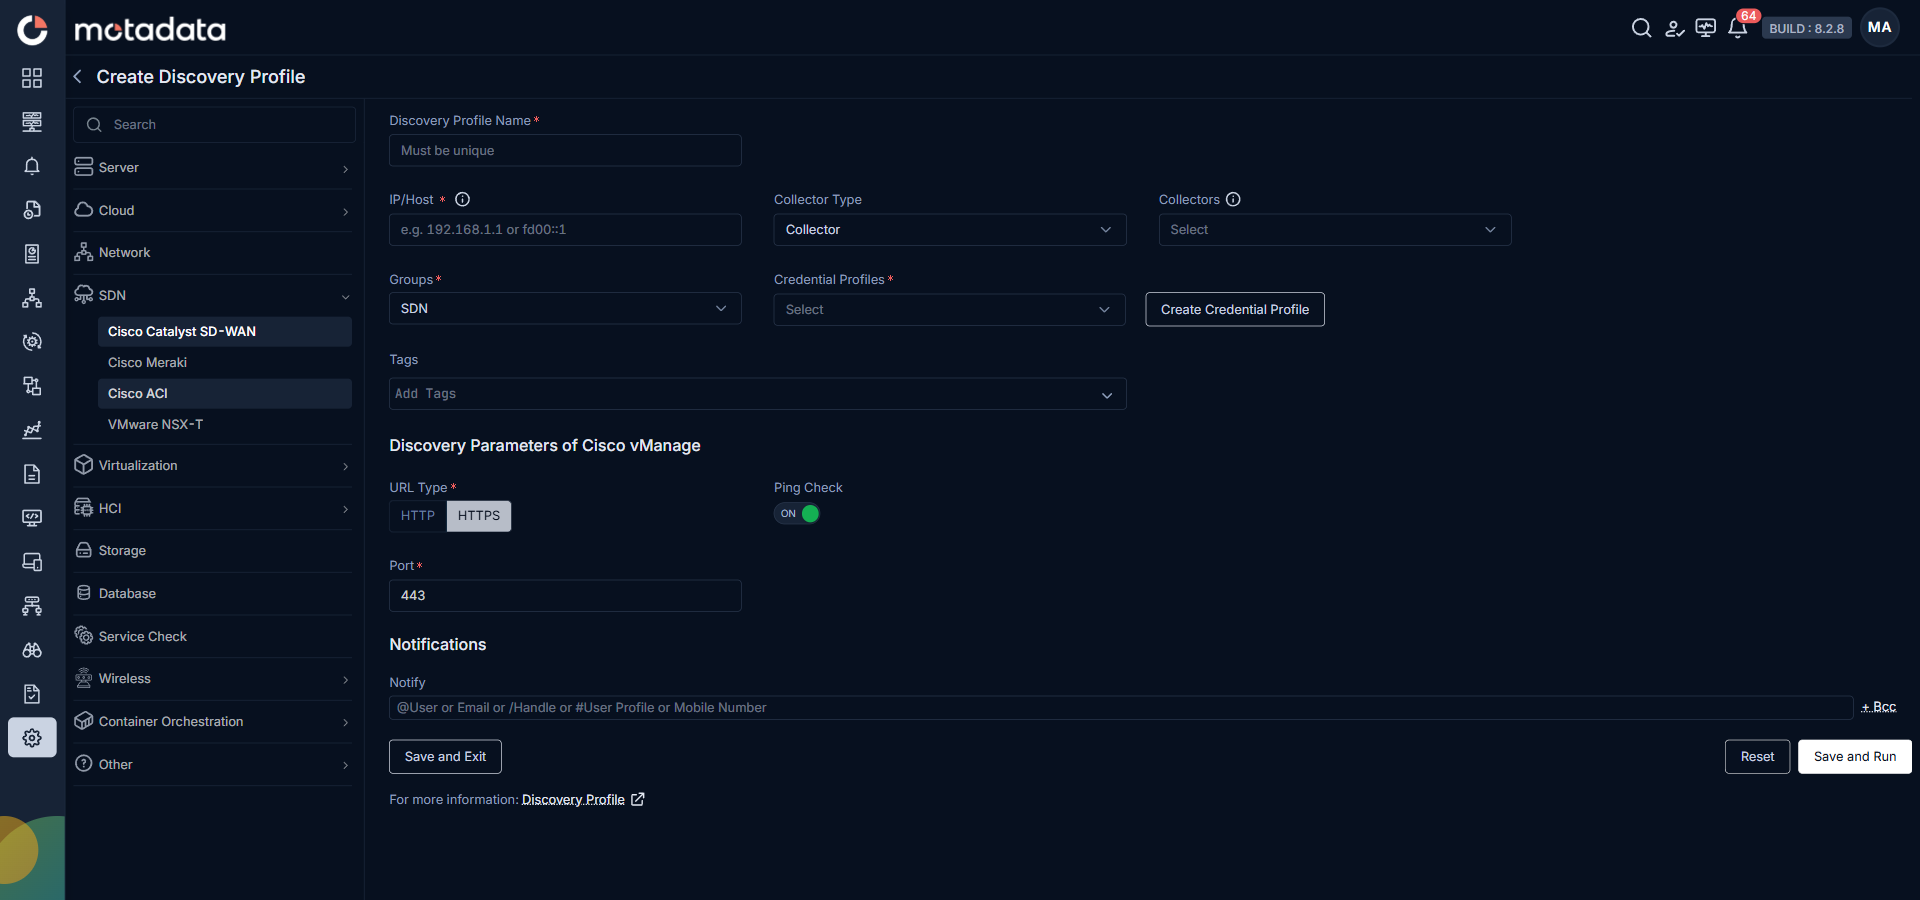
| Field | What to Enter |
|---|---|
| Discovery Profile Name | A unique name to identify this profile. |
| IP / Host | The IP address or fully qualified domain name of the SD-WAN Manager (vManage). |
| Collectors | One or more Collectors for data collection. If you skip this, ObserveOps selects a Collector automatically. |
| Groups | One or more Groups to assign to provisioned monitors |
| Credential Profile | A credential profile with HTTP/HTTPS protocol and Basic authentication, containing the vManage (Manager) username and password. |
| Tags | Tags to assign to discovered devices. |
| Port | 443 by default. Use a custom port only if your deployment publishes one. |
| URL Type | Select HTTPS (default) or HTTP. |
| Ping Check | On by default. Toggle off to discover devices that don't respond to ping. |
| Notify Team | Email addresses, handles, or user profiles to notify when discovery completes. |
Select Collectors based on how you want to distribute the monitoring load.
Select Save and Run to save and start discovery immediately. Select Save and Exit to save without running.
3. Provision the Discovered Devices as Monitors
After the discovery run completes, ObserveOps shows all discovered Controllers, Validators, Managers, and WAN-Edge devices. Select the ones you want to add as Monitors.
Select Add Selected Objects to provision the selected devices as monitors. ObserveOps now collects metrics continuously.
To view the monitors, go to Menu. Select Monitor. Select SDN.
For the full list of metrics ObserveOps collects for Cisco Catalyst SD-WAN, see Cisco Catalyst SD-WAN supported KPIs.
Adding a Cisco Meraki Device
ObserveOps supports discovery of Meraki Security, Meraki Switch, Meraki Radios, Meraki Vision, and Meraki Cellular Gateway devices.
1. Credential Profile
Go to Menu. Select Settings . Select Discovery Settings . Select Credential Profile. Select Create Credential Profile.
Enter the following on the Create Credential Profile form.
| Field | What to Enter |
|---|---|
| Credential Profile Name | A unique name to identify this profile. |
| Protocol | Select HTTP/HTTPS. |
| Authentication Type | Select API Key. |
| API Key | Paste the API key you generated on the Meraki Dashboard. |
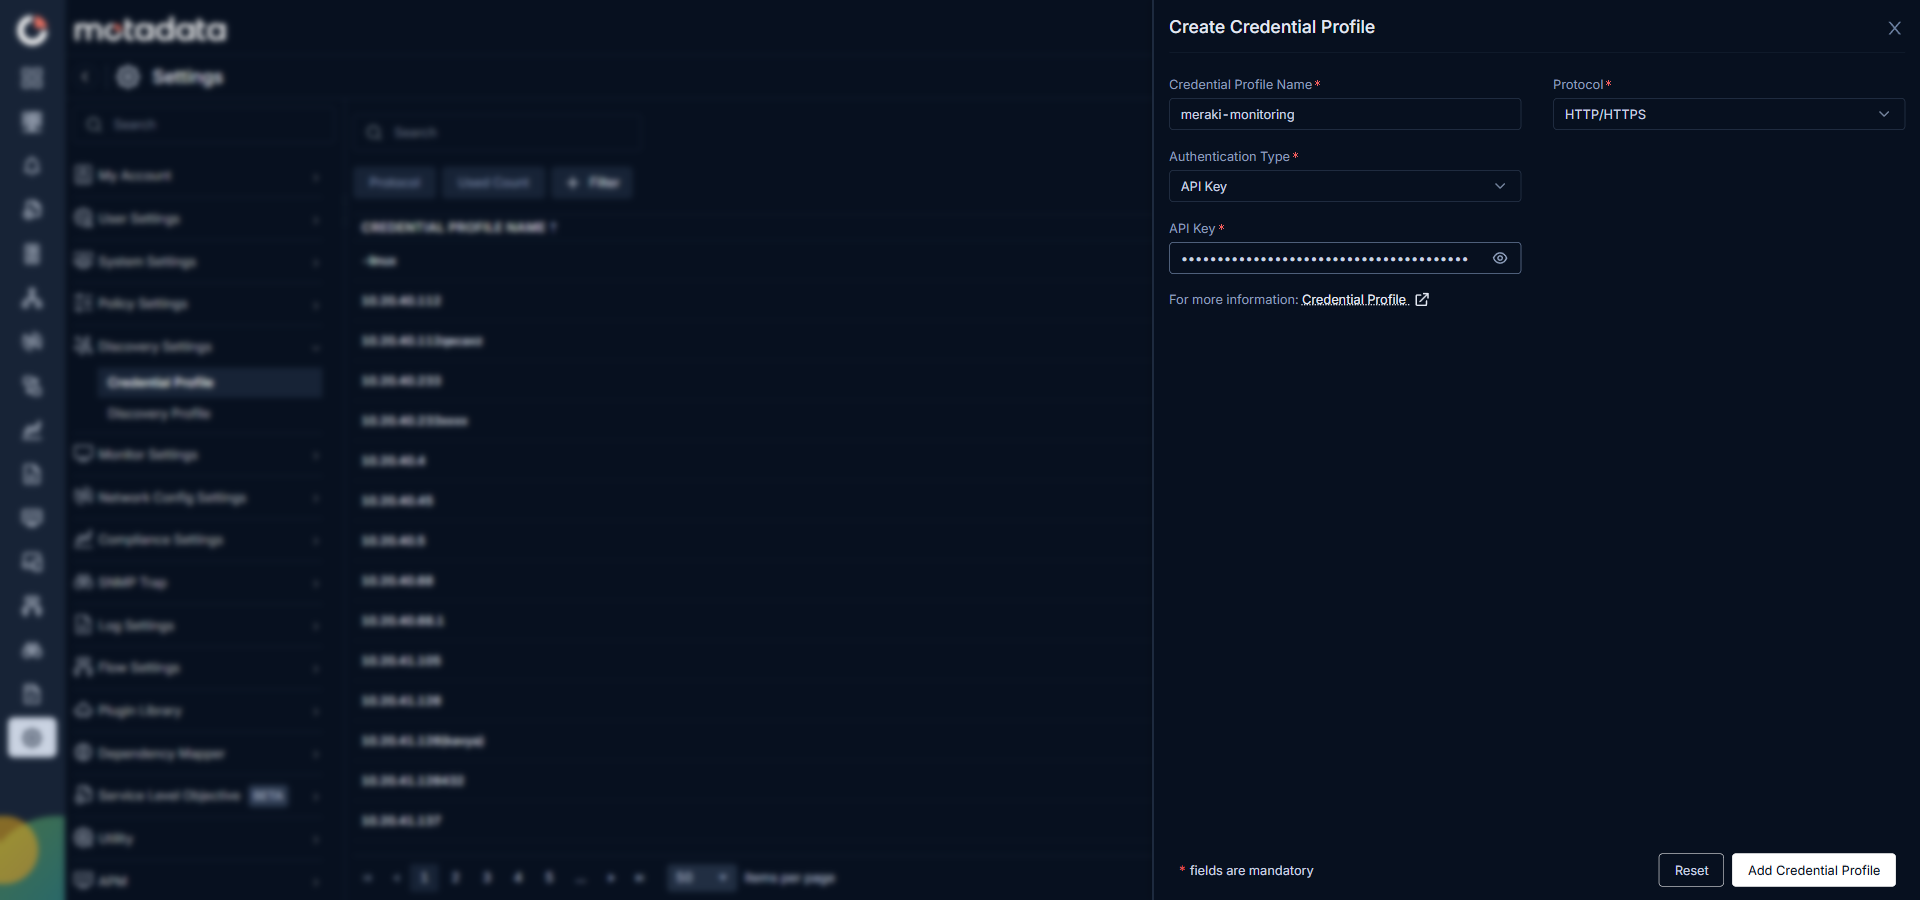
Select Add Credential Profile to save.
2. Create a Discovery Profile
Go to Menu. Select Settings . Select Discovery Settings . Select Discovery Profile. The Discovery Profile screen opens. Select Create Discovery Profile.
The Create Discovery Profile form opens. Select SDN from the sidebar. Select Cisco Meraki.
Select the appropriate API endpoint for the URL Endpoint field based on the Meraki region from the list below.
| Region | Base URL |
|---|---|
| Global | https://api.meraki.com/api/v1 |
| India | https://api.meraki.in/api/v1 |
| Canada | https://api.meraki.ca/api/v1 |
| China | https://api.meraki.cn/api/v1 |
| Government | https://api.gov-meraki.com/api/v1 |
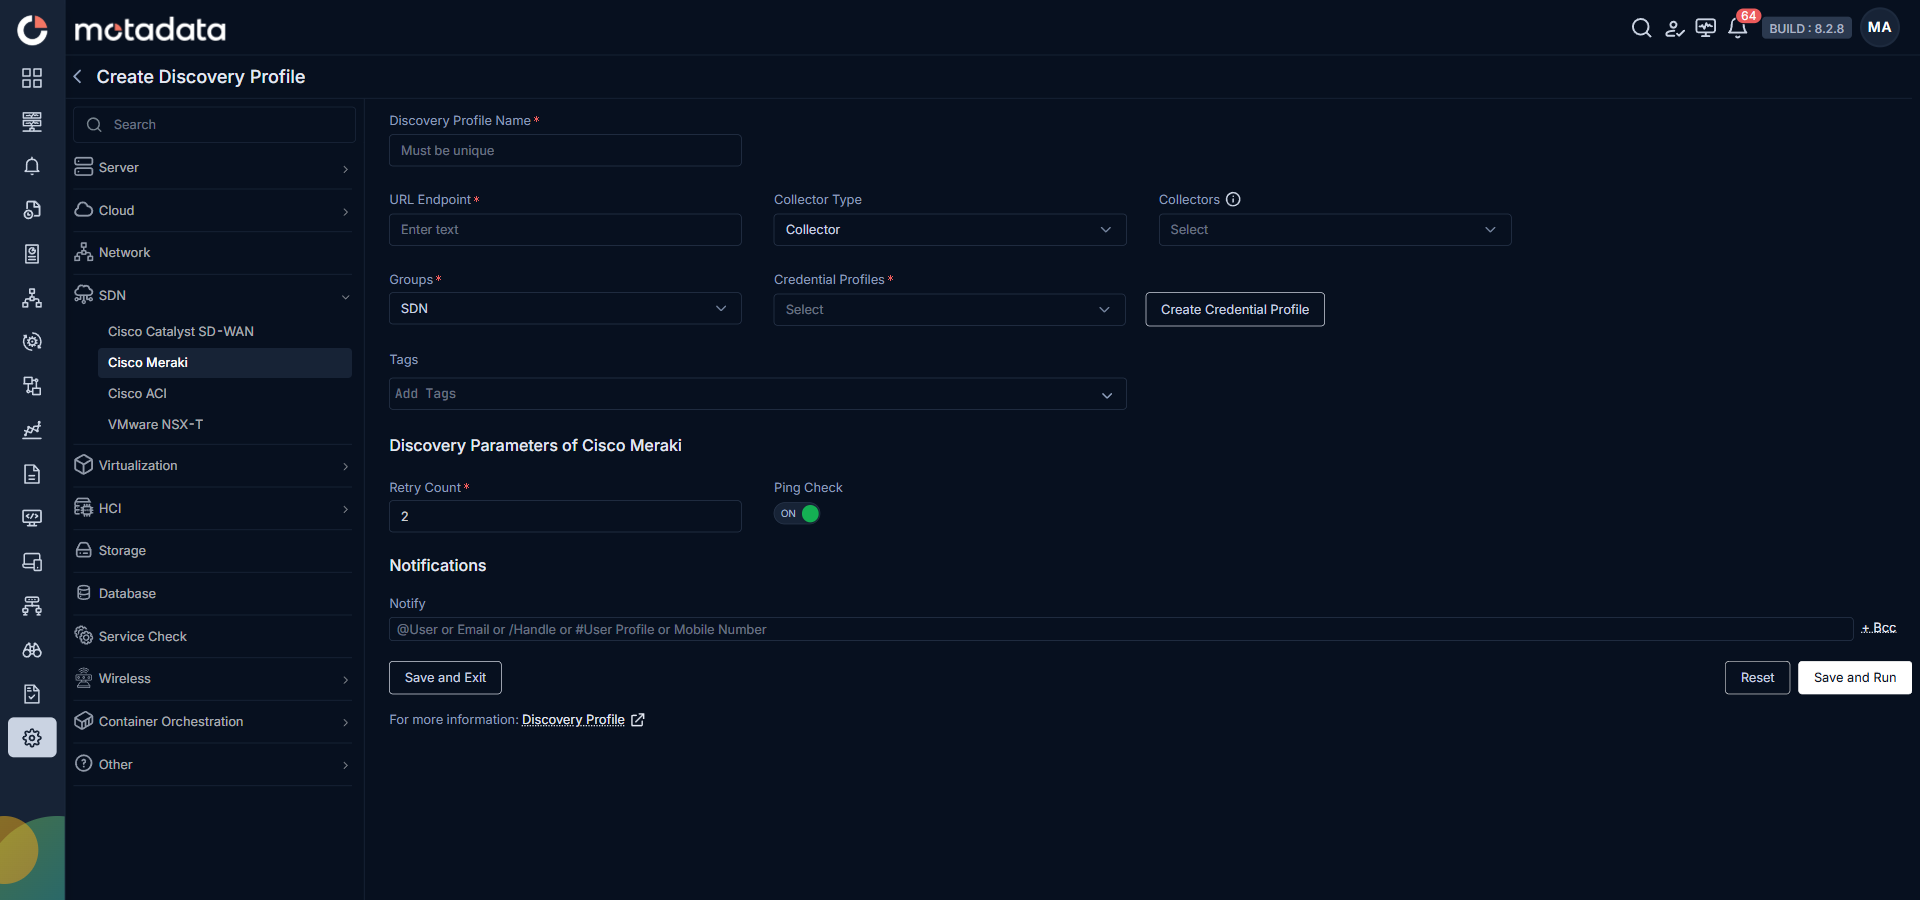
| Field | What to Enter |
|---|---|
| Discovery Profile Name | A unique name to identify this profile. |
| URL Endpoint | It is the base URL provided by Cisco Meraki. Make sure to enter correct URL endpoint based on the region. |
| Collectors | One or more Collectors for data collection. If you skip this, ObserveOps selects a Collector automatically. |
| Groups | One or more Groups to assign to provisioned monitors. |
| Credential Profile | A credential profile with HTTP/HTTPS protocol and api key. |
| Tags | Tags to assign to discovered devices. |
| Retry Count | Number of retries before ObserveOps considers the device unreachable. |
| Ping Check | On by default. Toggle off to discover devices that don't respond to ping. |
| Notify Team | Email addresses, handles, or user profiles to notify when discovery completes |
Select Collectors based on how you want to distribute the monitoring load.
Select Save and Run to save and start discovery immediately. Select Save and Exit to save without running.
3. Provision the Discovered Devices as Monitors
After the discovery run completes, ObserveOps shows all discovered Meraki devices. Select the ones you want to add as Monitors.
Select Add Selected Objects to provision the selected devices as monitors. ObserveOps now collects metrics continuously.
To view the monitors, go to Menu. Select Monitor. Select SDN.
For the full list of metrics ObserveOps collects for Cisco Meraki, see Cisco Meraki supported KPIs.
Adding Cisco ACI Devices
ObserveOps discovers the Cisco ACI environment through the APIC (Application Policy Infrastructure Controller) and provisions the APIC itself, the underlying Fabric hardware (spines, leaves, and pods), and every Tenant configured on the controller as individual monitors.
1. Prerequisites and Credential Profile
To create the credential profile, go to Menu. Select Settings . Select Discovery Settings . Select Credential Profile. Select Create Credential Profile.
Enter the following on the Create Credential Profile form.
| Field | What to Enter |
|---|---|
| Credential Profile Name | A unique name to identify this profile. |
| Protocol | Select HTTP/HTTPS. |
| Authentication Type | Select Basic. |
| Username | APIC local or supported remote-authentication user. |
| Password | The password for that account. |
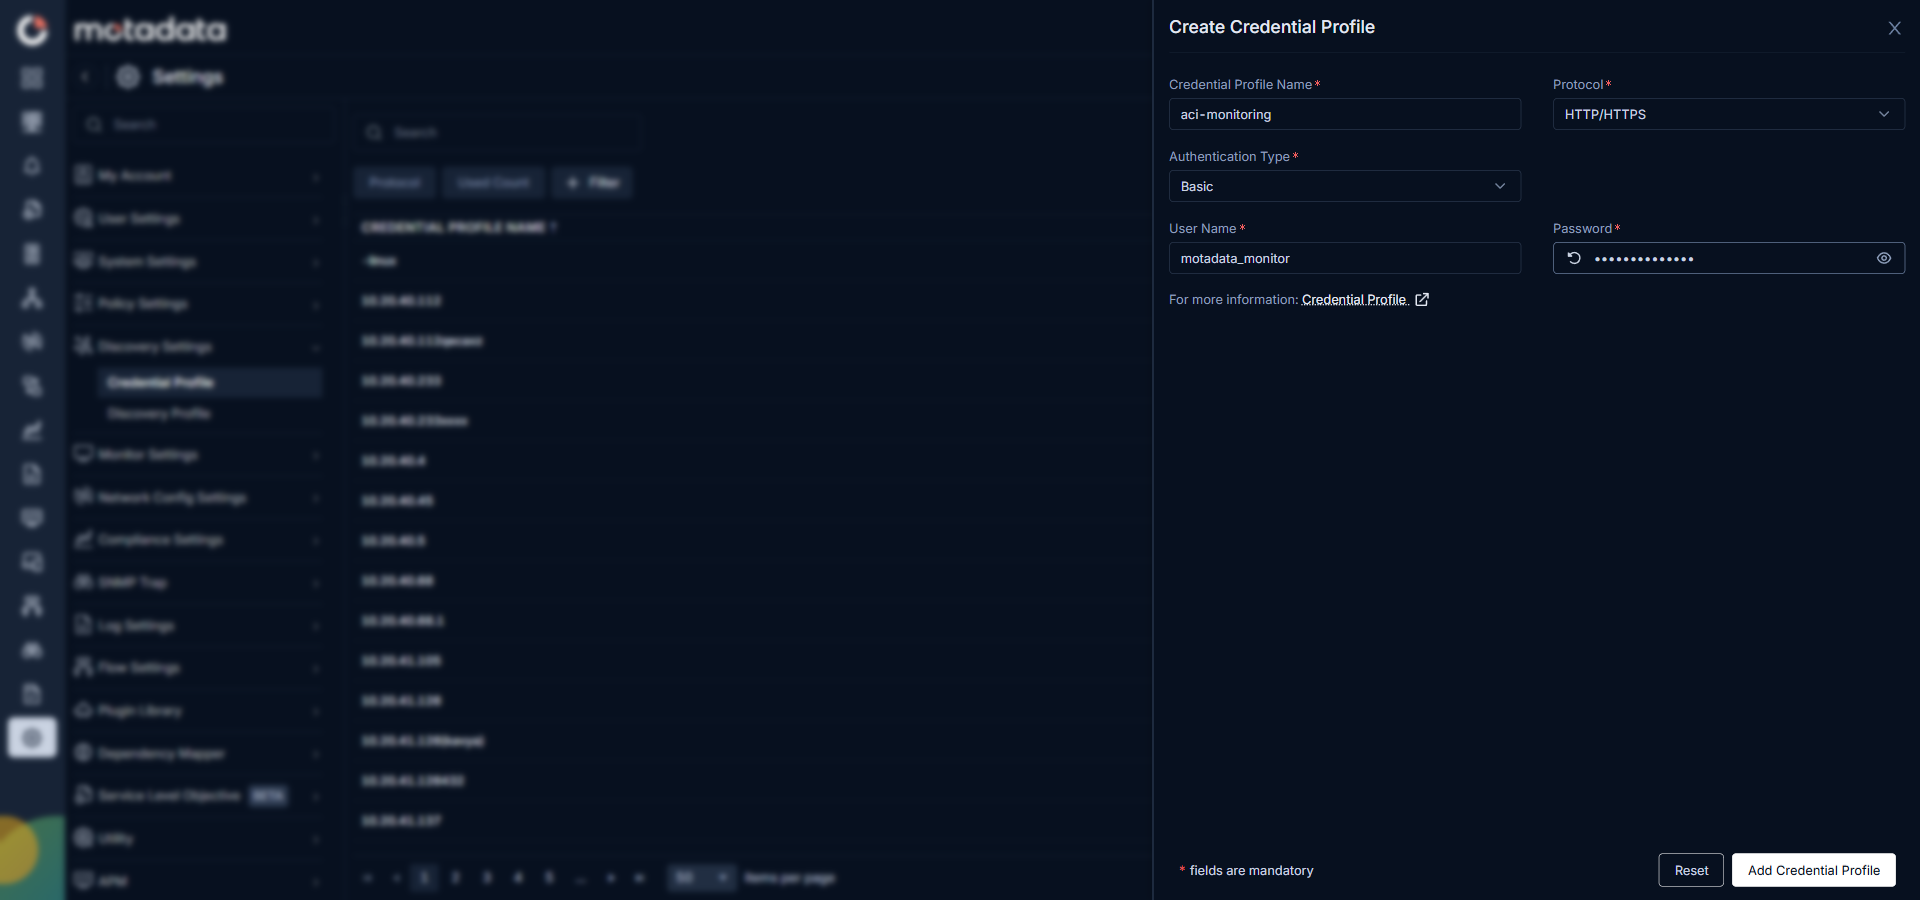
Select Add Credential Profile to save.
2. Create a Discovery Profile
Go to Menu. Select Settings . Select Discovery Settings . Select Discovery Profile. The Discovery Profile screen opens. Select Create Discovery Profile.
The Create Discovery Profile form opens. Select SDN from the sidebar. Select Cisco ACI.
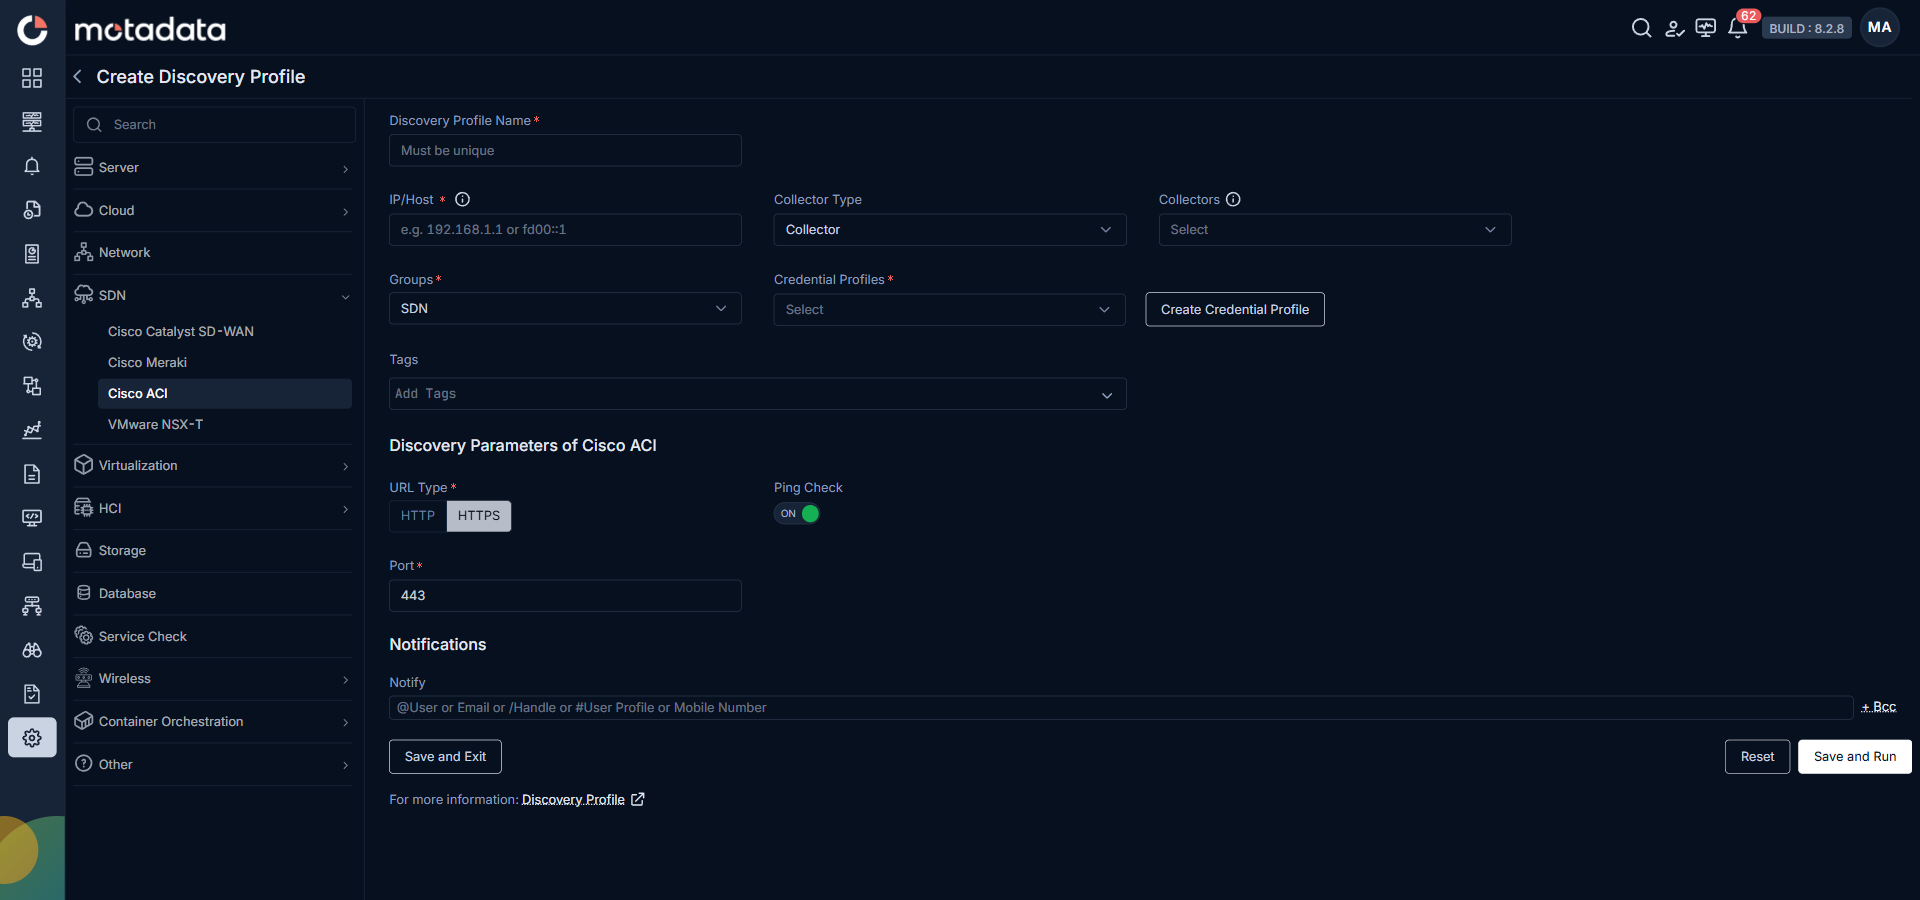
| Field | What to Enter |
|---|---|
| Discovery Profile Name | A unique name to identify this profile. |
| IP / Host | The APIC VIP, node IP, or FQDN of the ACI APIC Controller. |
| Collectors | One or more Collectors for data collection. If you skip this, ObserveOps selects a Collector automatically. |
| Groups | One or more Groups to assign to provisioned monitors. |
| Credential Profile | Select the Cisco ACI credential profile you just created. |
| Tags | Tags to assign to discovered devices. |
| Port | Pre-populated. No change needed. |
| URL Type | Select HTTPS (default) or HTTP. |
| Ping Check | On by default. Toggle off to discover devices that don't respond to ping. |
| Notify Team | Email addresses, handles, or user profiles to notify when discovery completes. |
Select Collectors based on how you want to distribute the monitoring load.
Select Save and Run to save and start discovery immediately. Select Save and Exit to save without running.
3. Provision the Discovered Devices as Monitors
After the discovery run completes, ObserveOps shows all discovered ACI devices. Select the ones you want to add as Monitors.
Select Add Selected Objects to provision the selected devices as monitors. ObserveOps now collects metrics continuously.
To view the monitors, go to Menu. Select Monitor. Select SDN.
For the full list of metrics ObserveOps collects for Cisco ACI, see Cisco ACI supported KPIs.
Adding VMware NSX-T Devices
Discovery creates one NSX-T monitor. Transport nodes, zones, logical objects, firewall sections, interfaces, and processes are collected beneath it.
1. Prerequisites and Credential Profile
To create the credential profile, go to Menu. Select Settings . Select Discovery Settings . Select Credential Profile. Select Create Credential Profile.
Enter the following on the Create Credential Profile form.
| Field | What to Enter |
|---|---|
| Credential Profile Name | A unique name to identify this profile. |
| Protocol | Select HTTP/HTTPS. |
| Authentication Type | Select Basic. |
| Username | The NSX Manager username. |
| Password | The password for that account. |
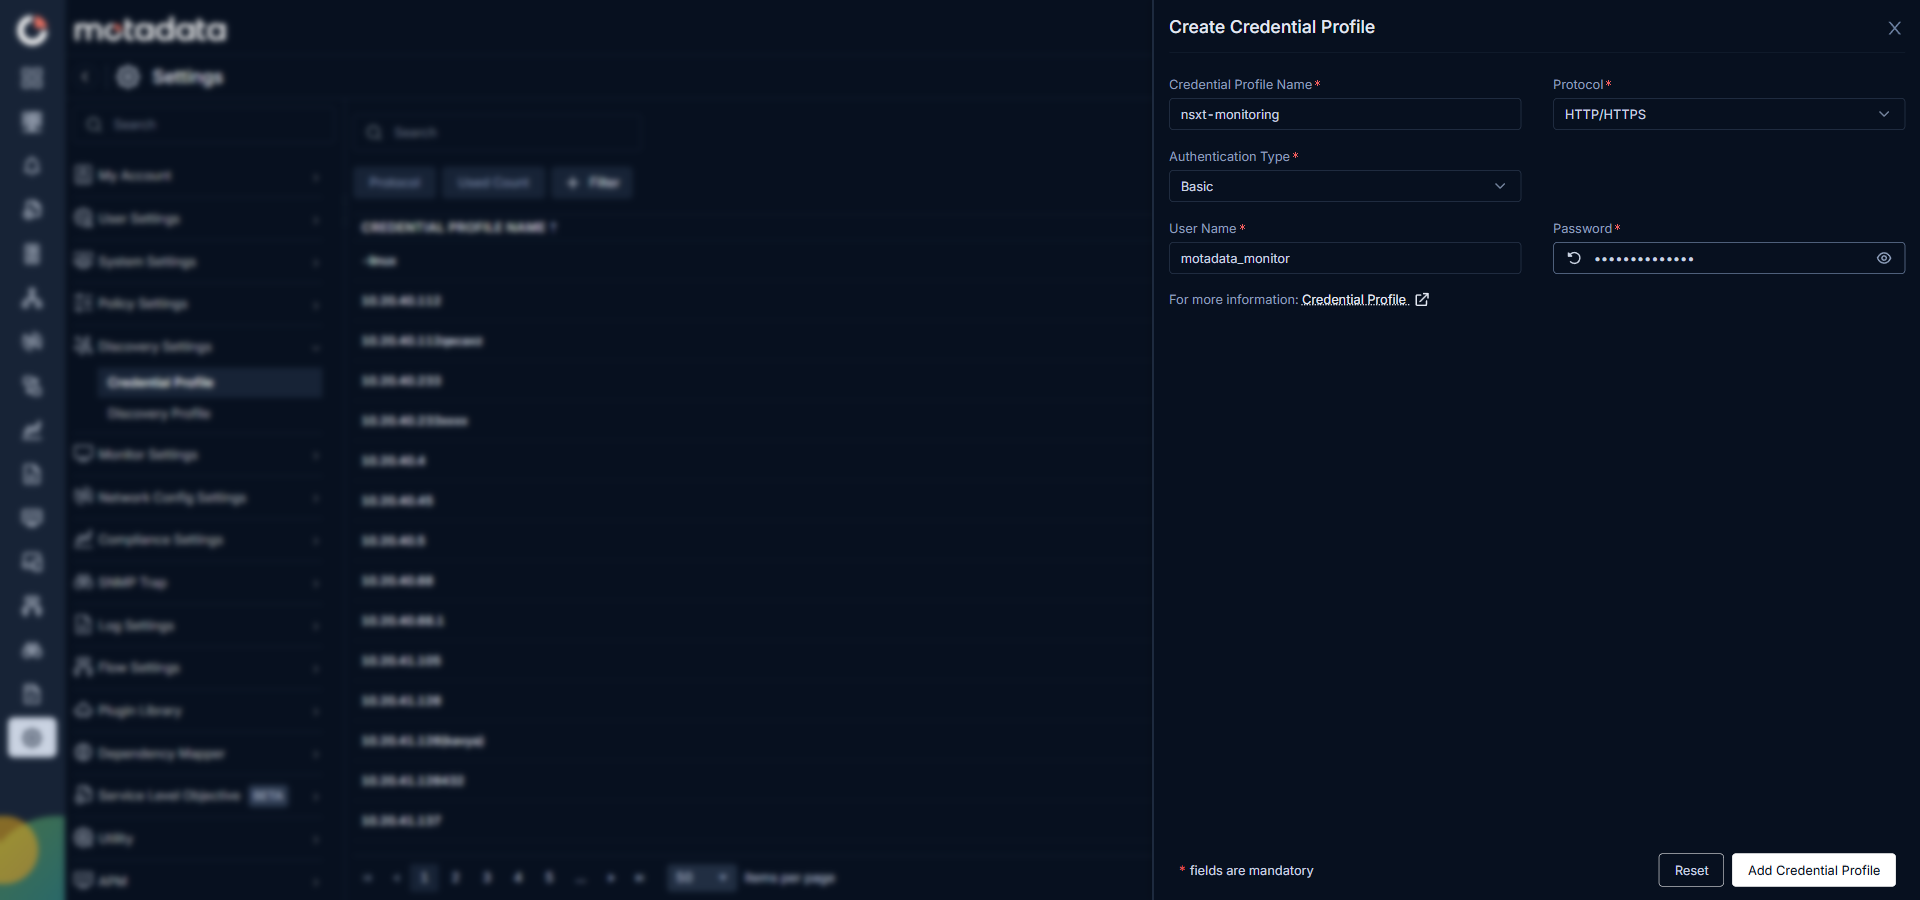
Select Add Credential Profile to save.
2. Create a Discovery Profile
Go to Menu. Select Settings . Select Discovery Settings . Select Discovery Profile. The Discovery Profile screen opens. Select Create Discovery Profile.
The Create Discovery Profile form opens. Select SDN from the sidebar. Select VMware NSX-T.
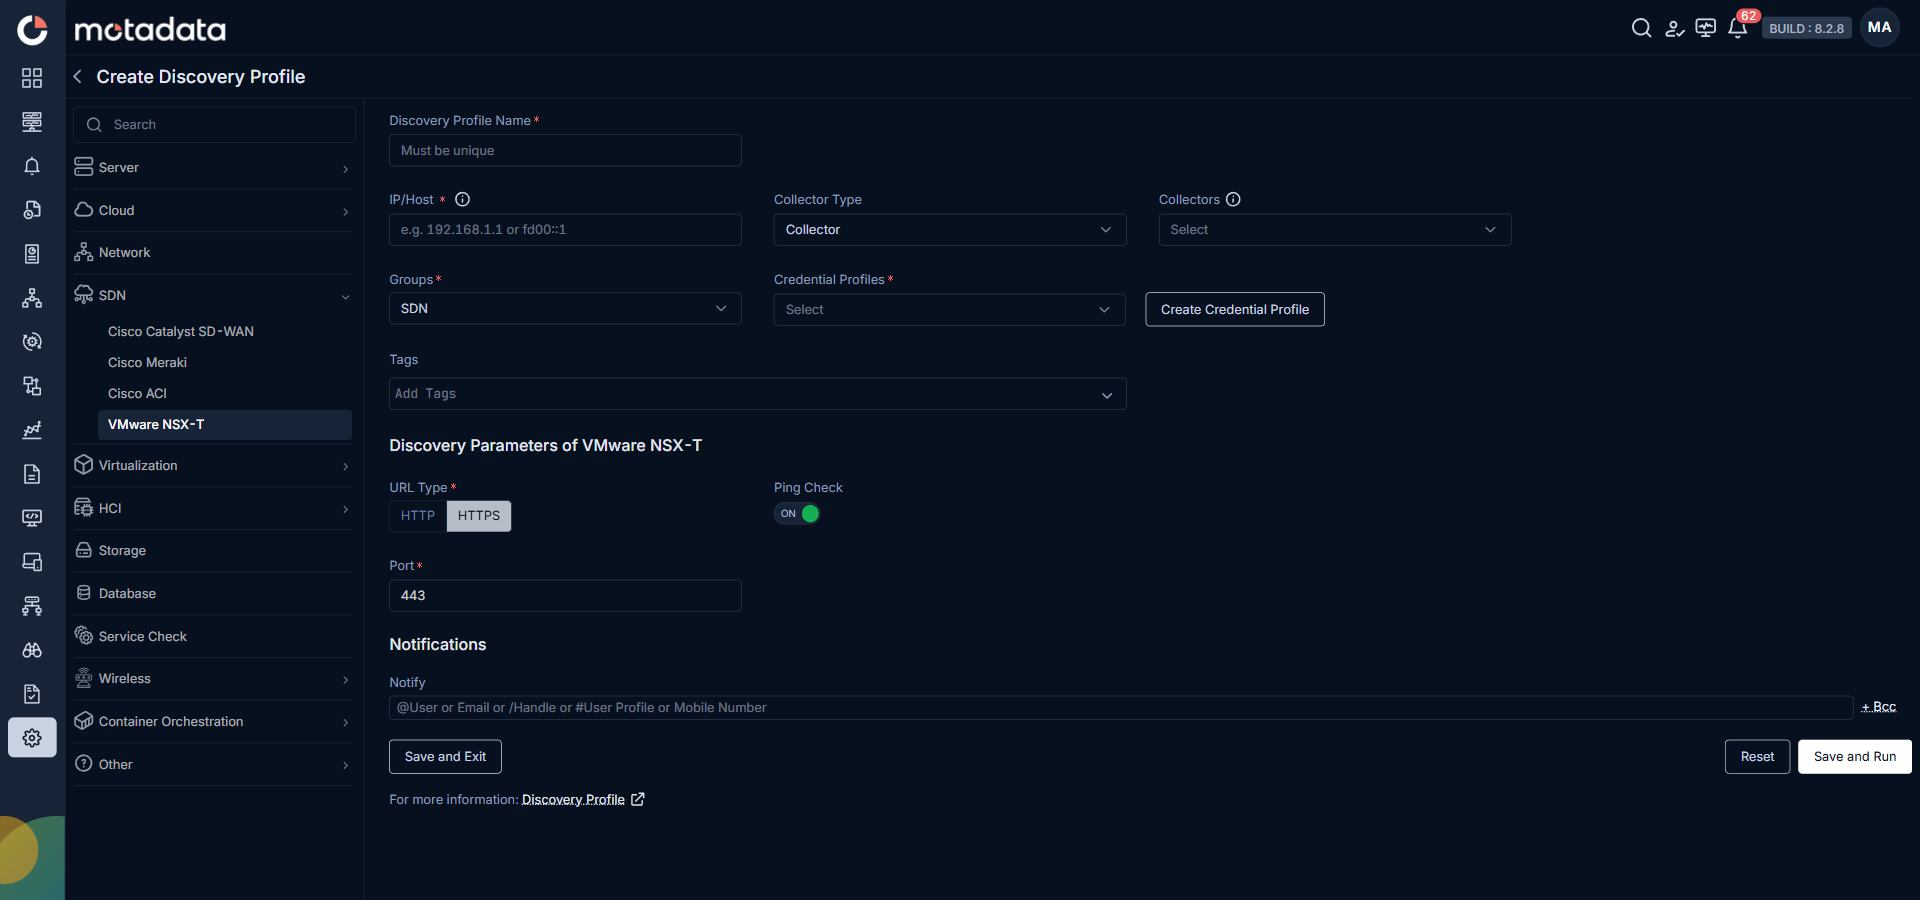
| Field | What to Enter |
|---|---|
| Discovery Profile Name | A unique name to identify this profile. |
| IP / Host | The NSX Manager cluster VIP, node IP, or fully qualified domain name. Use the cluster VIP so monitoring is not tied to one node. |
| Collectors | One or more Collectors for data collection. If you skip this, ObserveOps selects a Collector automatically. |
| Groups | One or more Groups to assign to provisioned monitors |
| Credential Profile | Select the VMware NSX-T credential profile you just created. |
| Tags | Tags to assign to discovered devices. |
| URL Type | Select HTTPS (default) or HTTP. |
| Port | Pre-populated. No change needed. |
| Ping Check | On by default. Toggle off to discover devices that don't respond to ping. |
| Notify Team | Email addresses, handles, or user profiles to notify when discovery completes. |
Select Collectors based on how you want to distribute the monitoring load.
Select Save and Run to save and start discovery immediately. Select Save and Exit to save without running.
3. Provision the Discovered Devices as Monitors
After the discovery run completes, ObserveOps shows all discovered VMware NSX-T devices. Select the ones you want to add as Monitors.
Select Add Selected Objects to provision the selected devices as monitors. ObserveOps now collects metrics continuously.
To view the monitors, go to Menu. Select Monitor. Select SDN.
For the full list of metrics ObserveOps collects for VMware NSX-T, see VMware NSX-T supported KPIs.
Related Topics
- Discovery Profile Overview: how the Discovery Profile screen works and the full set of device categories it supports.
- Credential Profile: create and manage the credentials each SDN discovery profile needs.