11.20.5. Managing a Discovery Probe
The Agentless method uses a Discovery Probe for discovery. Once you create a Probe, you can start Discovering Assets and can generate reports based on the output of a Discovery operation.
New Assets can be added automatically to the CMDB during a Discovery operation and kept up to date by scheduling a process called Polling that retrieves any changes at the source.
Using Scheduling, you can even automate the Discovery process. You can review the discovered Assets before committing them to the CMDB.
11.20.5.1. Run on Demand Discovery
The fastest way to initiate a Discovery is to use the Scan New Assets option in a Probe:
Go to Asset (A Navigation Tab) >> Discovery Probe.
Select a Probe. The Scan New Assets option appears.
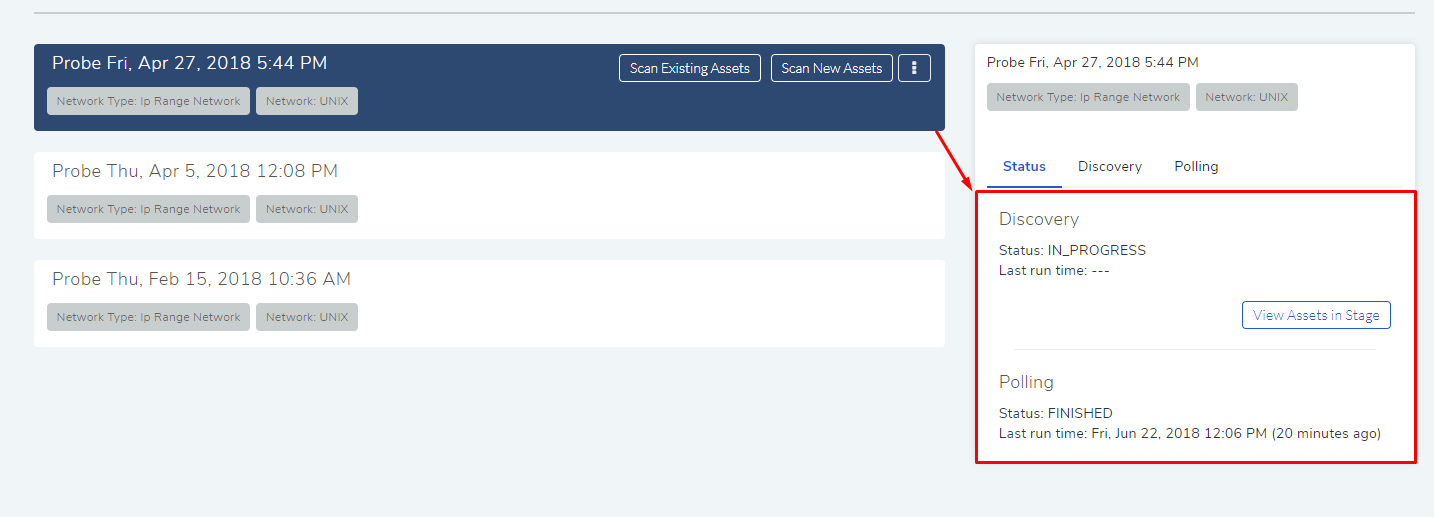
Click on Scan New Assets and it asks whether you want to add the Assets automatically or not. In response, the discovery process begins. The Status changes to FINISHED when done. Along with that it also shows the date and time of completion of the discovery.
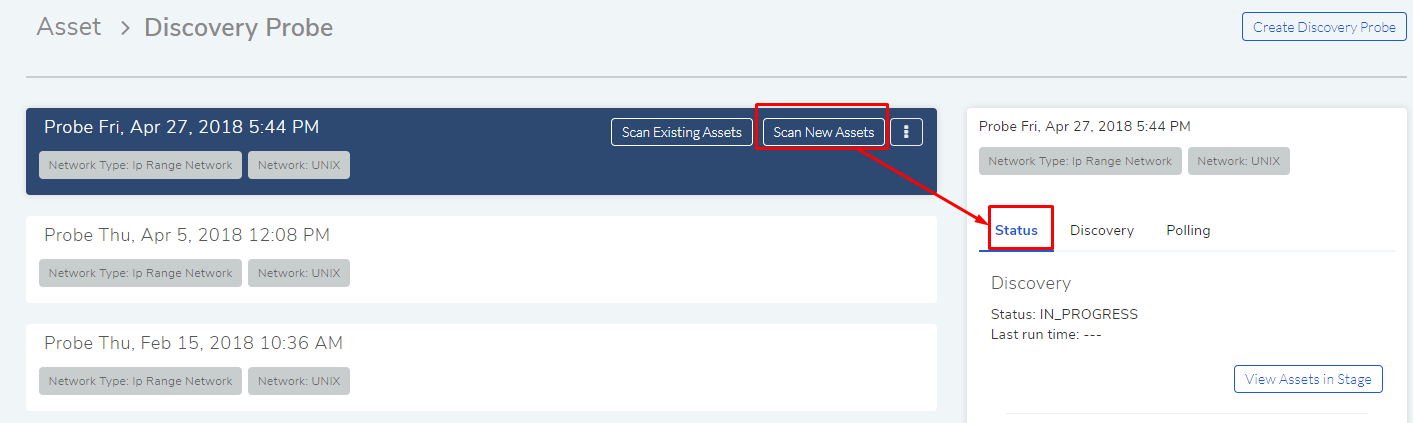
During discovery, you can view the progress under the Discovery tab.
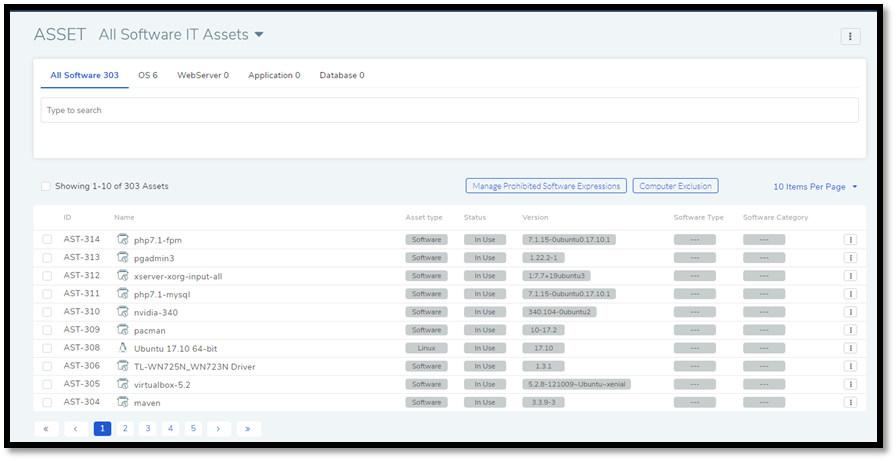
All discovered Assets are added to the Asset List View; there you can view them and can perform other operations. If you did not select automatic addition to the CMDB, then discovered Assets are staged for review; from there you have to commit them to the CMDB. You can view the Assets that are currently staged by clicking on the View Assets in Stage button under the Status tab.
11.20.5.2. Run on Demand Polling
Note
If the Network is set to use DHCP protocol then one has to configure DNS.
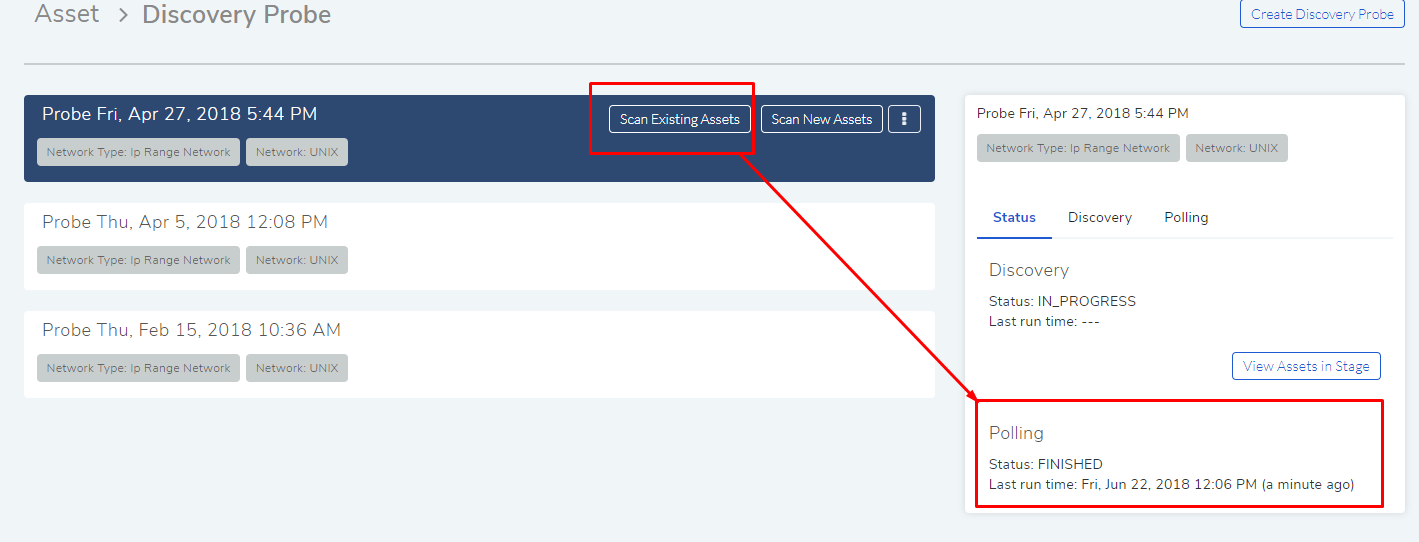
Polling detects any changes made to a discovered Asset at the source and pushes the changes (if any) to the CMDB. This process helps you to keep your CMDB up to date. The fastest way to initiate Polling is to use the Scan Existing Assets option.
Go to Asset (A Navigation Tab) >> Discovery Probe.
Select a Probe. The Scan Existing Assets option appears.
Click on Scan Existing Assets and it asks for confirmation. On a positive response, the polling process begins. The Status changes to FINISHED when done. Along with that it also shows the date and time of completion of the polling.
11.20.5.3. Scheduling
The Probe allows you to perform periodic scans using the Schedule function. It is a powerful feature to automate your Discovery process. You can Schedule both Discovery and Polling.
Scheduling a Discovery:
Note
You need to first create a Probe before you can use scheduling.
Log into the Motadata Dashboard.
Go to Asset (A Navigation Tab) >> Discovery Probe.
Click on a probe. The color changes to dark blue. The Details Pane is visible on the right side of the probe list.
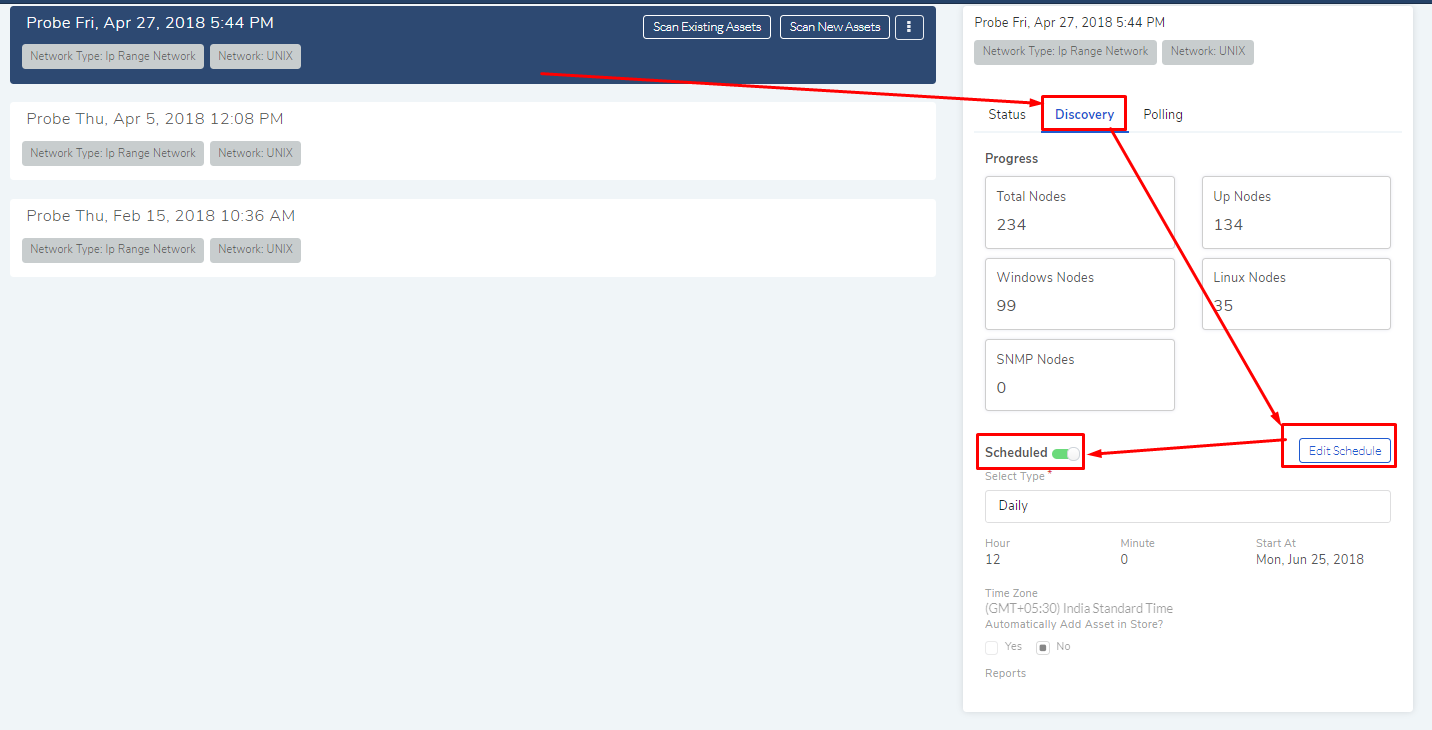
Click on the Discovery tab. You see “No-schedule-created” message if you are scheduling for the first time. Click on Schedule to create one.
Refer
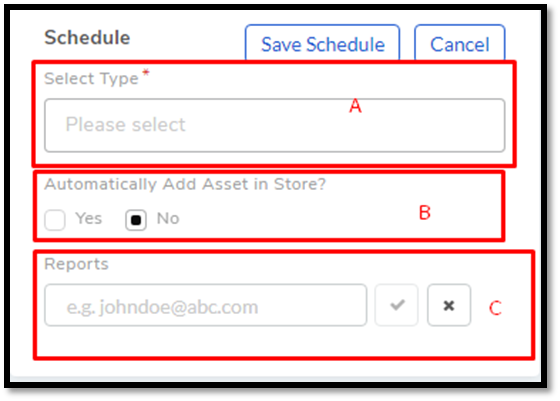
amf-171. There are three fields in Schedule that you need to fill:Field-A talks about the frequency of scheduled Discovery that you want. You get the following options:
Once: Discovery happens only once at a specific date and time.
Daily: The Discovery Schedule activates on a start date & time. After that, the Discovery happens every day at a specified time mentioned in the Hour and Minute field.
Weekly: Discovery happens on a specific day/days of a week at a specified time.
Monthly: Discovery happens in selected month/months of a year on a particular day at a specified time.
The Time Zone is automatically set based on the Time-Zone in the Account Profile. but you can change it.
In Field-B, if you want the discovered Assets directly to be added to the CMDB then select Yes, else No if you want to review the Assets and add them yourself.
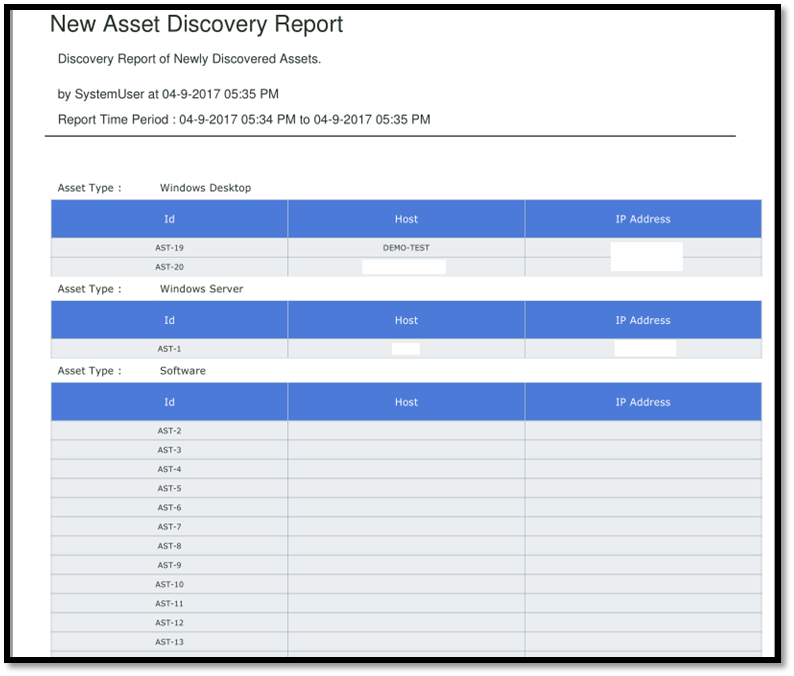
Field-C is where you can enter one or more email addresses to send them discovery reports. After every successful Discovery, the system generates a report detailing about the discovered Assets. You can add as many email addresses you want. The report looks something like this:
Select the options and complete the fields, and hit Save Schedule to start the Schedule.
Scheduling a Polling
The process of scheduling a Polling operation is similar to Discovery except the Automatically Add Asset in Store option is not present in Polling.
The Schedule option can be found in the Polling tab.
11.20.5.4. Editing a Schedule for Discovery and Polling
You can easily edit the parameters of a set Schedule: you can change the frequency, review settings and add/subtract emails.
Go to Asset (A Navigation Tab) >> Discovery Probe.
Select a Probe and from the Glance pane and go to Discovery/Polling >> Edit Schedule.
You can turn on/off a Schedule using the Scheduled toggle.
Make the changes and hit Save Schedule.
11.20.5.5. Editing a Probe
You can edit all the parameters of an existing Probe:
Go to Asset (A Navigation Tab) >> Discovery Probe.
Select the Probe that you want to edit. Action Menu appears next to the option Scan New Assets.
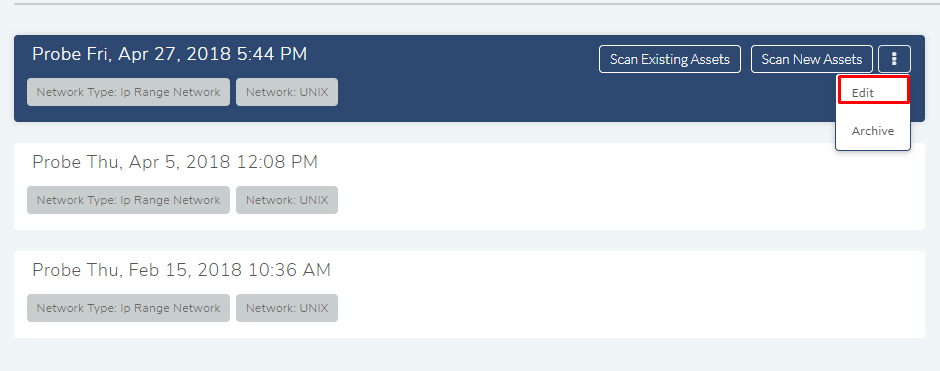
Select Edit from the Action Menu. The Update Discovery Probe dialog box appears. The dialog box has the same fields as the Create Discovery Probe dialog box.
Change the parameters that you want and hit Update.
11.20.5.6. Deleting a Probe
Go to Asset (A Navigation Tab) >> Discovery Probe.
Select the Probe that you want to delete. Action Menu appears next to the option Scan New Assets.
Click on Archive from the Action Menu. A confirmation box appears and clicking on Yes deletes the Probe.
11.20.5.7. Status/Progress of a Probe
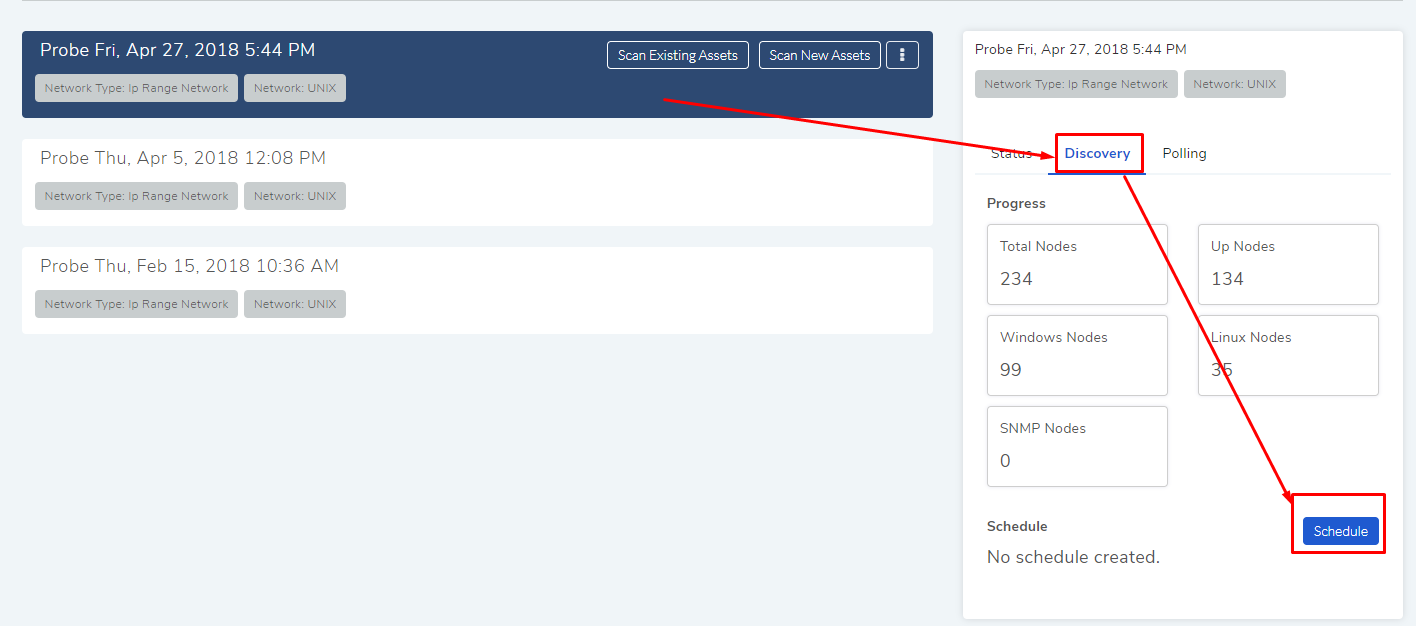
When you do a Discovery or a Polling operation, the Status tab is updated with the operation’s progress and the date and time of completion.
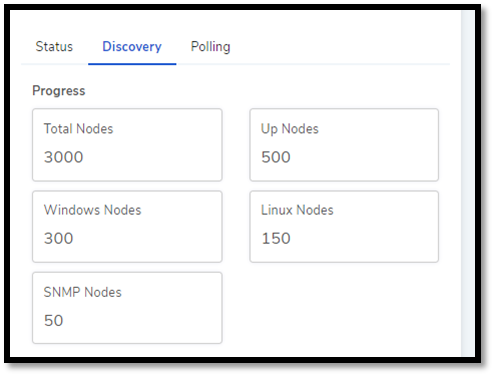
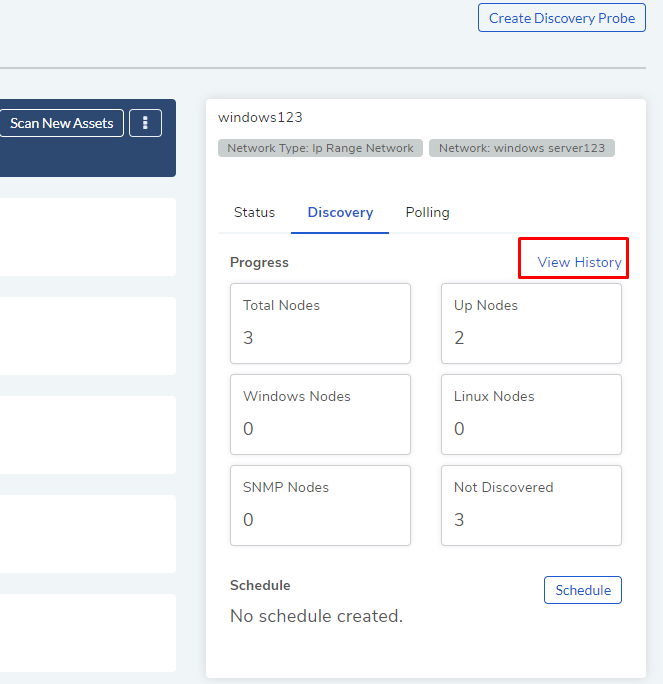
During a discovery the following things are shown as part of the progress status in the Discovery tab:
Total Nodes: Total number of node in the network.
Up Nodes: Total number of nodes responding to a ping.
Windows Nodes: Out of total Up Nodes how many are Windows nodes.
Ubuntu Linux Nodes: Out of total Up Nodes how many are Ubuntu Linux nodes.
SNMP Nodes: Out of total Up Nodes how many are SNMP nodes.
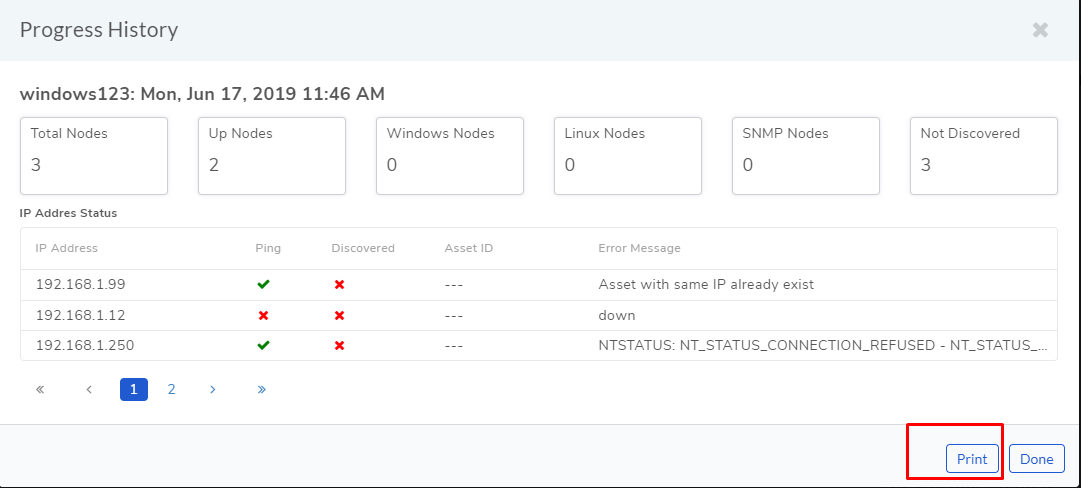
11.20.5.8. View Discovery Probe History
Status of past discoveries can be viewed under the discovery tab.
Click on the View History.
The progress history window opens. Here you can view the process status of each discovery and the IP addresses of the machines, and their ping status, discovery status, and asset ID.
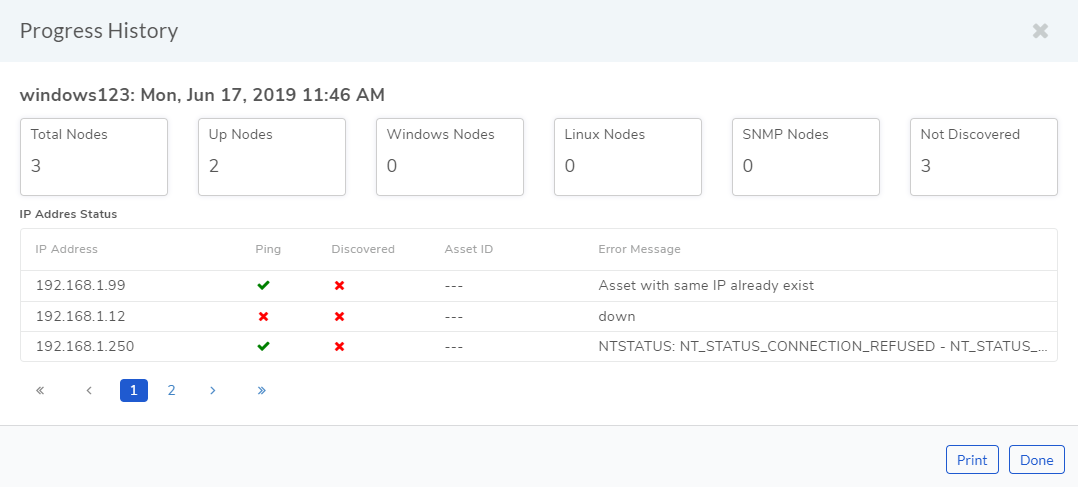
You can browse through all the discoveries using the pagination button. Each page shows the history of a single discovery with date-time stamp.
11.20.5.8.1. Print Discovery History
11.20.5.9. Reviewing Discovered Assets
The Status tab houses a button called View Assets in Stage. If you have scheduled a Discovery with the option, Automatically Add Asset in Store as Yes, then all discoveries are staged in the Asset in Review page which is only accessible by the View Assets in Stage button.
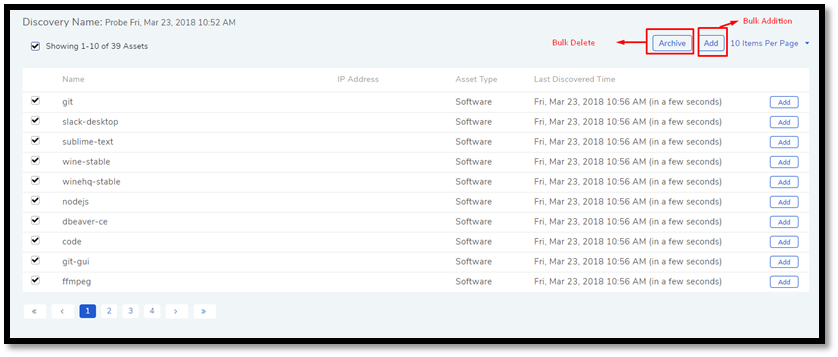
Once Assets are staged, you can manually add every Asset to the List
View using the Add button adjacent to every Asset, or you can select
them all and add them at once using the bulk add feature (amf-177).
You can also delete the items in bulk.