Topology Custom View in ObserveOps
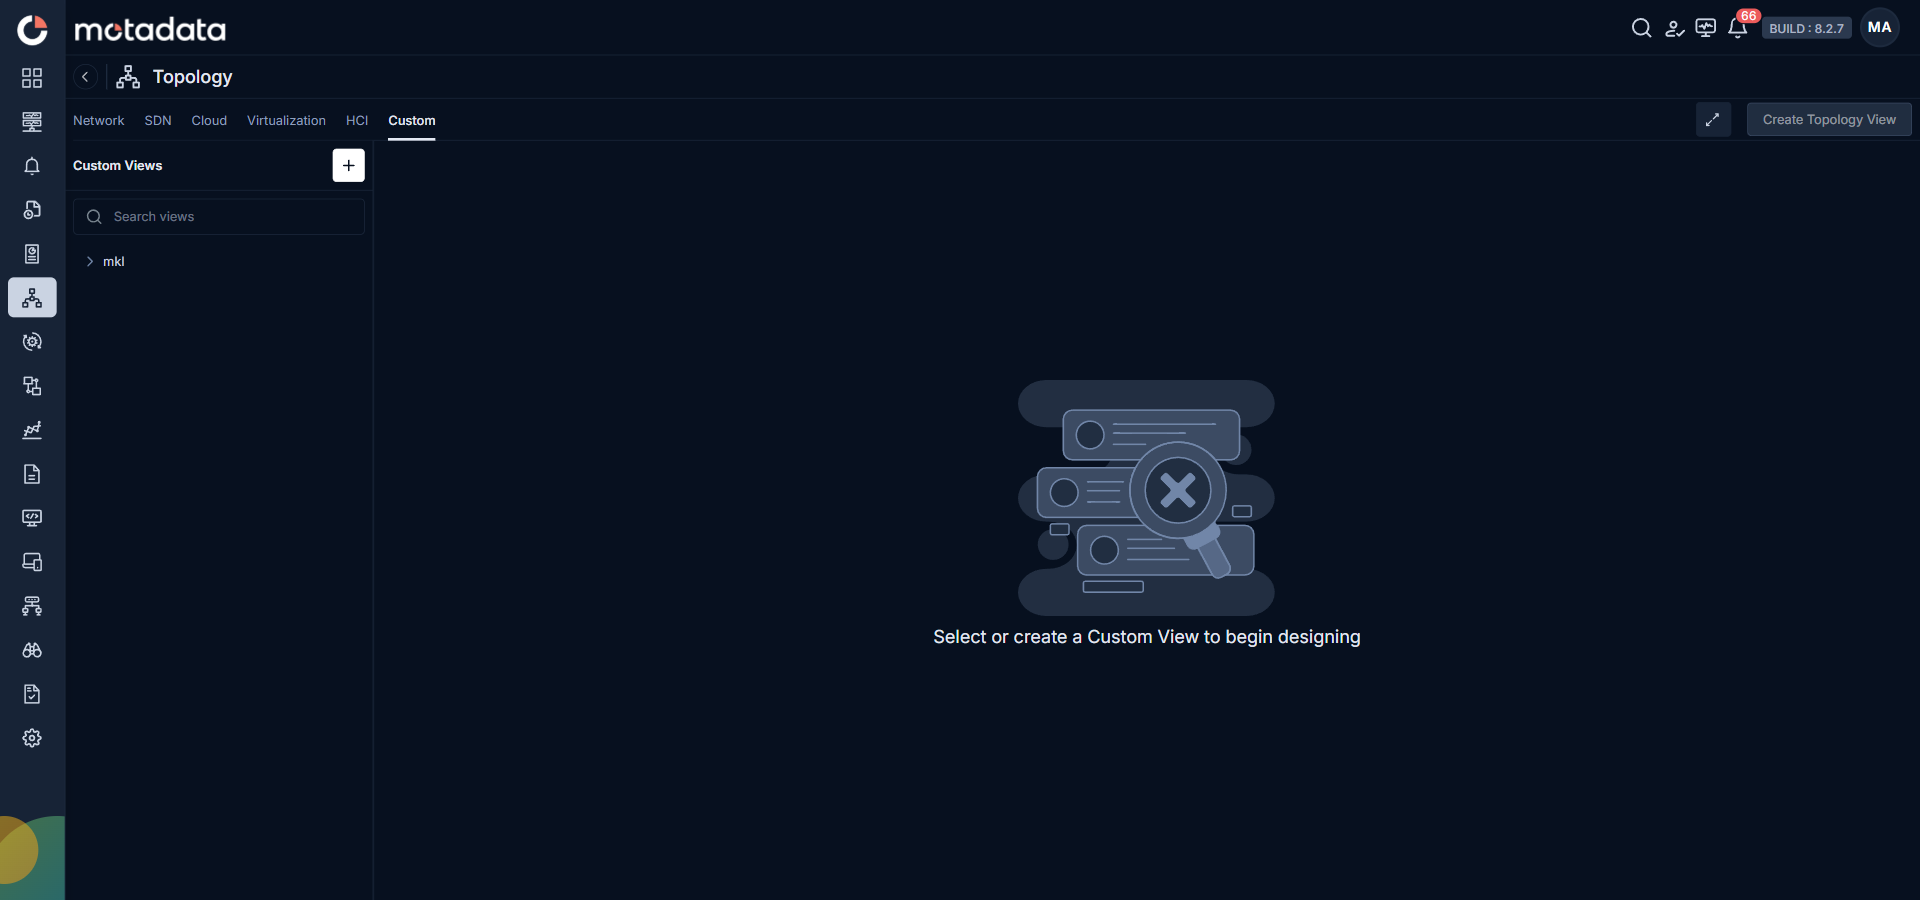
The Custom tab in ObserveOps (formerly known as AIOps) lets you build a personalized topology canvas starting from any monitored device you choose. You pick a root monitor, ObserveOps builds the topology from that device outward, and the view is saved in the sidebar so you can return to it anytime. Every node reflects its live health state each time you open the view.
Prerequisites
- You must hold the Admin or Operator role to create or edit Custom Views.
- The device you want to use as a root monitor must already be monitored in ObserveOps.
How Custom View Works
When you create a Custom View, you select one device as the root monitor. ObserveOps builds the topology map outward from that device, showing all the devices connected to it through discovery protocols. The view is saved in the Custom Views sidebar panel under the name of the root monitor. When you reopen the view, ObserveOps loads the layout and overlays current health data from the monitoring engine on top. The health status updates in real time.
This means a node that was green when you first created the view may be red when you reopen it — because the health reflects what is happening now, not when the view was saved.
The Custom Views Sidebar
The left panel shows all your saved views. Click any view name to load it on the canvas. Hover over a view name to reveal the Delete icon.
The + button at the top of the sidebar opens the Create Custom View panel.
Creating a Custom View
Step 1: Open the Create Custom View Panel
- Go to Topology from the main navigation menu.
- Select the Custom tab.
- Click the + button at the top of the Custom Views sidebar.
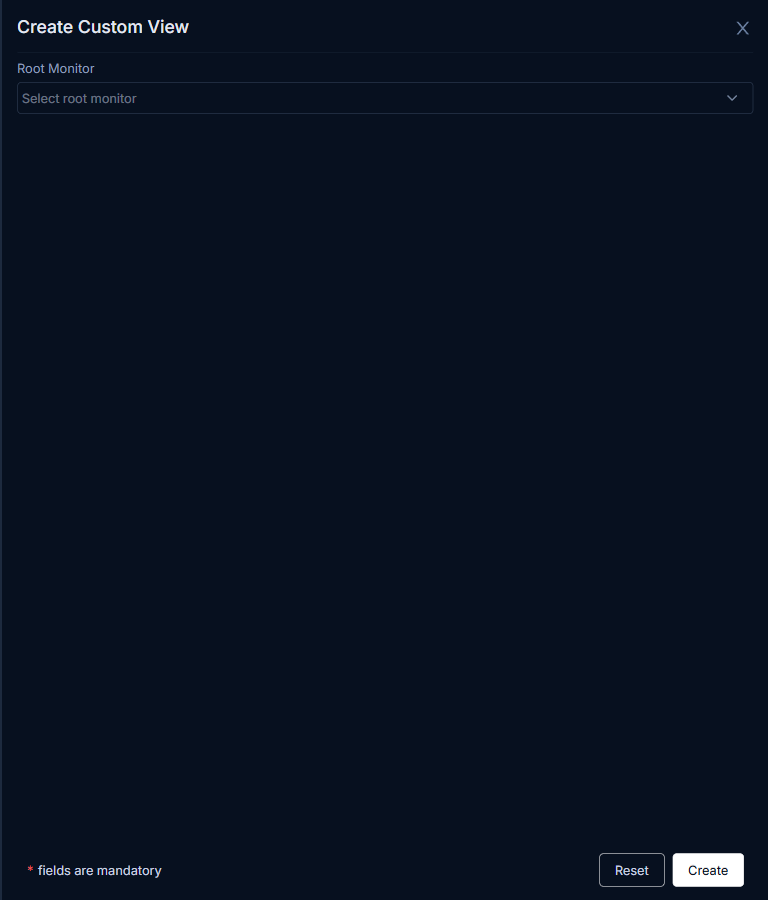
Step 2: Select a Root Monitor
- Click the Root Monitor dropdown and select the device you want to use as the starting point for the topology.
- Click Create to confirm.
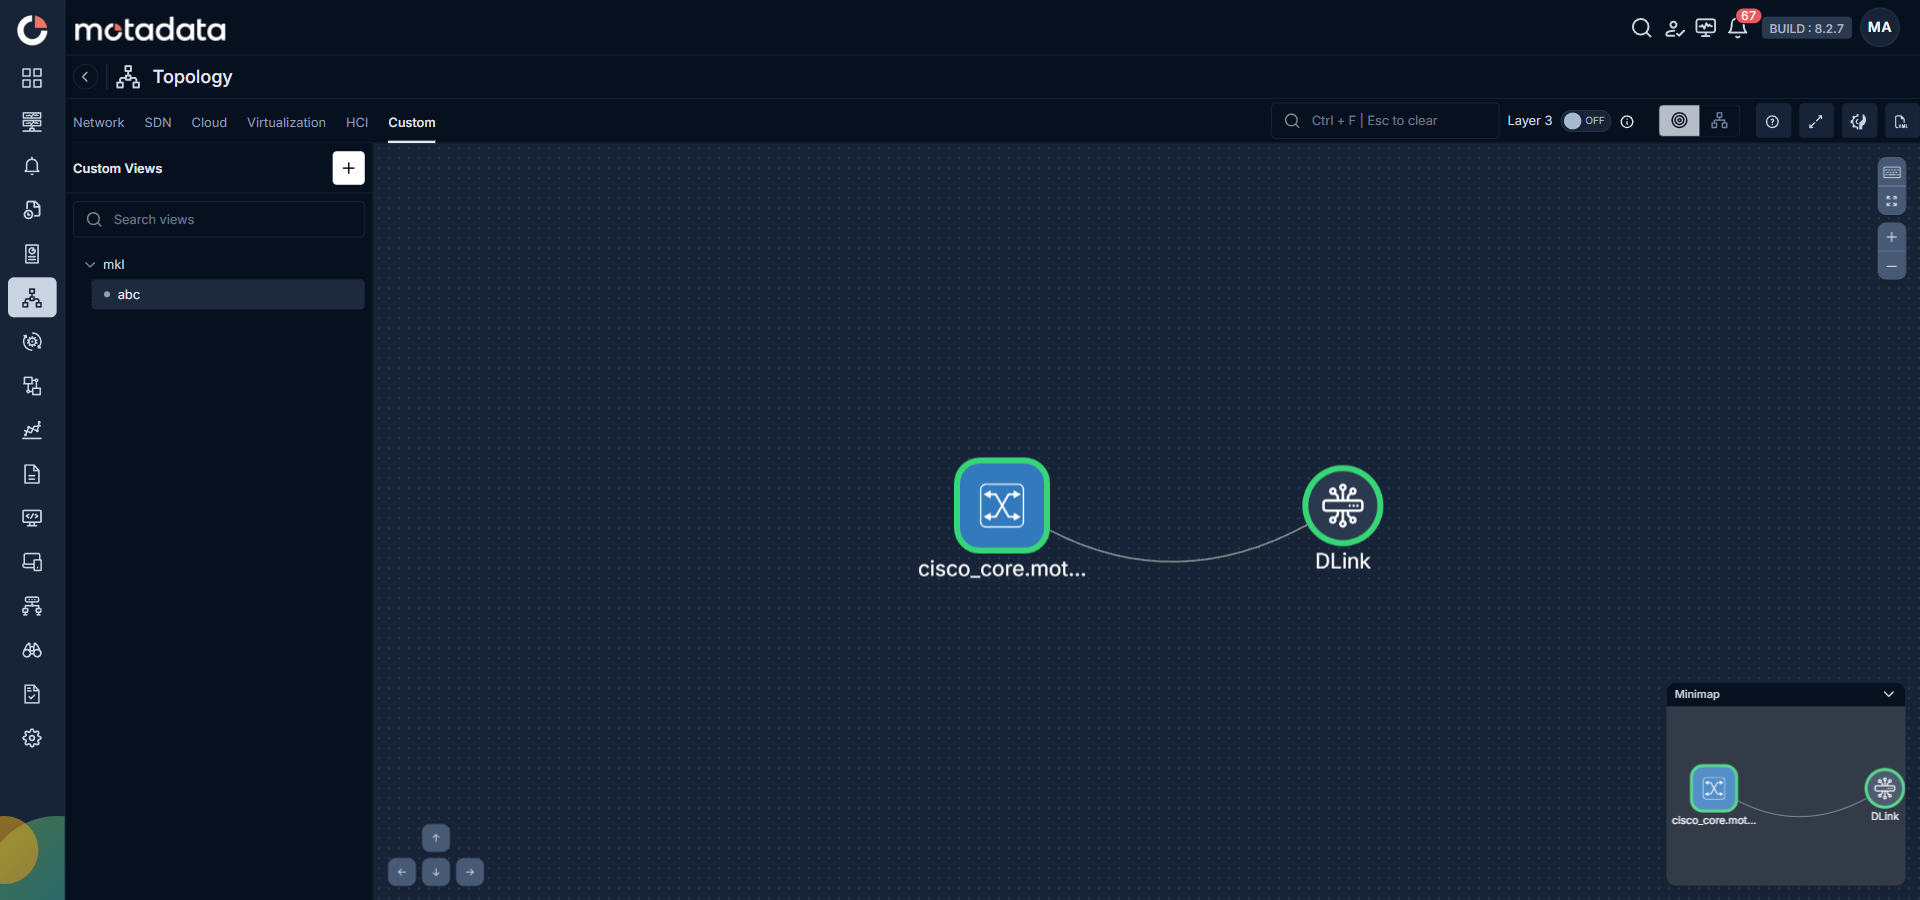
ObserveOps creates the view and opens the topology canvas built from that root monitor outward.
Step 3: Arrange the Layout
Click and drag any node to position it where you want on the canvas. Arrange nodes to reflect the relationships or groupings that are meaningful to your team.
Use the scroll wheel to zoom in and out. Click and drag on an empty canvas area to pan the view.
Step 4: Save the Layout
After arranging the nodes, click Save in the toolbar. ObserveOps saves the current node positions, zoom level, and pan position.
If you close the browser or navigate away before clicking Save, your node positions are not saved. Always wait for the save confirmation before leaving the page.
Canvas Toolbar
The toolbar appears above the canvas when a Custom View is loaded.
| Button | What It Does |
|---|---|
| Full View | Switches to a force-directed layout where nodes arrange themselves based on their connections |
| Tree View | Switches to a hierarchical tree layout showing parent-child relationships |
| Toggle Fullscreen | Expands the canvas to fill the entire browser window |
| Export As XML | Downloads the current view as an XML file |
Canvas with Nodes
Node Health States
Every node in a Custom View reflects its current health state with a color and icon:
| Color | State | What It Means |
|---|---|---|
| Green | Clear | All monitors for this device are healthy |
| Red | Critical | One or more critical monitors have failed |
| Orange | Warning | At least one monitor is in a warning state |
| Gray / Unknown | Unknown | Status data is not currently available |
Deleting a Custom View
- Open the Custom tab.
- Hover over the view name in the sidebar.
- Click the Delete icon that appears next to the view name.
- Confirm the deletion in the dialog.
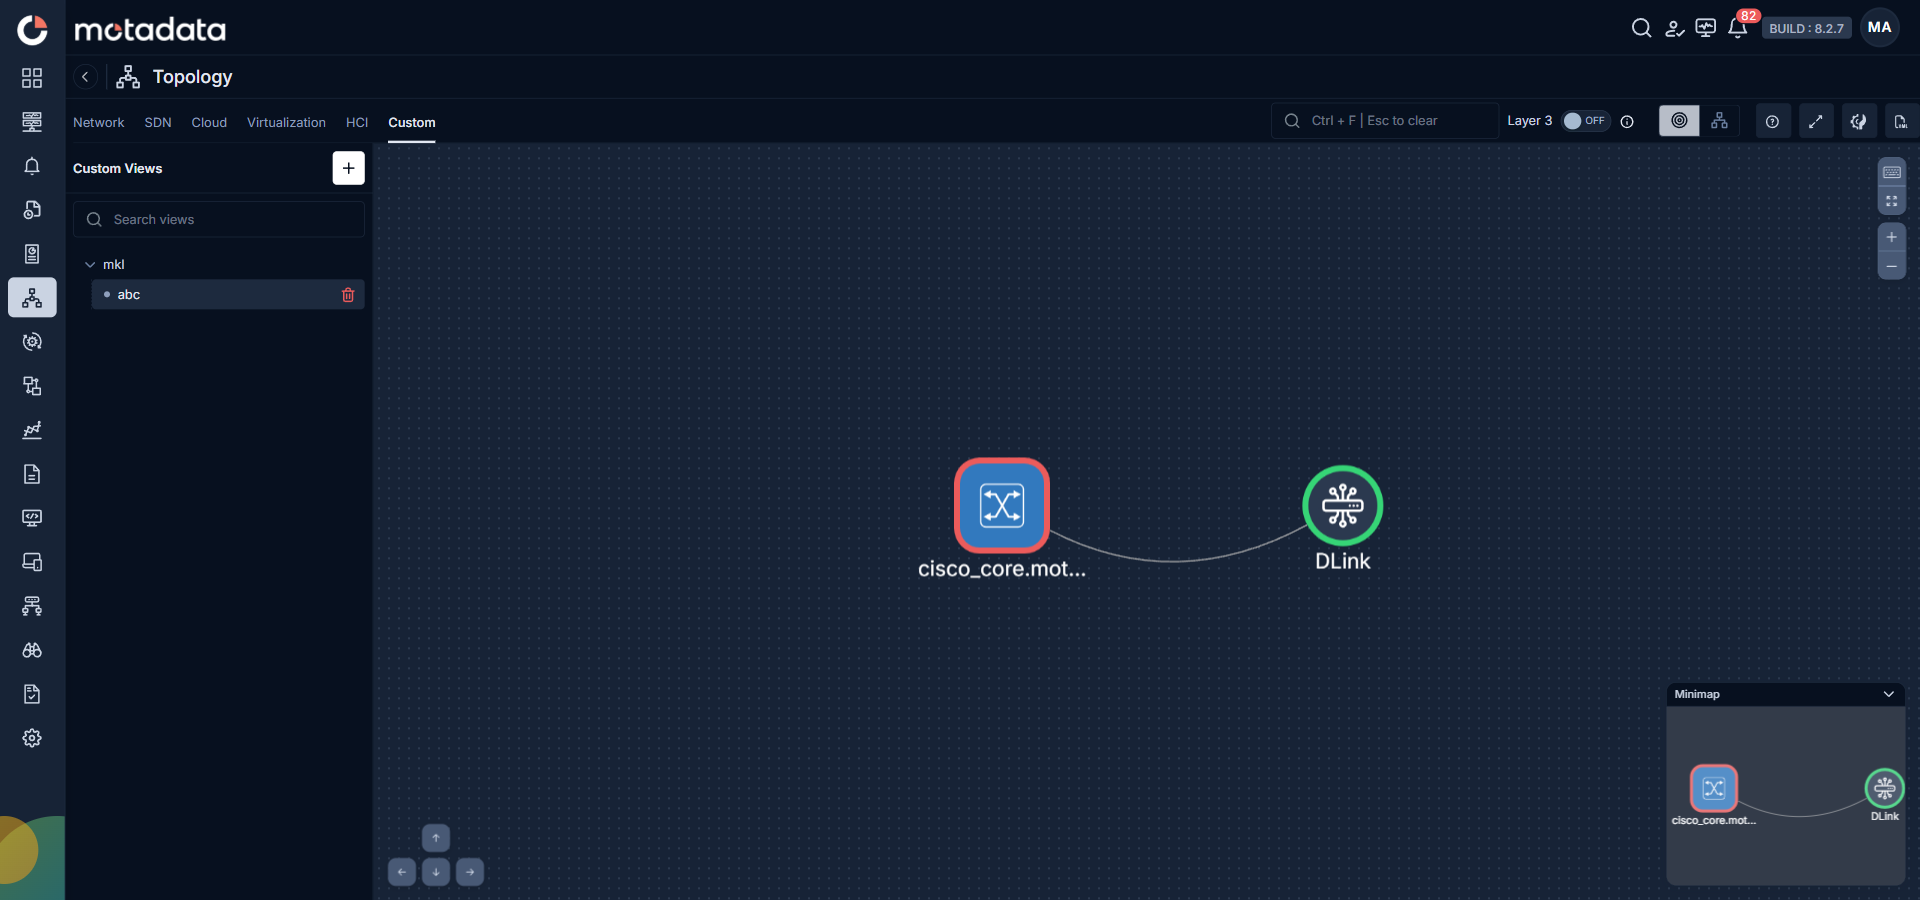
Deleting a Custom View is permanent. ObserveOps does not retain deleted views.