Adding WAN Link for Monitoring
ObserveOps (formerly known as AIOps) monitors WAN Link statistics by connecting to IP SLA-supported network devices. You create a credential profile, then add the WAN Link directly to an existing network monitor. Once added, ObserveOps continuously collects WAN performance metrics and generates alerts based on what it finds.
Prerequisites
SNMP Protocol
- The device must support IP SLA.
- Port
161must be open on the device. - You need the Write Community and Read Community strings before creating the credential profile. The Write Community field must not be blank or the IP SLA operation will fail.
SSH Protocol
- SSH must be enabled on the network device.
- Port
22must be open and accessible from the ObserveOps server. - You need the Username and Password, or the SSH Key and Passphrase, for the device.
- Cisco IP SLA
Adding a Cisco IP SLA Device
1. Create a Credential Profile
Go to Menu. Select Settings  . Select Discovery Settings
  . Select Credential Profile. The Credential Profile screen opens. Select Create Credential Profile.
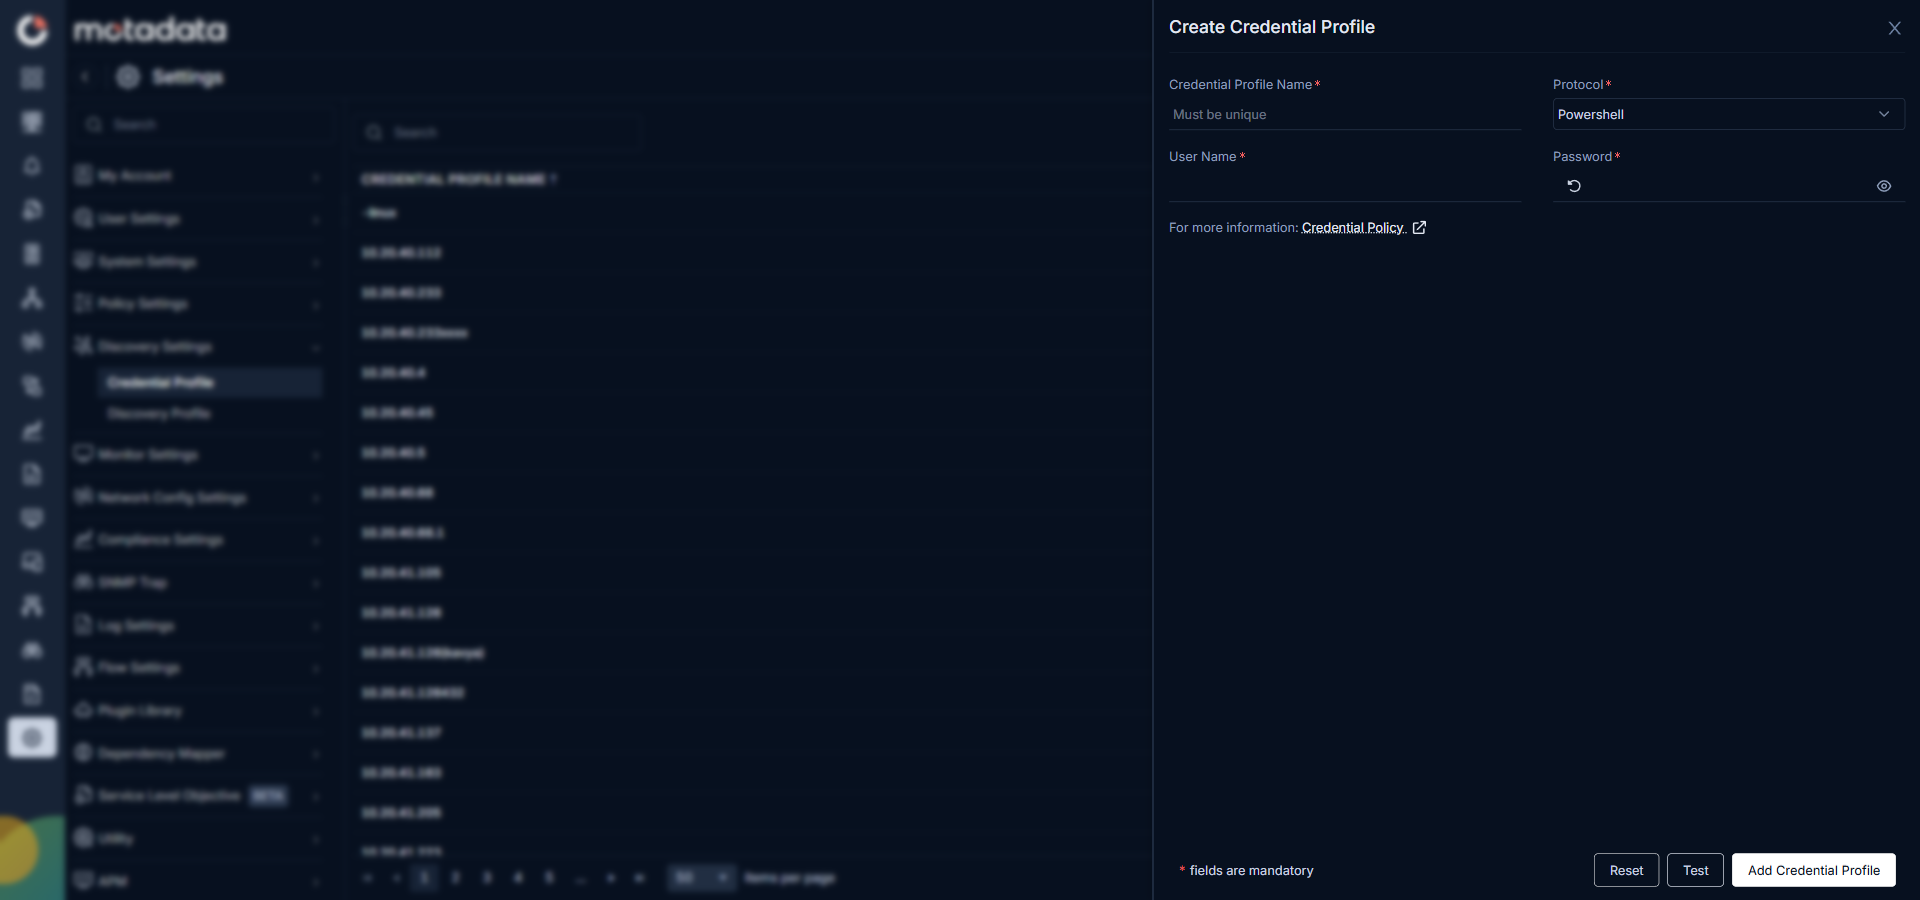
The Create Credential Profile form opens.
| Field | What to Enter |
|---|---|
| Credential Profile Name | A unique name to identify this profile |
| Protocol | Select SNMP V1/V2c or SNMP V3 based on your device configuration. - For SNMP V1/V2c: enter the Version, Read Community, and Write Community strings. - For SNMP V3: enter the Security User Name and Security Level. |
The Write Community field must not be blank. Leaving it empty causes the IP SLA operation to fail.
Select Test to verify the credentials connect to the device. Select Reset to clear all fields. Select Add Credential Profile to save.
Creating an SSH Credential Profile
If you want to monitor WAN Links using SSH, create a second credential profile with SSH as the protocol.
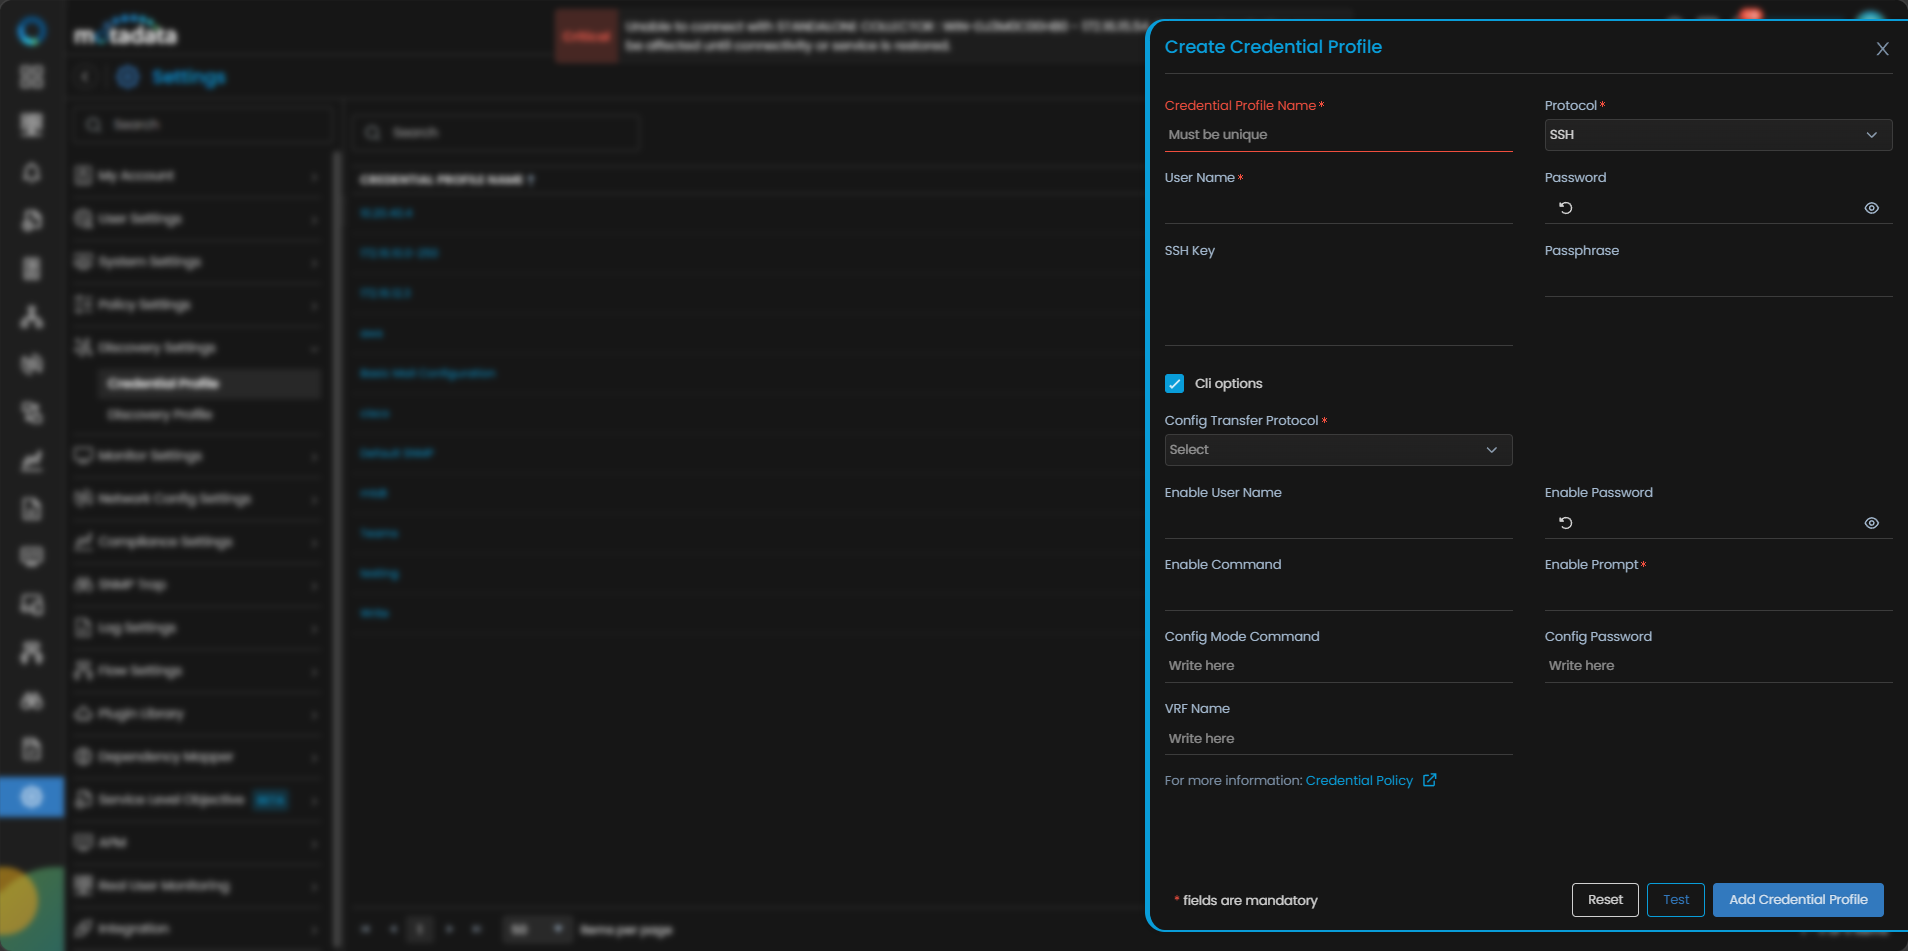
| Field | What to Enter |
|---|---|
| Credential Profile Name | A unique name to identify this profile |
| Protocol | Select SSH |
| Username | The network device username |
| Password | The password for that account |
| SSH Key and Passphrase | The SSH private key and passphrase if using key-based authentication |
| CLI Options | Optional. Select to configure CLI-level access settings: - Config Transfer Protocol: select the protocol for configuration file transfer. - Enable User Name: the username to enter enable mode. - Enable Password: the password for enable mode. - Enable Command: the command to enter enable mode (for example, - Enable Prompt: the prompt string shown when the device enters enable mode. - Config Mode Command: the command to enter configuration mode. - Config Password: the password to enter configuration mode, if required. - VRF Name: the VRF name associated with the device, if applicable. |
Select Test to verify the credentials. Select Reset to clear all fields. Select Add Credential Profile to save.
2. Add WAN Link
The WAN Link must be associated with an existing network monitor. You add it directly from that monitor, not through a discovery profile.
Go to Menu. Select Monitor. Select Network. Open the network monitor for the device you want to monitor. Select the WAN Link button in the top-right corner.
The Add WAN Link screen opens. Select the protocol to use: SNMP (default) or SSH.
- SNMP
- SSH
Single WAN Link Configuration is selected by default.
- Single WAN Link Configuration
- Bulk WAN Link Configuration
| Field | What to Enter |
|---|---|
| Credential Profile | Select the SNMP credential profile you just created |
| WAN Probe | Select the probe type for the WAN link measurement: ICMP Echo: Measures end-to-end response time between a Cisco router and a destination device. Response time is the gap between sending an ICMP Echo request and receiving the reply. ICMP Jitter: Uses ICMP Timestamp messages to calculate jitter, packet loss, RTT, and latency in both directions. Useful for detecting delay variation between packets. ICMP Path Echo: Monitors hop-by-hop response time using Traceroute alongside end-to-end response time. Helps you analyze ICMP performance across each hop in the path. |
| Internet Service Provider | The name of the destination ISP. Helps differentiate WAN Links from the same source router. |
| Source Interface | The interface on the source device to use for the link. If you skip this, ObserveOps uses the default IP, which can cause unexpected results on devices with multiple interfaces. |
| Source Router Location | The city, office, or geo-location of the source router. Shown on the monitor screen to help you identify where the device is. |
| Destination IP | The IP address of the destination device |
| Destination Router Location | The location of the destination device |
| Payload | The size of the ping packet exchanged between source and destination |
| Type of Service | The IP SLA operation type. Default is 30 for ICMP operations. |
| Frequency | The interval in milliseconds between consecutive pings |
| Timeout | How long ObserveOps waits after a failed ping before marking the destination as down |
| Field | What to Enter |
|---|---|
| Credential Profile | Select the SNMP credential profile you just created |
| CSV | Upload a CSV file containing multiple WAN Links. Use the sample CSV file in this field as a formatting guide. |
| Payload | The size of the ping packet exchanged between source and destination |
| Type of Service | The IP SLA operation type. Default is 30 for ICMP operations. |
| Frequency | The interval in milliseconds between consecutive pings |
| Timeout | How long ObserveOps waits after a failed ping before marking the destination as down |
Single WAN Link Configuration is selected by default.
- Single WAN Link Configuration
- Bulk WAN Link Configuration
| Field | What to Enter |
|---|---|
| Credential Profile | Select the SSH credential profile you just created |
| WAN Probe | Select the probe type for the WAN link measurement: ICMP Echo: Measures end-to-end response time between a Cisco router and a destination device. Response time is the gap between sending an ICMP Echo request and receiving the reply. ICMP Path Jitter: Measures jitter and delay variation at each hop across the network path using ICMP probes. Helps identify unstable segments by comparing delay differences between successive packets at every intermediate node. ICMP Path Echo: Monitors hop-by-hop response time using Traceroute alongside end-to-end response time. Helps you analyze ICMP performance across each hop in the path. |
| Internet Service Provider | The name of the destination ISP. Helps differentiate WAN Links from the same source router. |
| Source Interface | The interface on the source device to use for the link. If you skip this, ObserveOps uses the default IP, which can cause unexpected results on devices with multiple interfaces. |
| Source Router Location | The city, office, or geo-location of the source router. Shown on the monitor screen to help you identify where the device is. |
| Destination IP | The IP address of the destination device |
| Destination Router Location | The location of the destination device |
| Payload | The size of the ping packet exchanged between source and destination |
| Type of Service | The IP SLA operation type. Default is 30 for ICMP operations. |
| Frequency | The interval in milliseconds between consecutive pings |
| Timeout | How long ObserveOps waits after a failed ping before marking the destination as down |
| Field | What to Enter |
|---|---|
| Credential Profile | Select the SSH credential profile you just created |
| CSV | Upload a CSV file containing multiple WAN Links. Use the sample CSV file in this field as a formatting guide. |
| Payload | The size of the ping packet exchanged between source and destination |
| Type of Service | The IP SLA operation type. Default is 30 for ICMP operations. |
| Frequency | The interval in milliseconds between consecutive pings |
| Timeout | How long ObserveOps waits after a failed ping before marking the destination as down |
Select Add WAN Link to save the configuration and start discovery.
3. Provision Discovered WAN Links
After the discovery run completes, ObserveOps shows all available WAN Links. Select the ones you want to add as Monitors.
Select Add Selected Objects to provision the selected links as monitors. ObserveOps now collects WAN metrics continuously.
To view the monitors, go to Menu. Select Monitor. Select WAN Link.