Adding Virtualization Devices for Monitoring
ObserveOps (formerly known as AIOps) monitors virtualization environments by discovering hypervisors, clusters, and virtual machines through a credential profile and provisioning them as monitors. Once provisioned, ObserveOps continuously collects performance metrics and generates alerts based on what it finds. You can customize Monitor Settings for each monitor, including polling intervals, thresholds, and alert notifications.
Virtualization Solutions Supported
| Virtualization Solution |
|---|
| Citrix Xen |
| Citrix Xen Cluster |
| ESXi |
| vCenter |
| Hyper-V |
| Hyper-V Cluster |
| Proxmox VE Node |
| Proxmox VE Cluster |
| KVM |
- Citrix Xen
- Citrix Xen Cluster
- ESXi
- vCenter
- Hyper-V
- Hyper-V Cluster
- Proxmox VE Node
- Proxmox VE Cluster
- KVM
Adding a Citrix Xen Device
1. Create a Credential Profile
Go to Menu. Select Settings  . Select Discovery Settings
  . Select Credential Profile. The Credential Profile screen opens. Select Create Credential Profile.
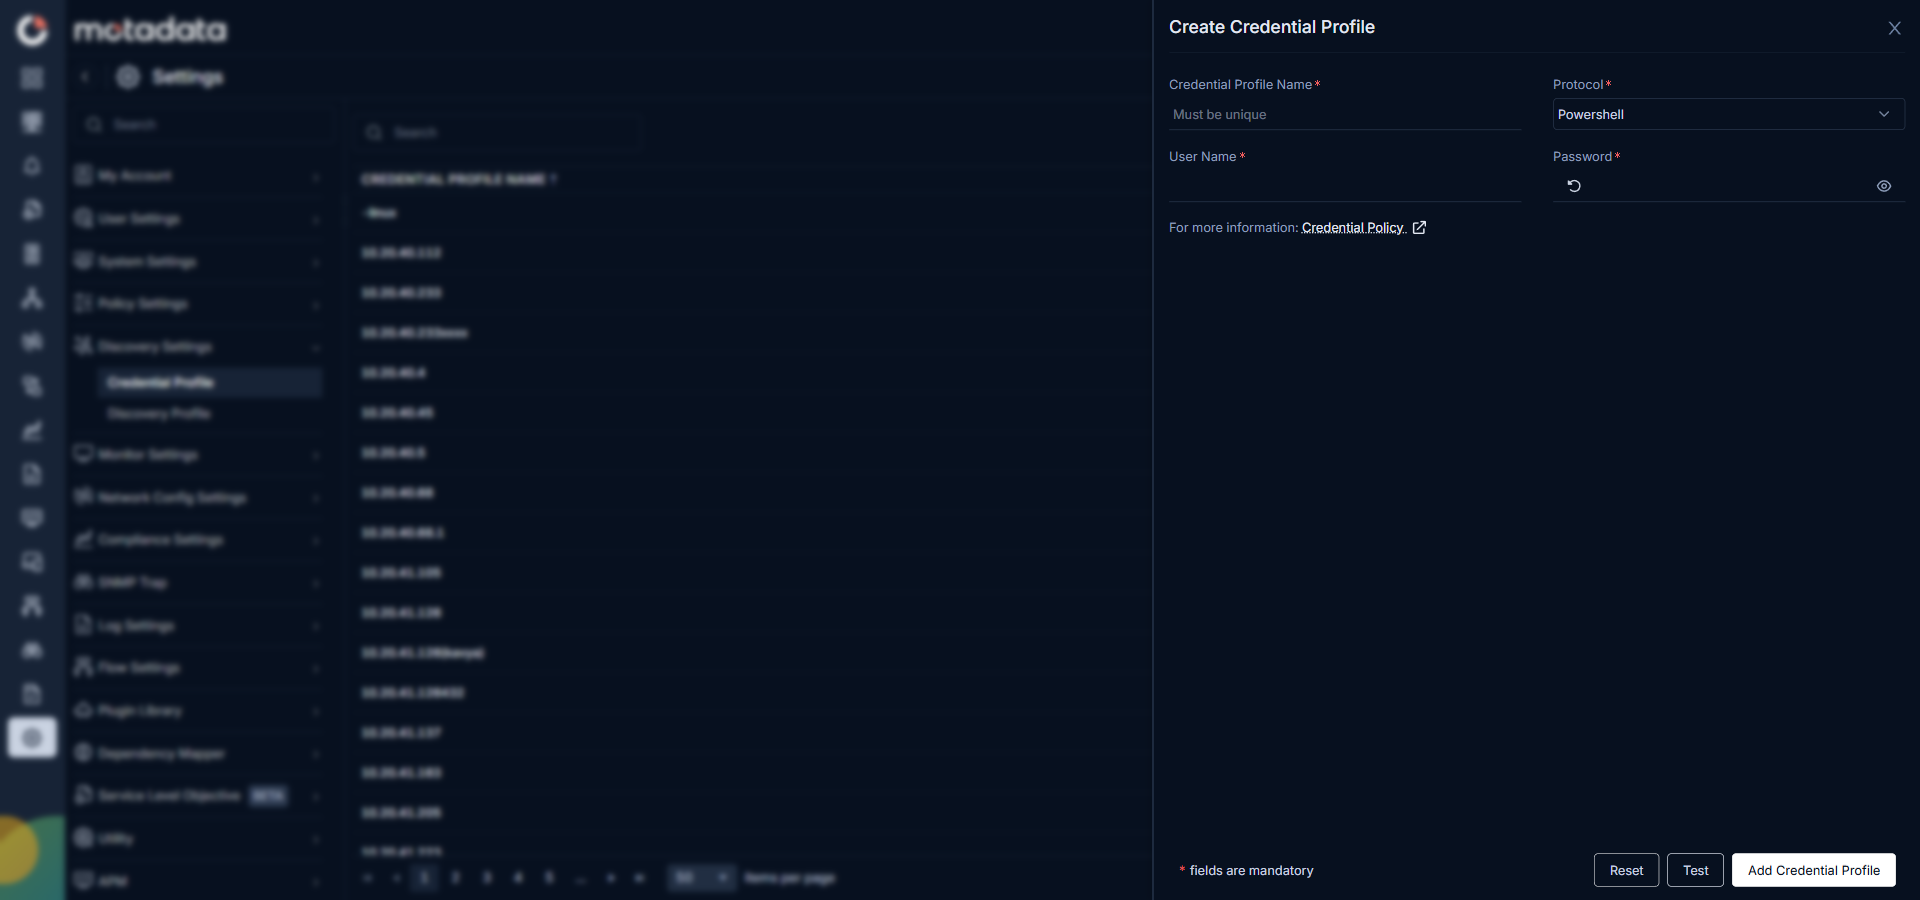
The Create Credential Profile form opens.
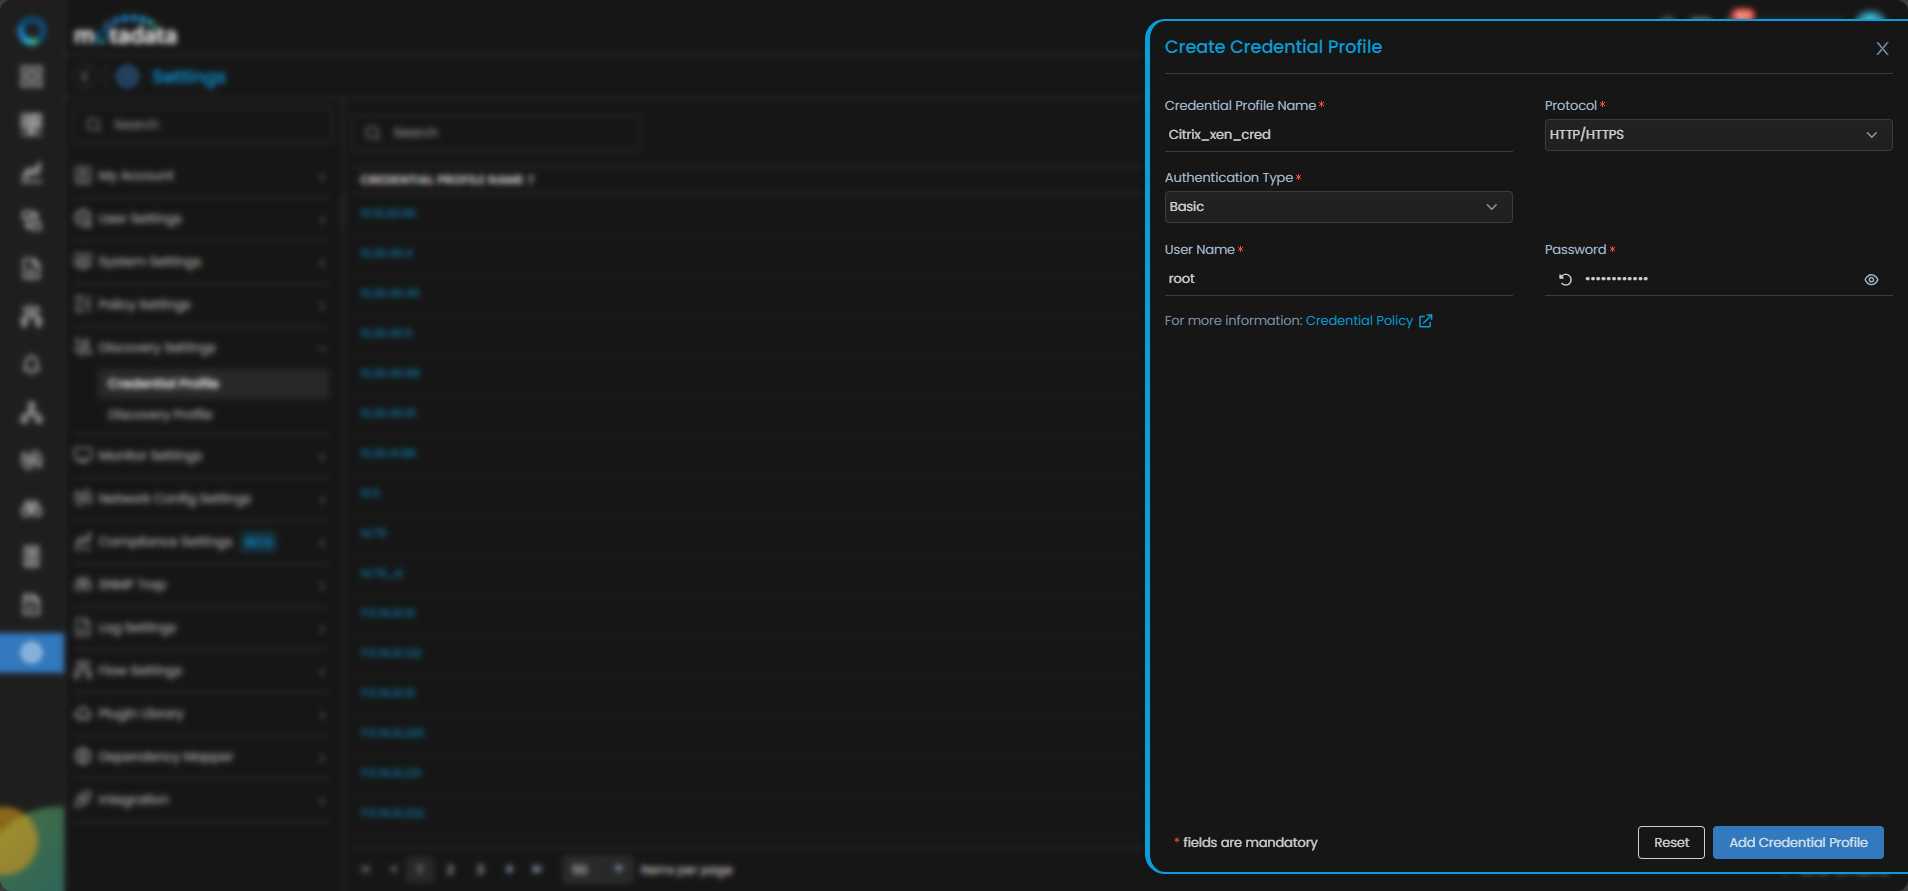
| Field | What to Enter |
|---|---|
| Credential Profile Name | A unique name to identify this profile |
| Protocol | Select HTTP/HTTPS |
| Username | The username for the Citrix Xen device |
| Password | The password for that account |
| Authentication Type | Select the authentication type configured on the device |
Select Test to verify the credentials connect to the device. Select Reset to clear all fields. Select Create Credential Profile to save.
The profile now appears in the Credential Profile list.

2. Create a Discovery Profile
Go to Menu. Select Settings . Select Discovery Settings . Select Discovery Profile. The Discovery Profile screen opens. Select Create Discovery Profile.
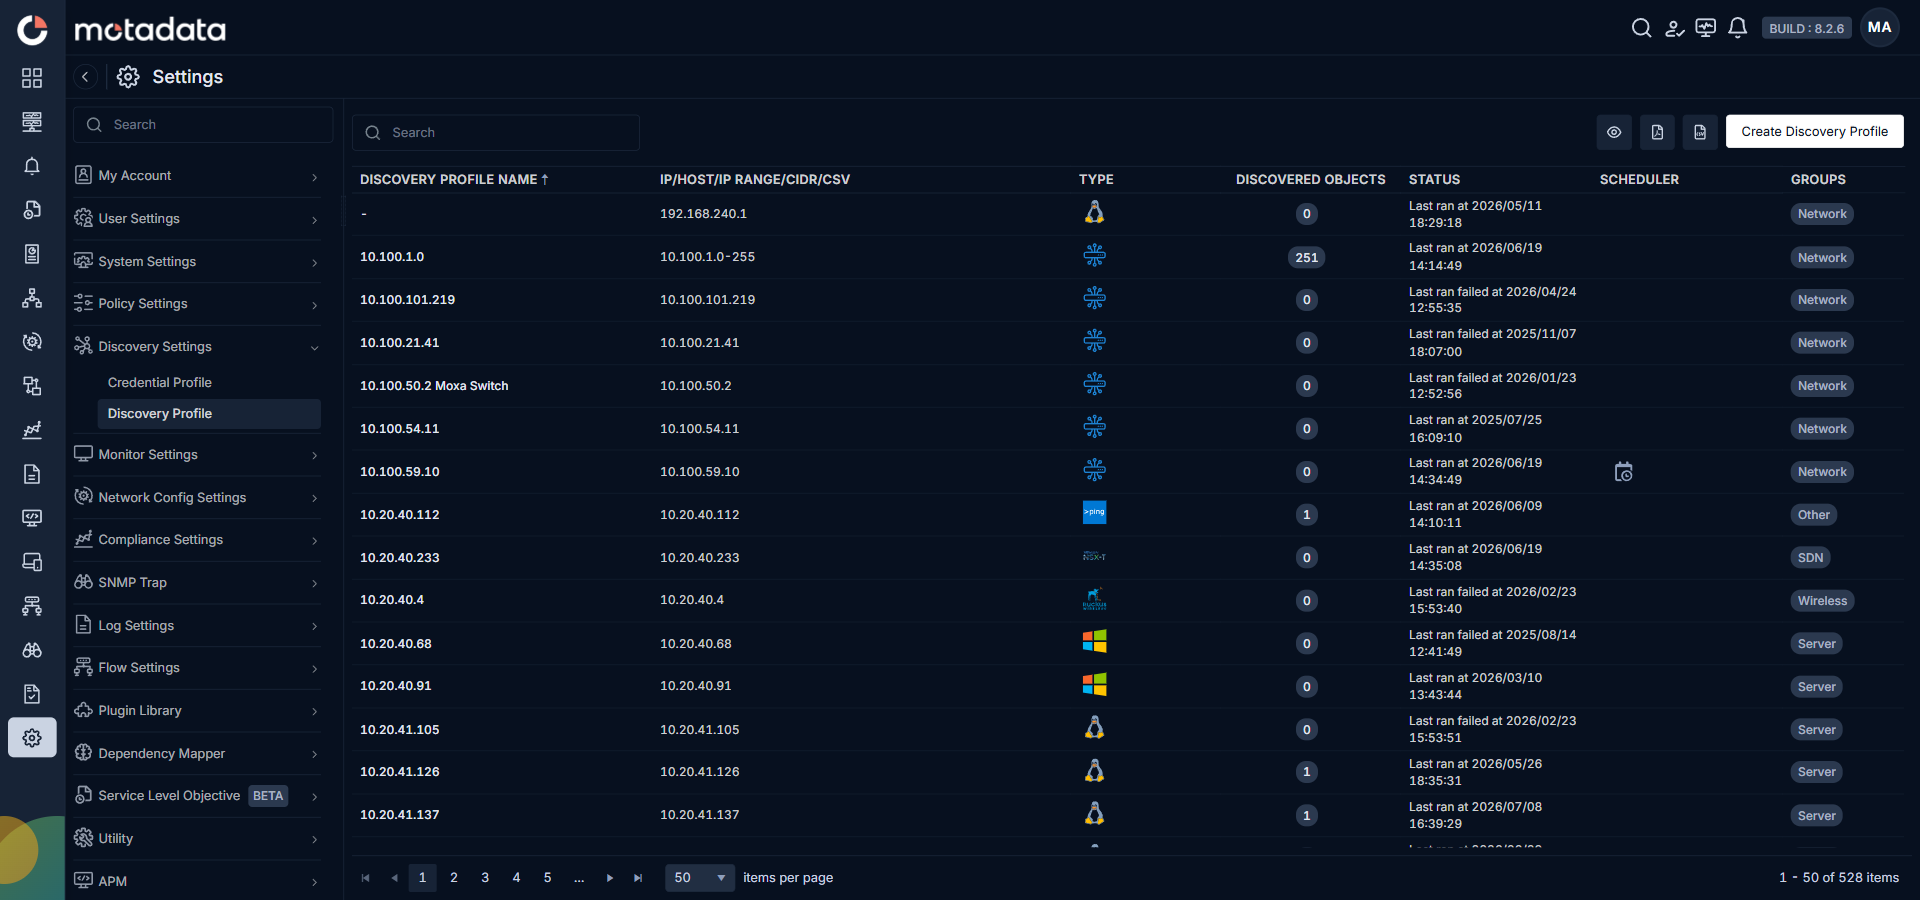
The Create Discovery Profile form opens. Select Virtualization from the sidebar.
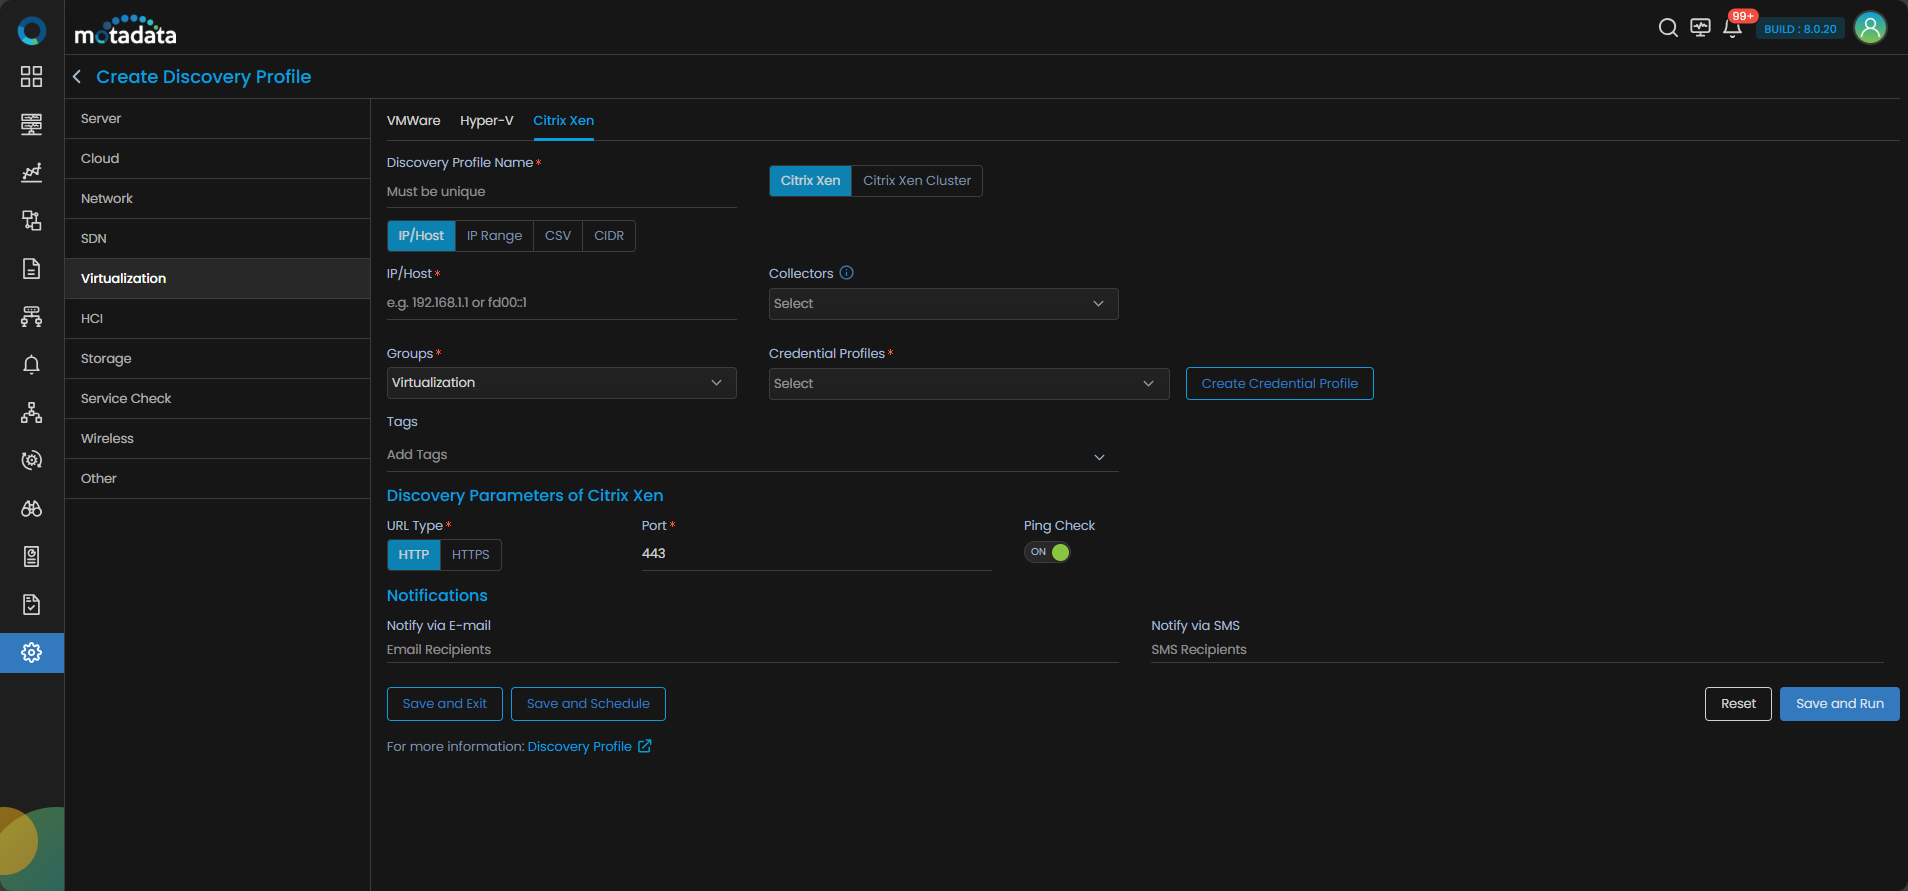
Select Citrix Xen to continue.
| Field | What to Enter |
|---|---|
| Discovery Profile Name | A unique name to identify this profile |
| IP / Host / IP Range / CIDR / CSV | The address or address range of your Citrix Xen hosts |
| Collectors | One or more Collectors for data collection. If you skip this, ObserveOps selects a Collector automatically. |
| Groups | One or more Groups to assign to provisioned monitors |
| Credential Profile | Select the Citrix Xen credential profile you just created |
| Tags | Tags to assign to discovered devices |
| Port | Pre-populated. No change needed. |
| Ping Check | On by default. Toggle off to discover devices that don't respond to ping. |
| Notify Team | Email addresses, handles, or user profiles to notify when discovery completes |
Select Collectors based on how you want to distribute the monitoring load.
Select Save and Run to save and start discovery immediately. Select Save and Exit to save without running. Select Save and Schedule to schedule discovery for a specific time.
3. Provision the Discovered Devices as Monitors
After the discovery run completes, ObserveOps shows all discovered devices.
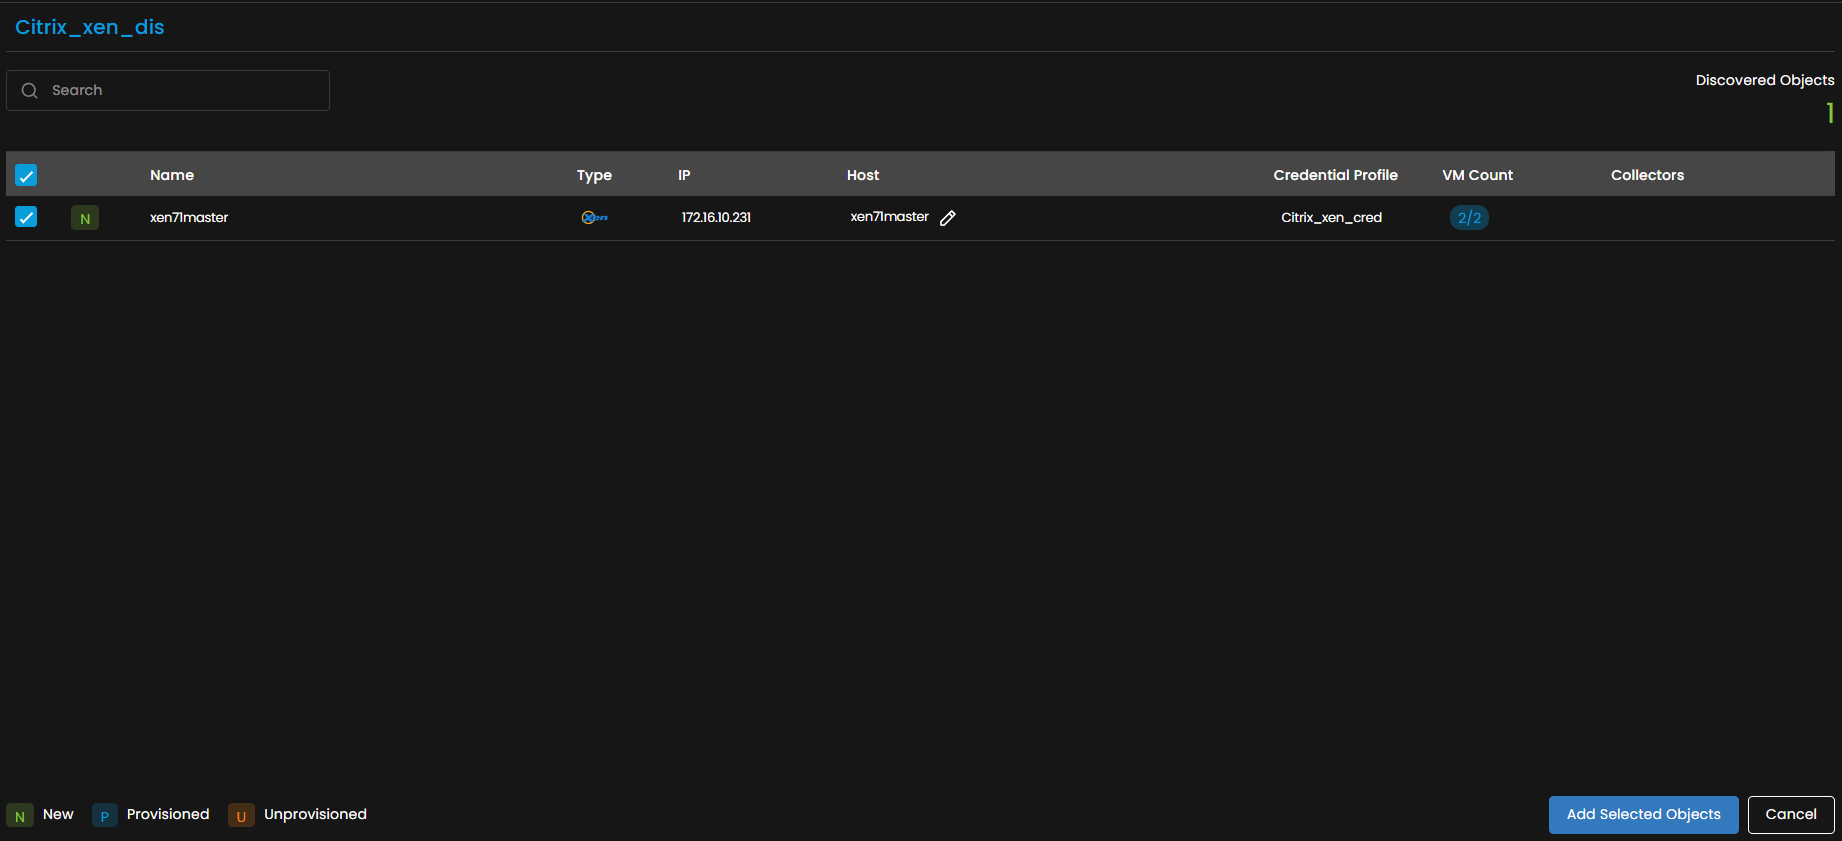
Select the devices you want to add as Monitors.

Select Add Selected Objects to provision the selected devices as monitors. ObserveOps now collects metrics continuously.
To view the monitors, go to Menu. Select Monitor. Select Virtualization.
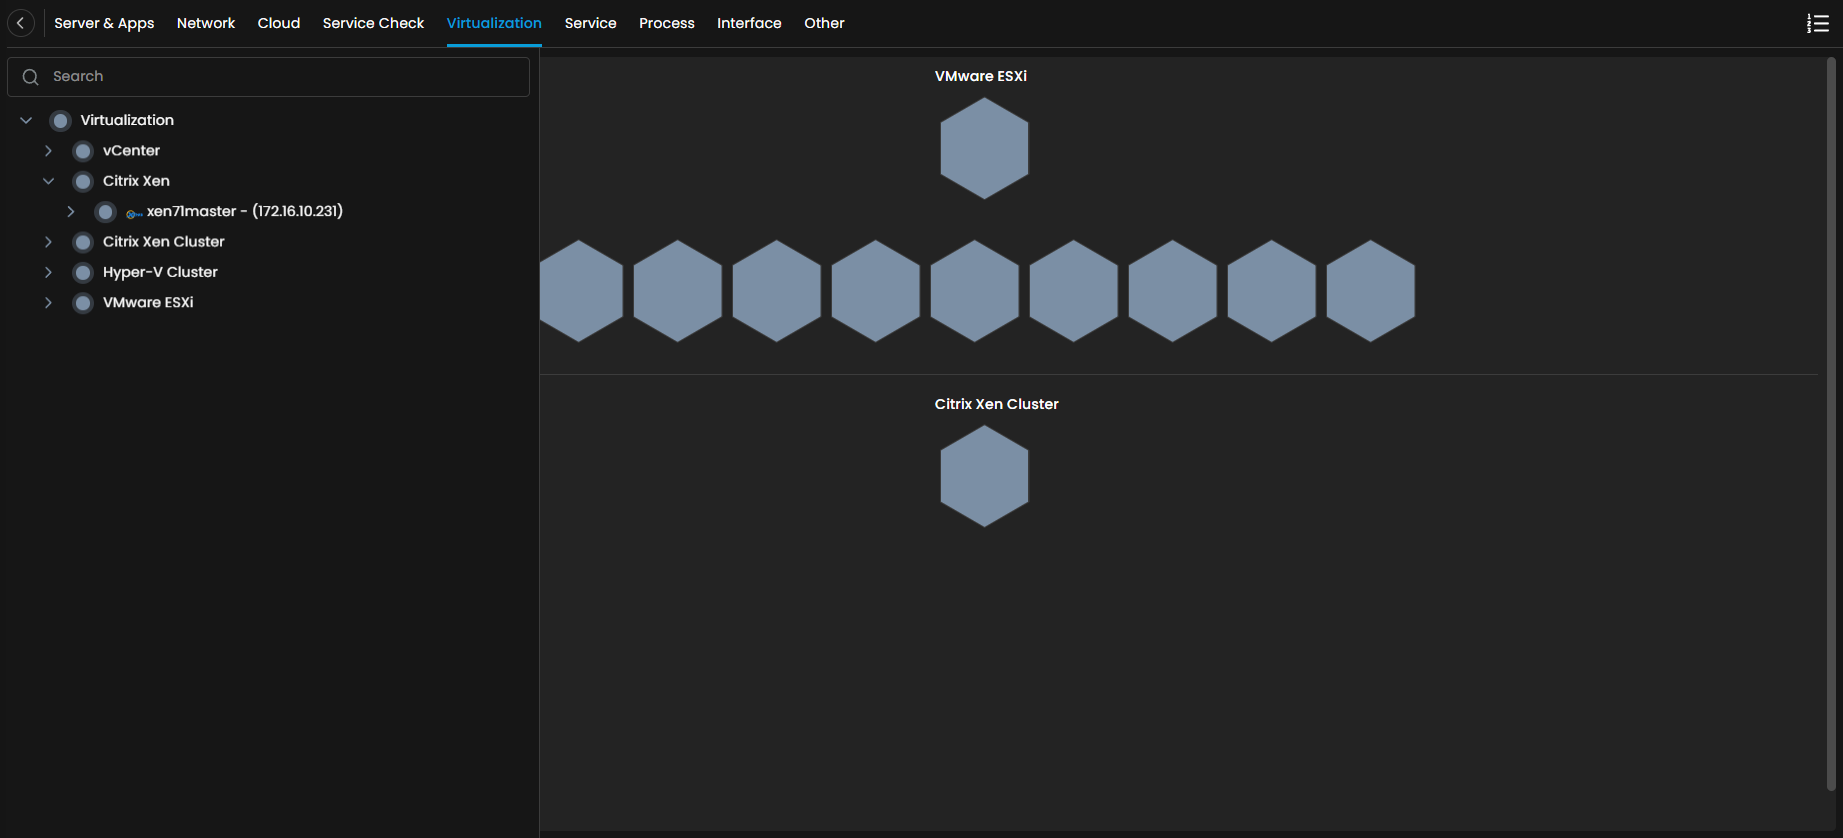
The Citrix Xen devices are now added to ObserveOps.
Adding a Citrix Xen Cluster
1. Create a Credential Profile
Go to Menu. Select Settings . Select Discovery Settings . Select Credential Profile. The Credential Profile screen opens. Select Create Credential Profile.
The Create Credential Profile form opens.
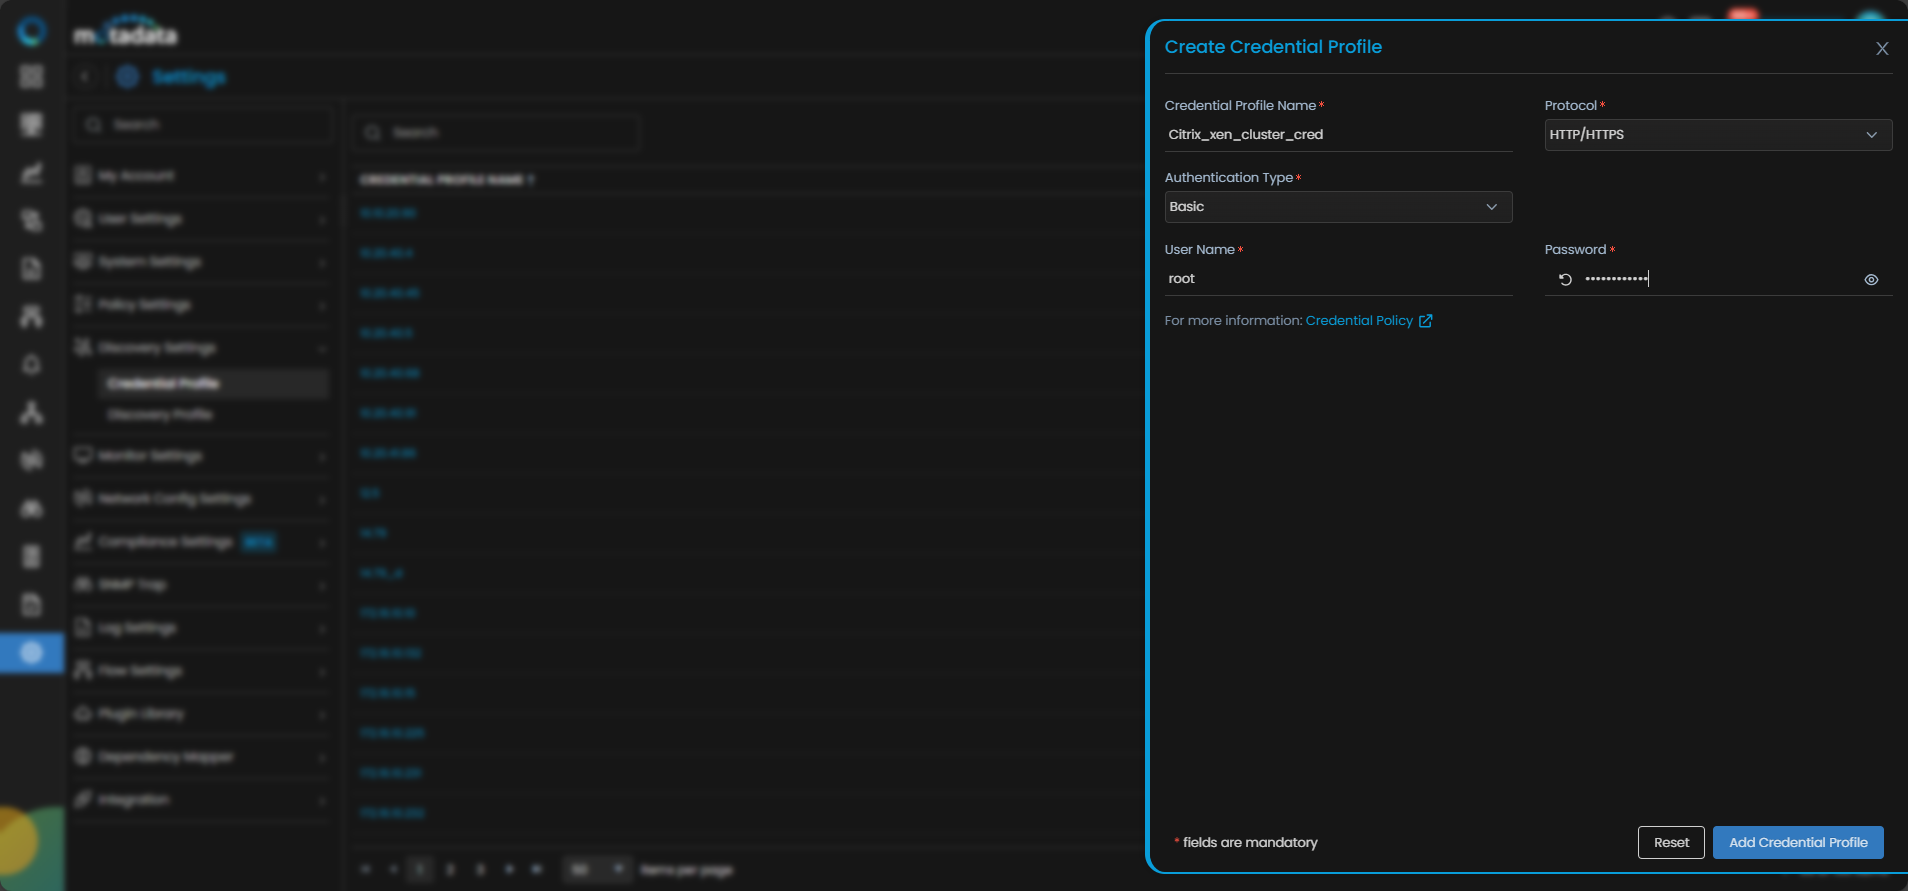
| Field | What to Enter |
|---|---|
| Credential Profile Name | A unique name to identify this profile |
| Protocol | Select HTTP/HTTPS |
| Username | The username for the Citrix Xen Cluster |
| Password | The password for that account |
| Authentication Type | Select the authentication type configured on the cluster |
Select Reset to clear all fields. Select Create Credential Profile to save.
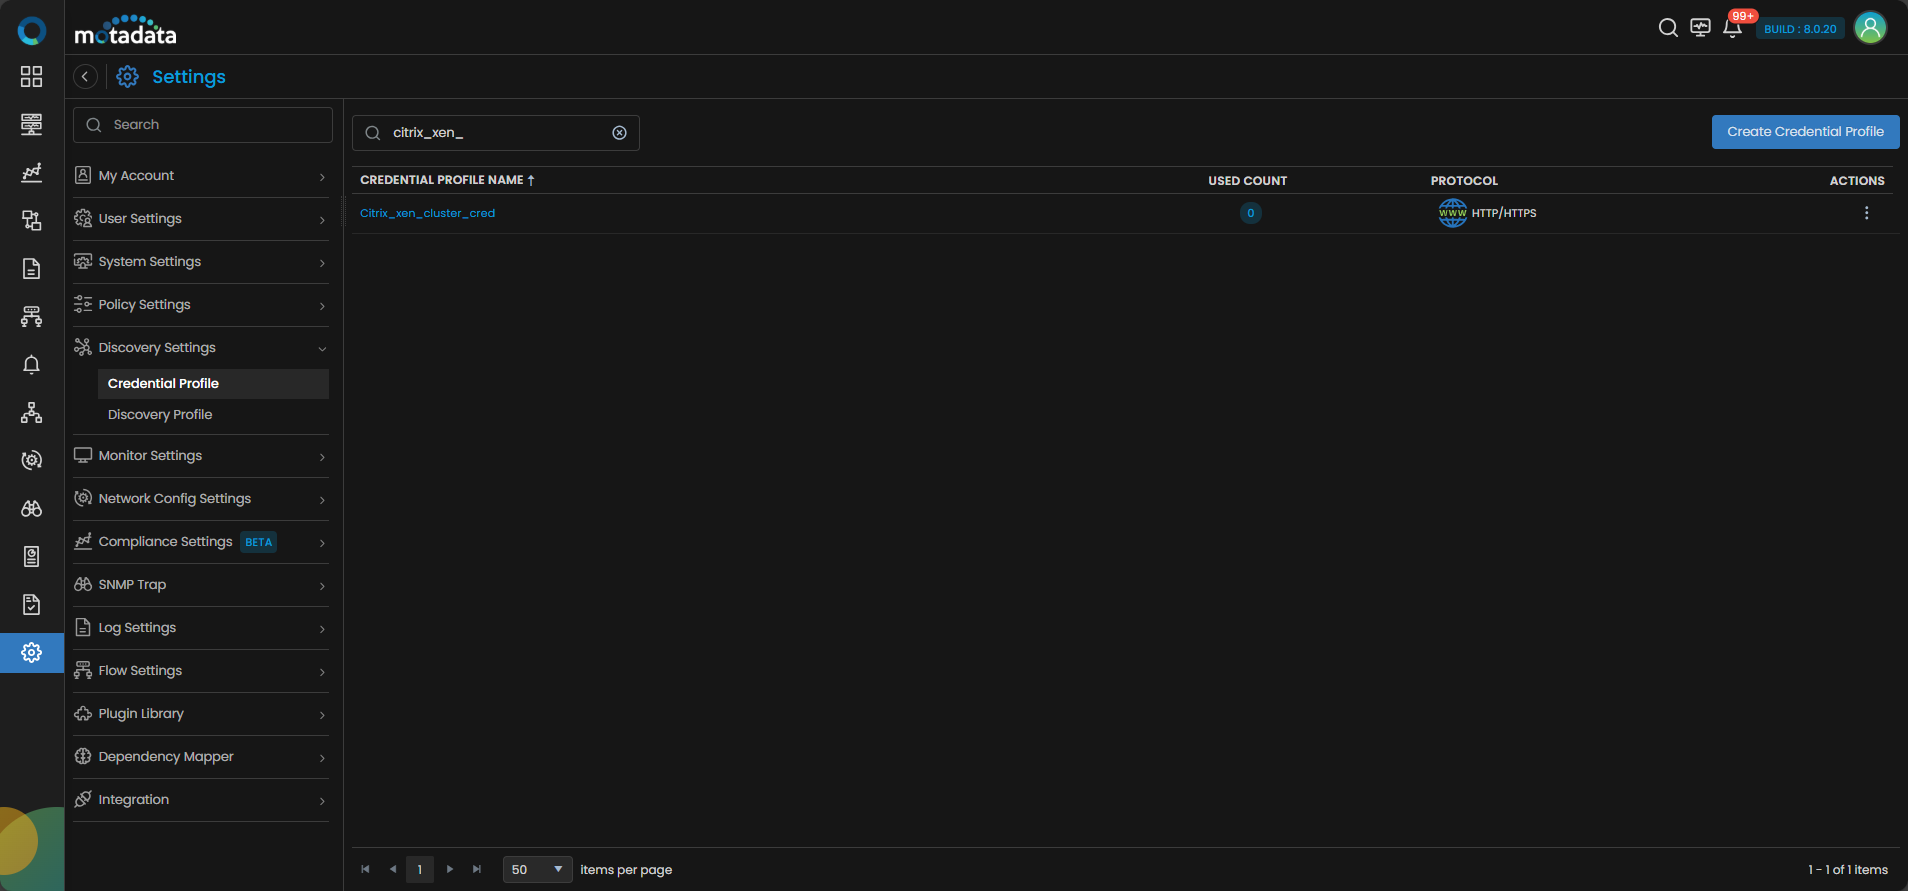
The profile now appears in the Credential Profile list.
2. Create a Discovery Profile
Go to Menu. Select Settings . Select Discovery Settings . Select Discovery Profile. The Discovery Profile screen opens. Select Create Discovery Profile.
The Create Discovery Profile form opens. Select Virtualization from the sidebar.
Select Citrix Xen Cluster to continue.
| Field | What to Enter |
|---|---|
| Discovery Profile Name | A unique name to identify this profile |
| IP / Host | The IP address or hostname of the cluster |
| Collectors | One or more Collectors for data collection. If you skip this, ObserveOps selects a Collector automatically. |
| Groups | One or more Groups to assign to provisioned monitors |
| Credential Profile | Select the Citrix Xen Cluster credential profile you just created |
| Tags | Tags to assign to discovered devices |
| URL Type | Select HTTP or HTTPS to match your cluster configuration |
| Port | Pre-populated. No change needed. |
| Ping Check | On by default. Toggle off to discover devices that don't respond to ping. |
| Notify Team | Email addresses, handles, or user profiles to notify when discovery completes |
Select Collectors based on how you want to distribute the monitoring load.
Select Save and Run to save and start discovery immediately. Select Save and Exit to save without running.
3. Provision the Discovered Devices as Monitors
After the discovery run completes, ObserveOps shows all discovered components.
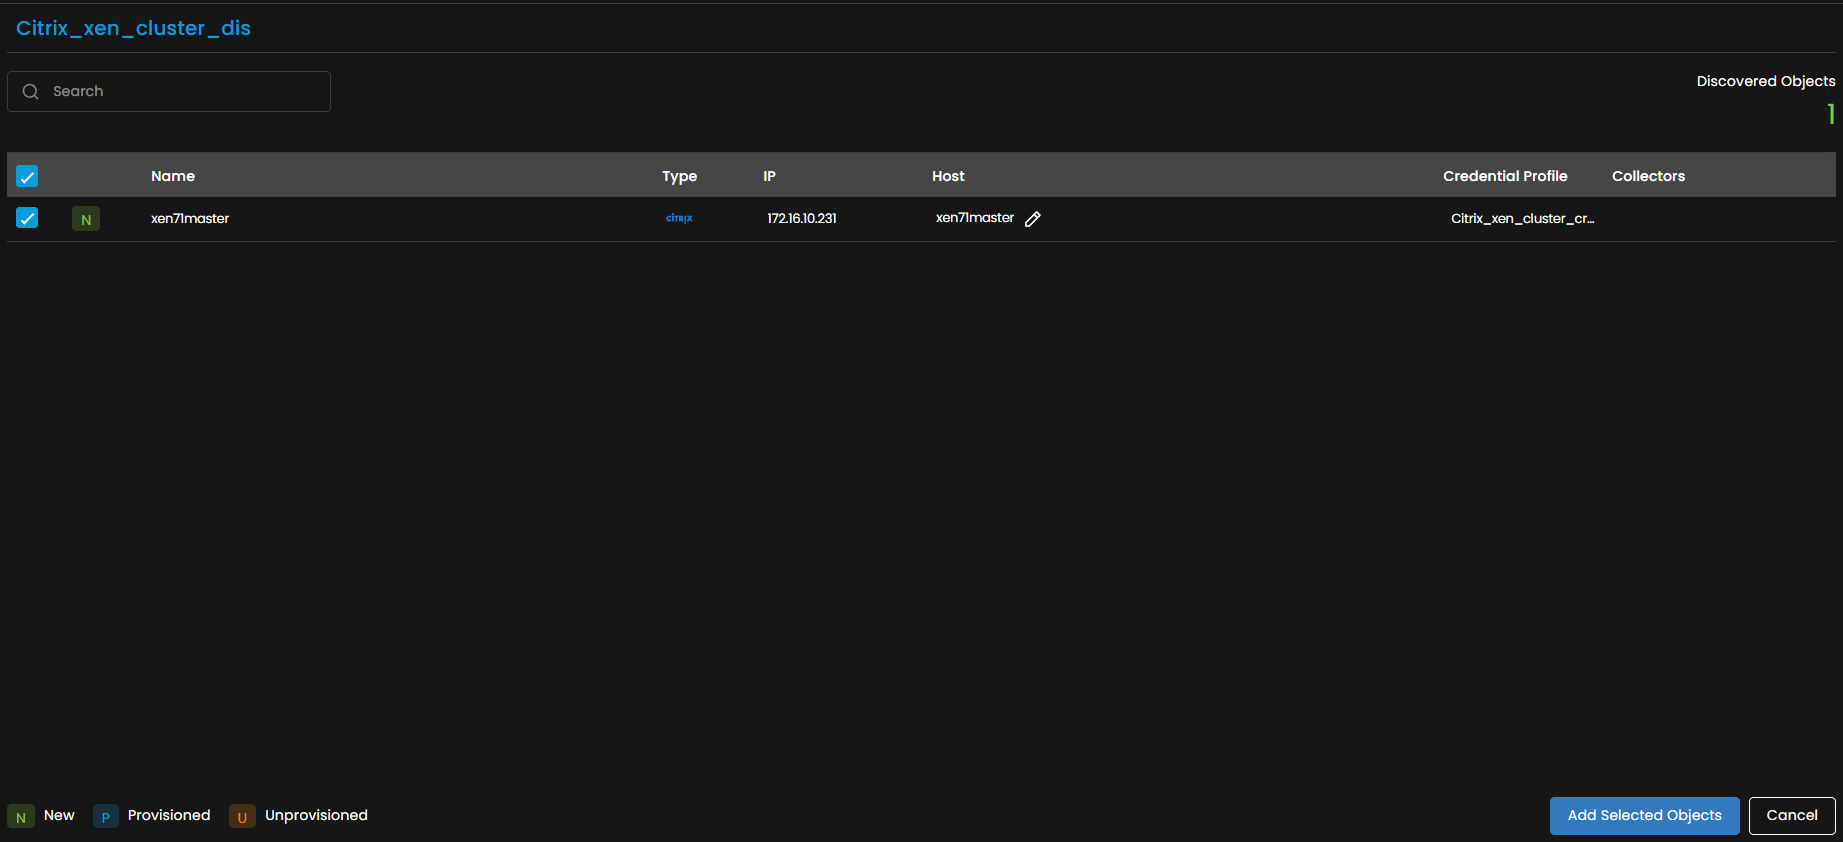
Select the components you want to add as Monitors.
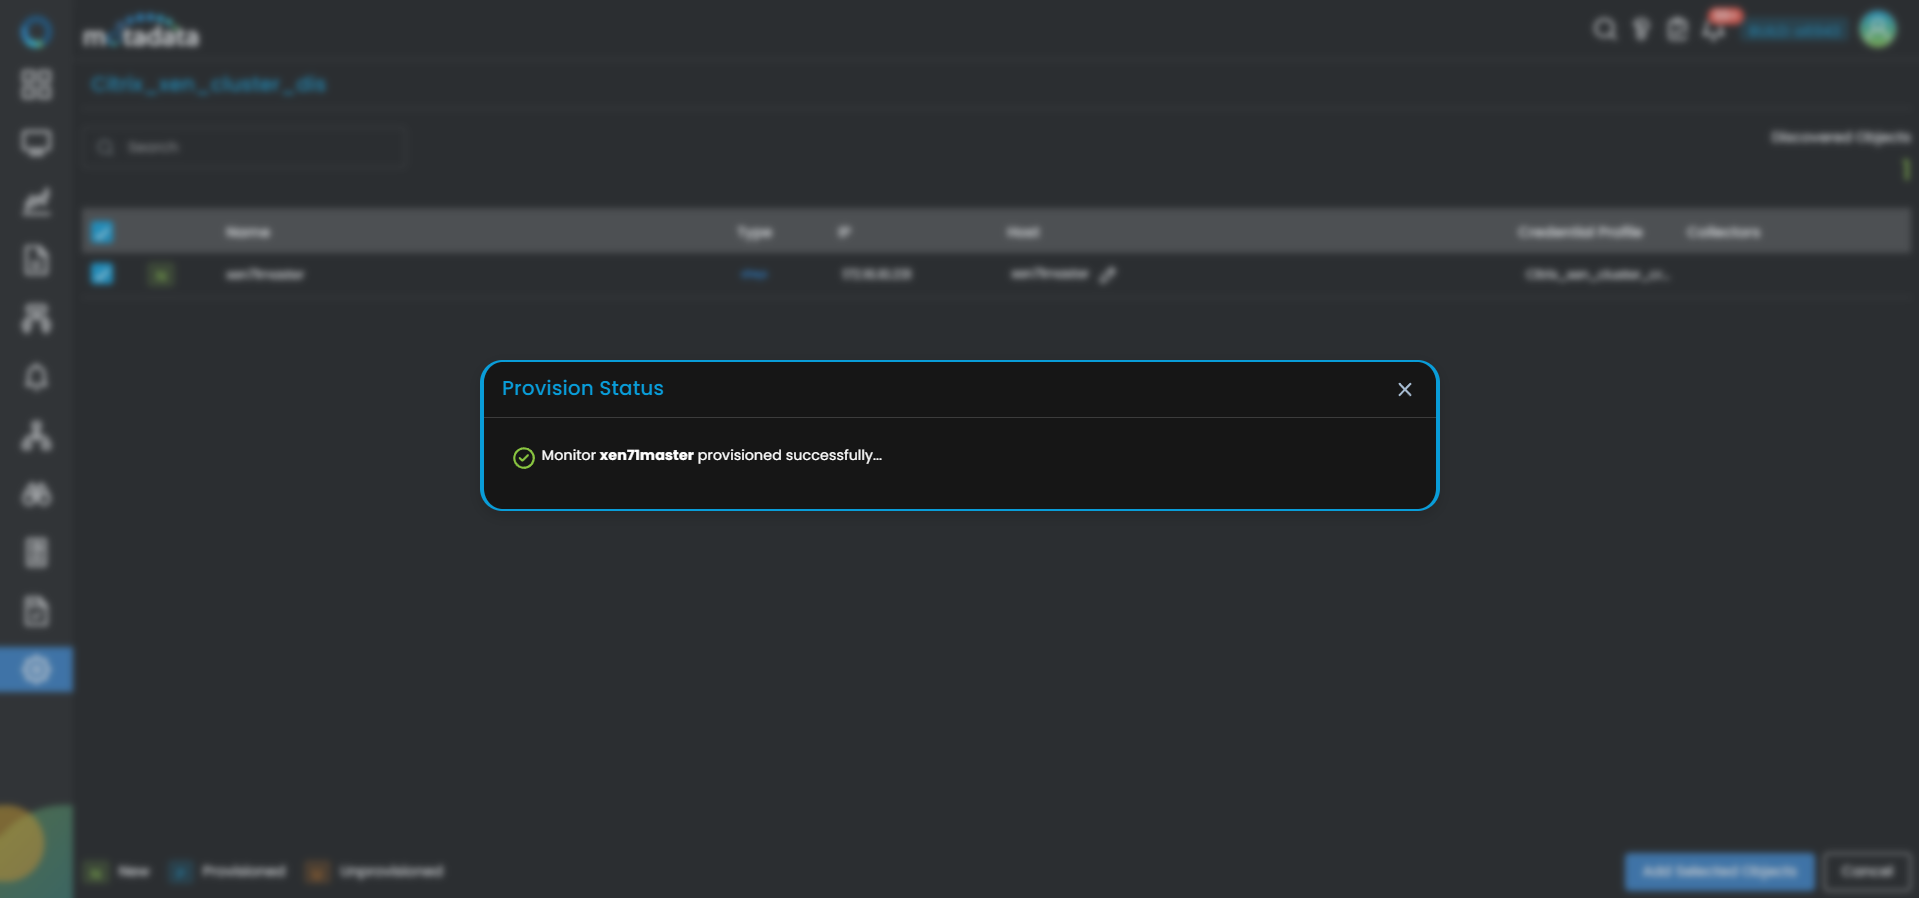
The Provisioning screen shows three tabs: Citrix Hypervisor, Citrix Resource Pool, and Virtual Machine. Each tab lets you select and provision components individually.
To assign credential profiles to Citrix Hypervisor or Virtual Machine components:
Select the Select Credential Profile option on the relevant tab. You can assign to individual devices or select multiple checkboxes to assign in bulk.
You can assign credential profiles to multiple Citrix Hypervisor nodes at once by selecting their checkboxes.
A side panel opens where you assign a credential profile, create a new one, and set the port. ObserveOps tests the profile automatically. A green success message confirms it worked. A red error message means the assignment failed.
Select Add Selected Objects to provision the selected components as monitors.
- Citrix Hypervisor appears under Virtualization in the Citrix Hypervisor section.
- Citrix Resource Pool appears under Virtualization in the Citrix Resource Pool section.
- Virtual Machines appear under Virtualization with their associated Citrix Hypervisor or Citrix Resource Pool, and also under Server & Apps when provisioned with a credential profile.
Citrix Hypervisor nodes are auto-tagged with resource_pool, depends_on, and citrix. Virtual Machines get the tags hypervisor:citrix, depends_on, type:vm, os, and vm. During VMotion, the Citrix Hypervisor tag on VMs updates automatically during polling.
To view the monitors, go to Menu. Select Monitor. Select Virtualization.
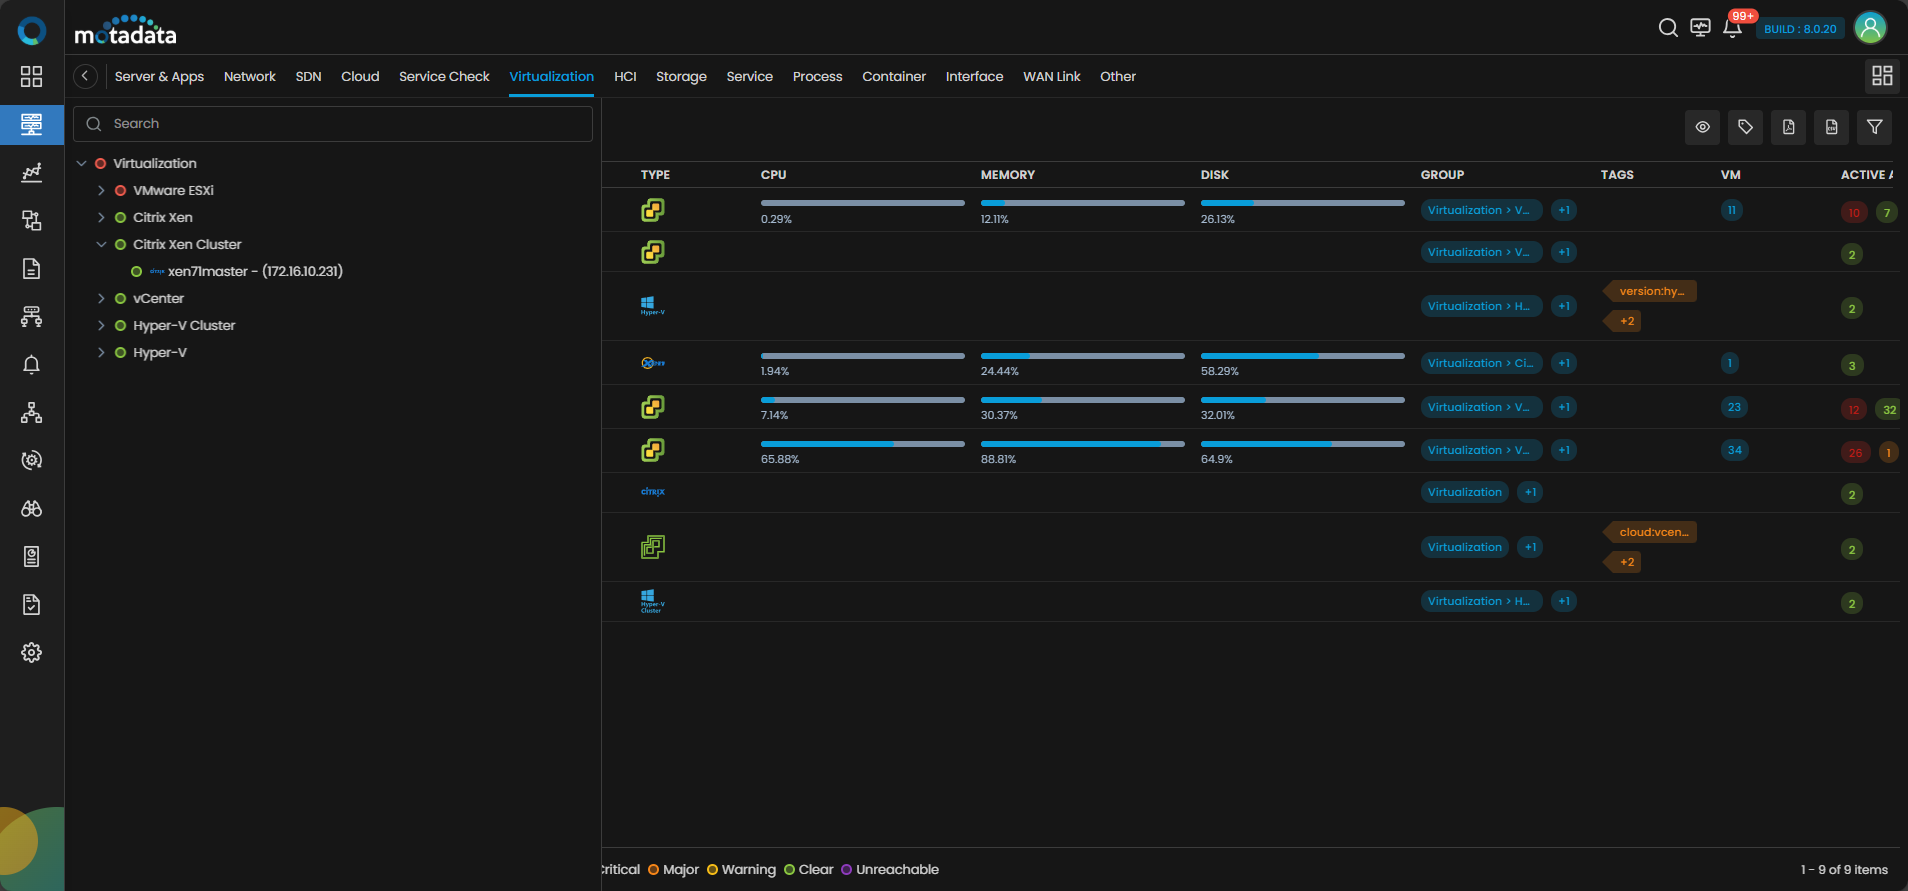
The Citrix Xen Cluster devices are now added to ObserveOps.
Adding an ESXi Host
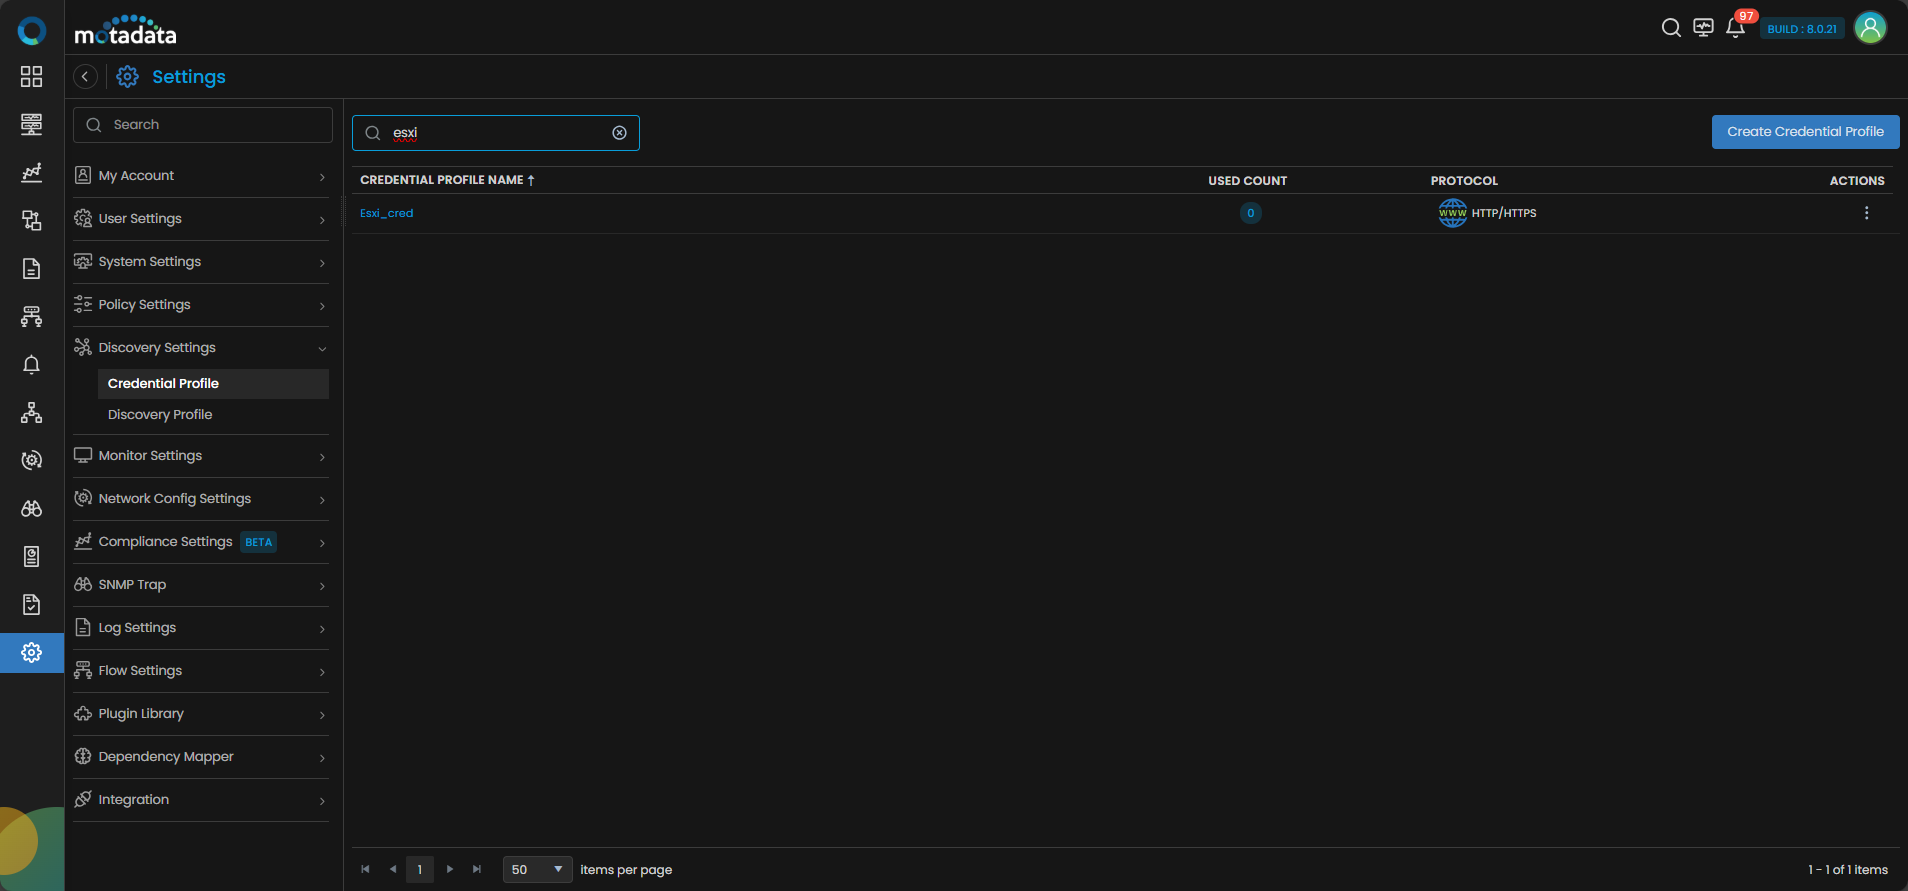
1. Create a Credential Profile
Go to Menu. Select Settings . Select Discovery Settings . Select Credential Profile. The Credential Profile screen opens. Select Create Credential Profile.
The Create Credential Profile form opens.
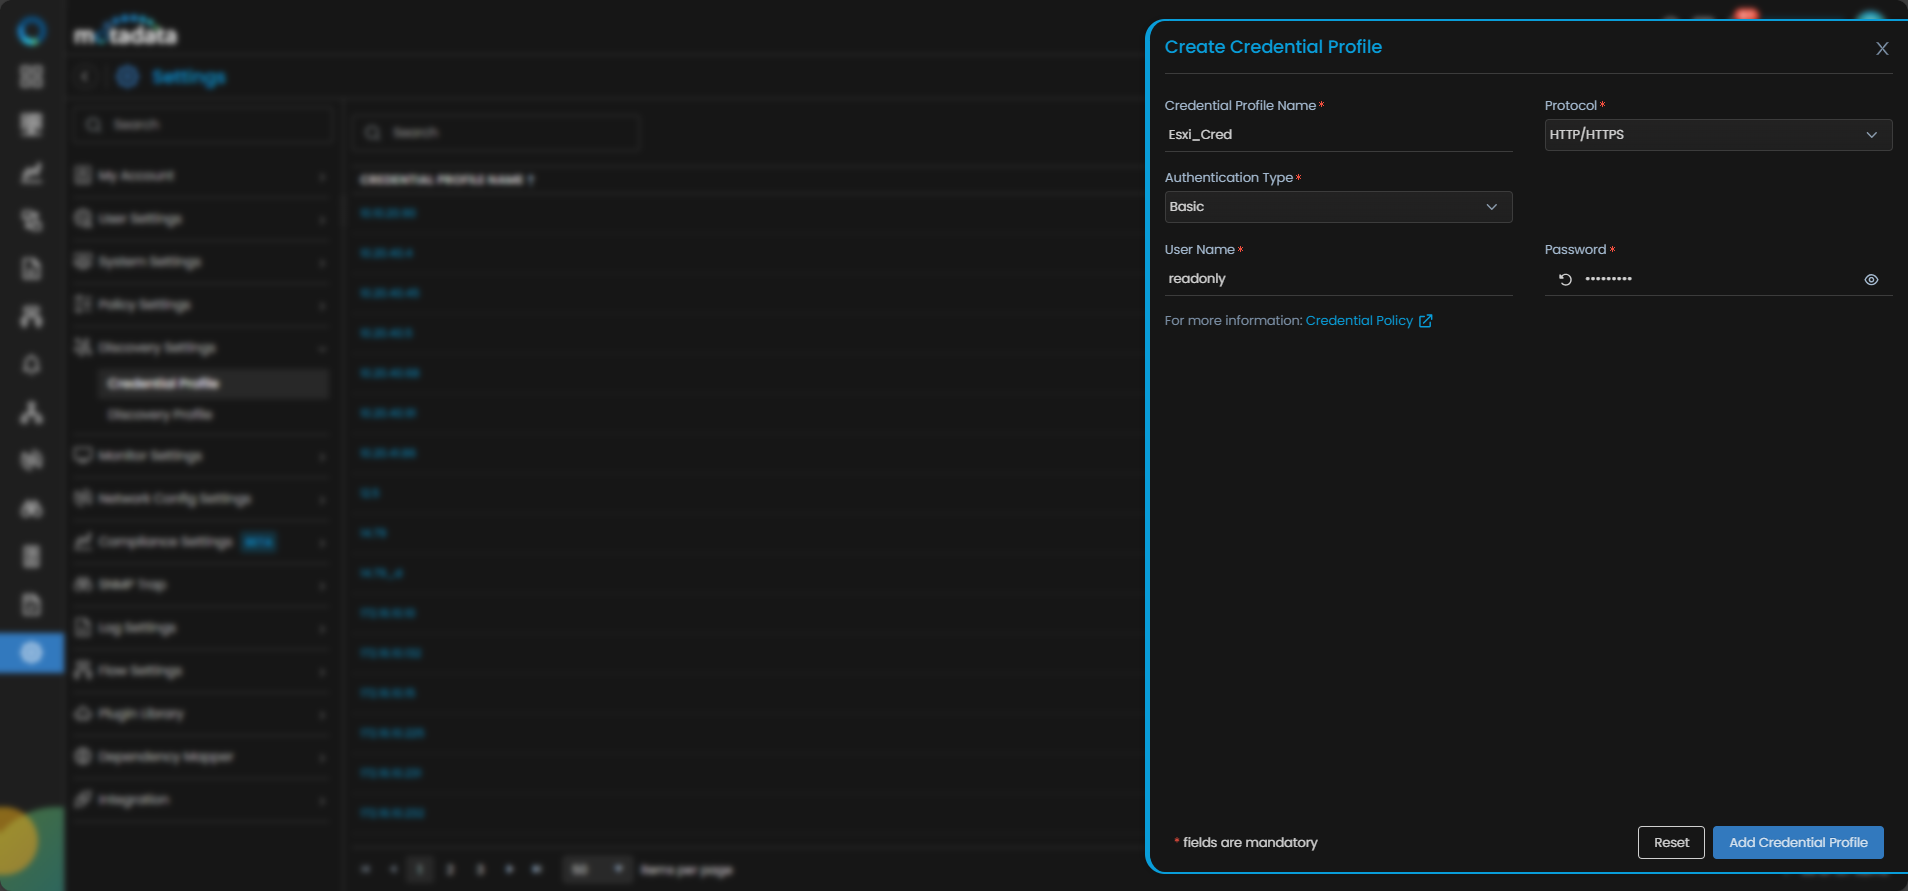
| Field | What to Enter |
|---|---|
| Credential Profile Name | A unique name to identify this profile |
| Protocol | Select HTTP/HTTPS |
| Username | The username for the ESXi host |
| Password | The password for that account |
| Authentication Type | Select the authentication type configured on the device |
Select Reset to clear all fields. Select Create Credential Profile to save.
The profile now appears in the Credential Profile list.
2. Create a Discovery Profile
Go to Menu. Select Settings . Select Discovery Settings . Select Discovery Profile. The Discovery Profile screen opens. Select Create Discovery Profile.
The Create Discovery Profile form opens. Select Virtualization from the sidebar. Select the VMware tab, then select ESX/ESXi.
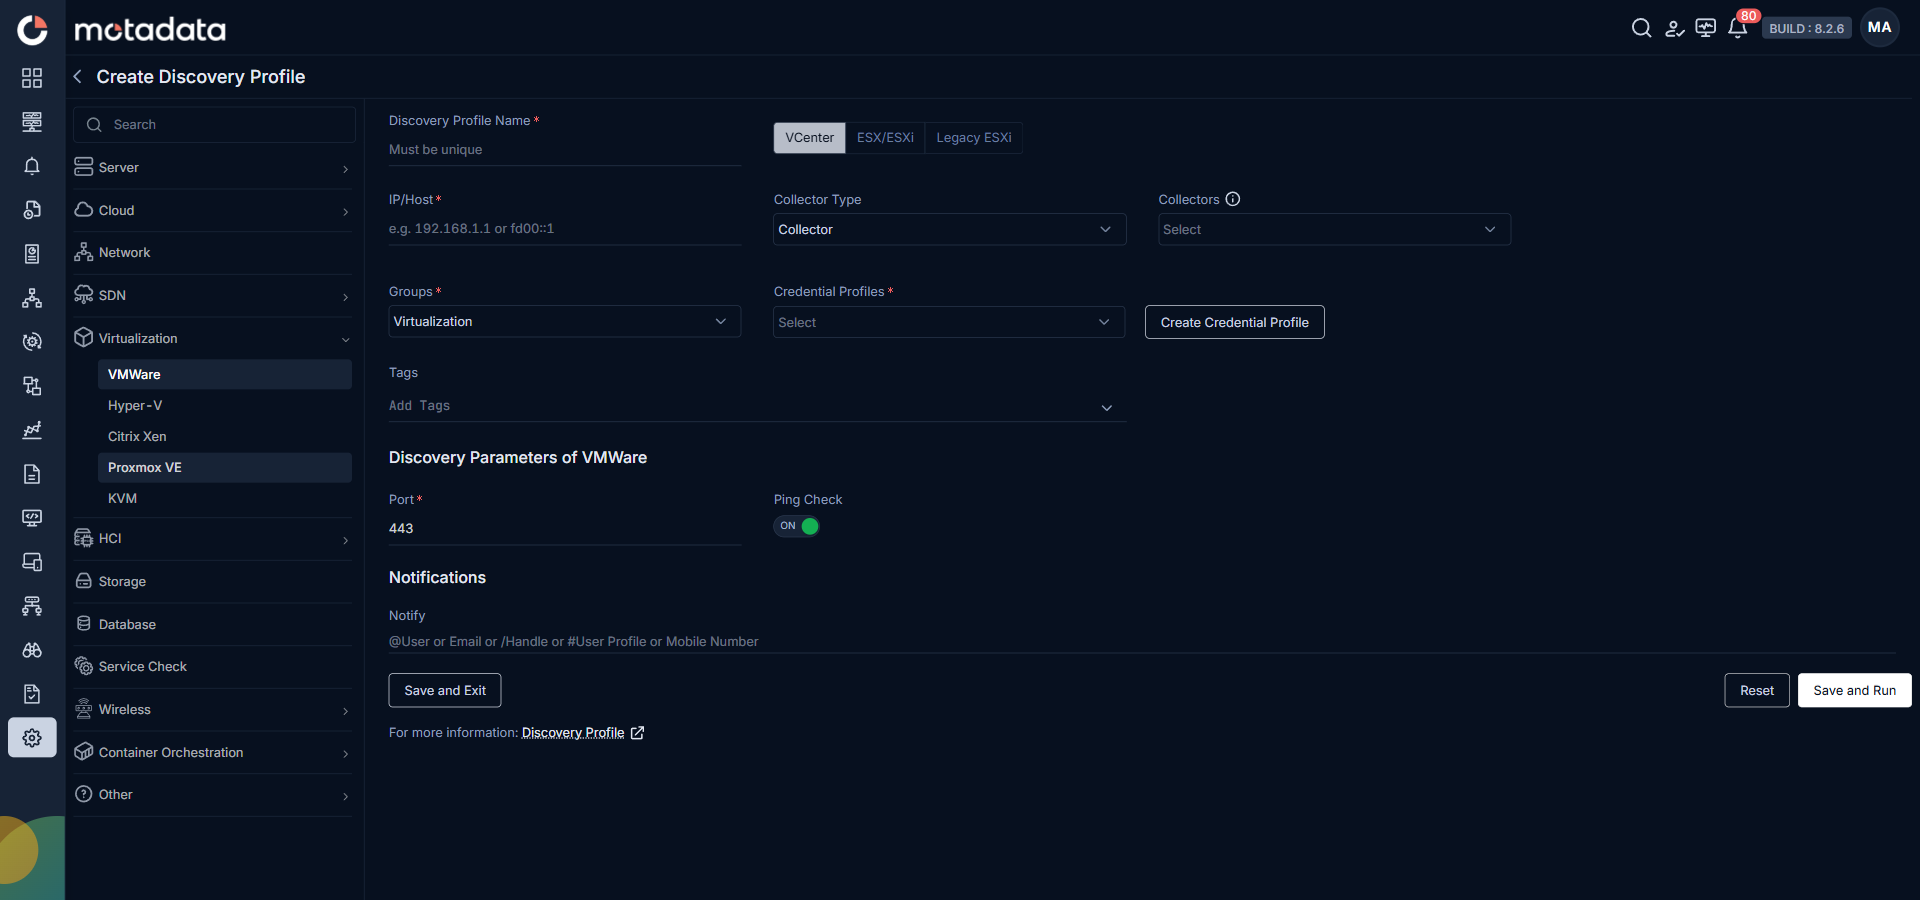
| Field | What to Enter |
|---|---|
| Discovery Profile Name | A unique name to identify this profile |
| IP / Host / IP Range / CIDR / CSV | The address or address range of your ESXi hosts |
| Collectors | One or more Collectors for data collection. If you skip this, ObserveOps selects a Collector automatically. |
| Groups | One or more Groups to assign to provisioned monitors |
| Credential Profile | Select the ESXi credential profile you just created |
| Tags | Tags to assign to discovered devices |
| Port | Pre-populated. No change needed. |
| Ping Check | On by default. Toggle off to discover devices that don't respond to ping. |
| Notify Team | Email addresses, handles, or user profiles to notify when discovery completes |
Select Collectors based on how you want to distribute the monitoring load.
Select Save and Run to save and start discovery immediately. Select Save and Exit to save without running. Select Save and Schedule to schedule discovery for a specific time.
3. Provision the Discovered Devices as Monitors
After the discovery run completes, ObserveOps shows all discovered devices.
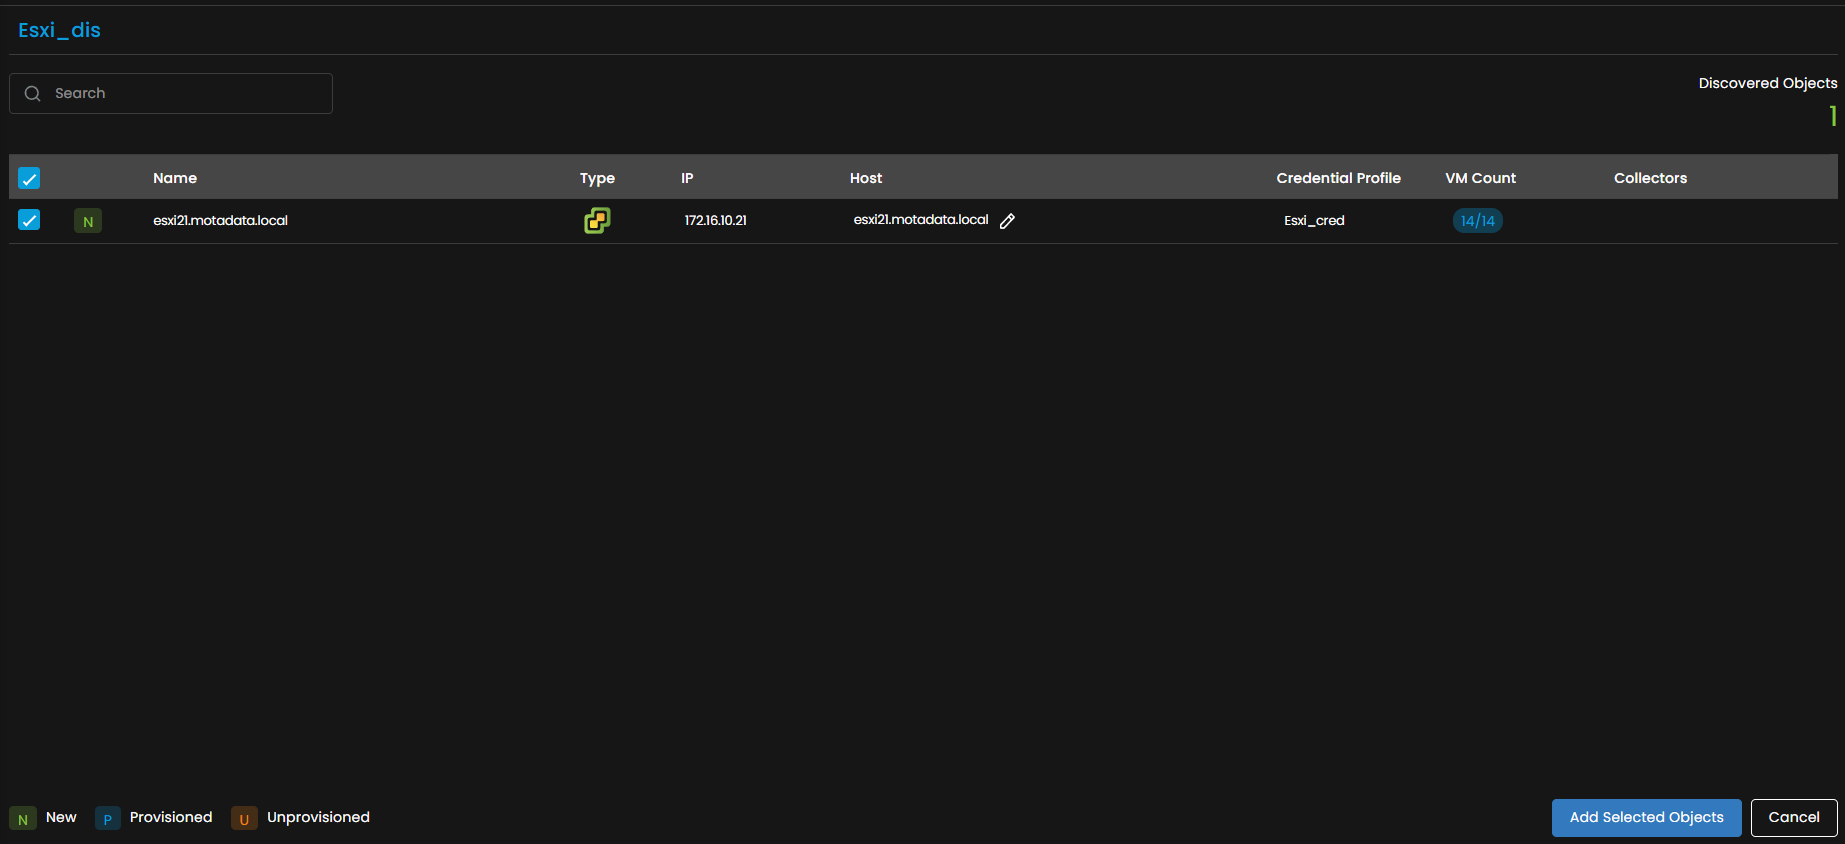
Select the devices you want to add as Monitors.
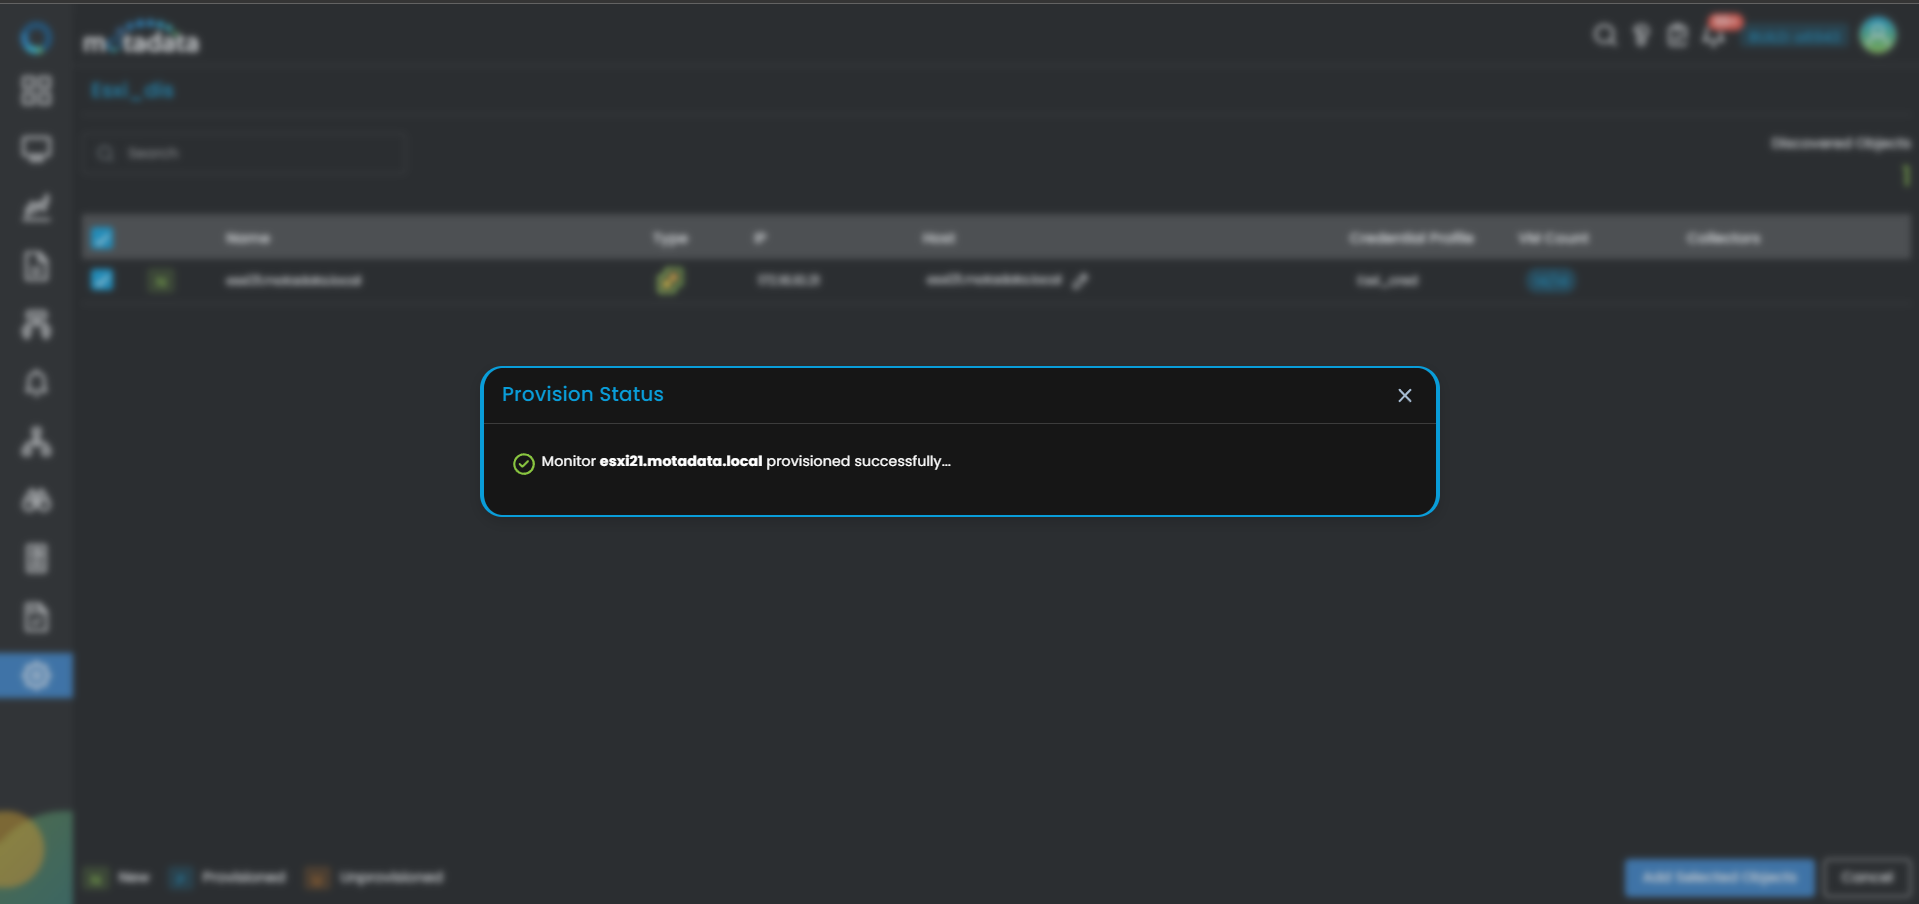
Select Add Selected Objects to provision the selected devices as monitors. ObserveOps now collects metrics continuously.
To view the monitors, go to Menu. Select Monitor. Select Virtualization.
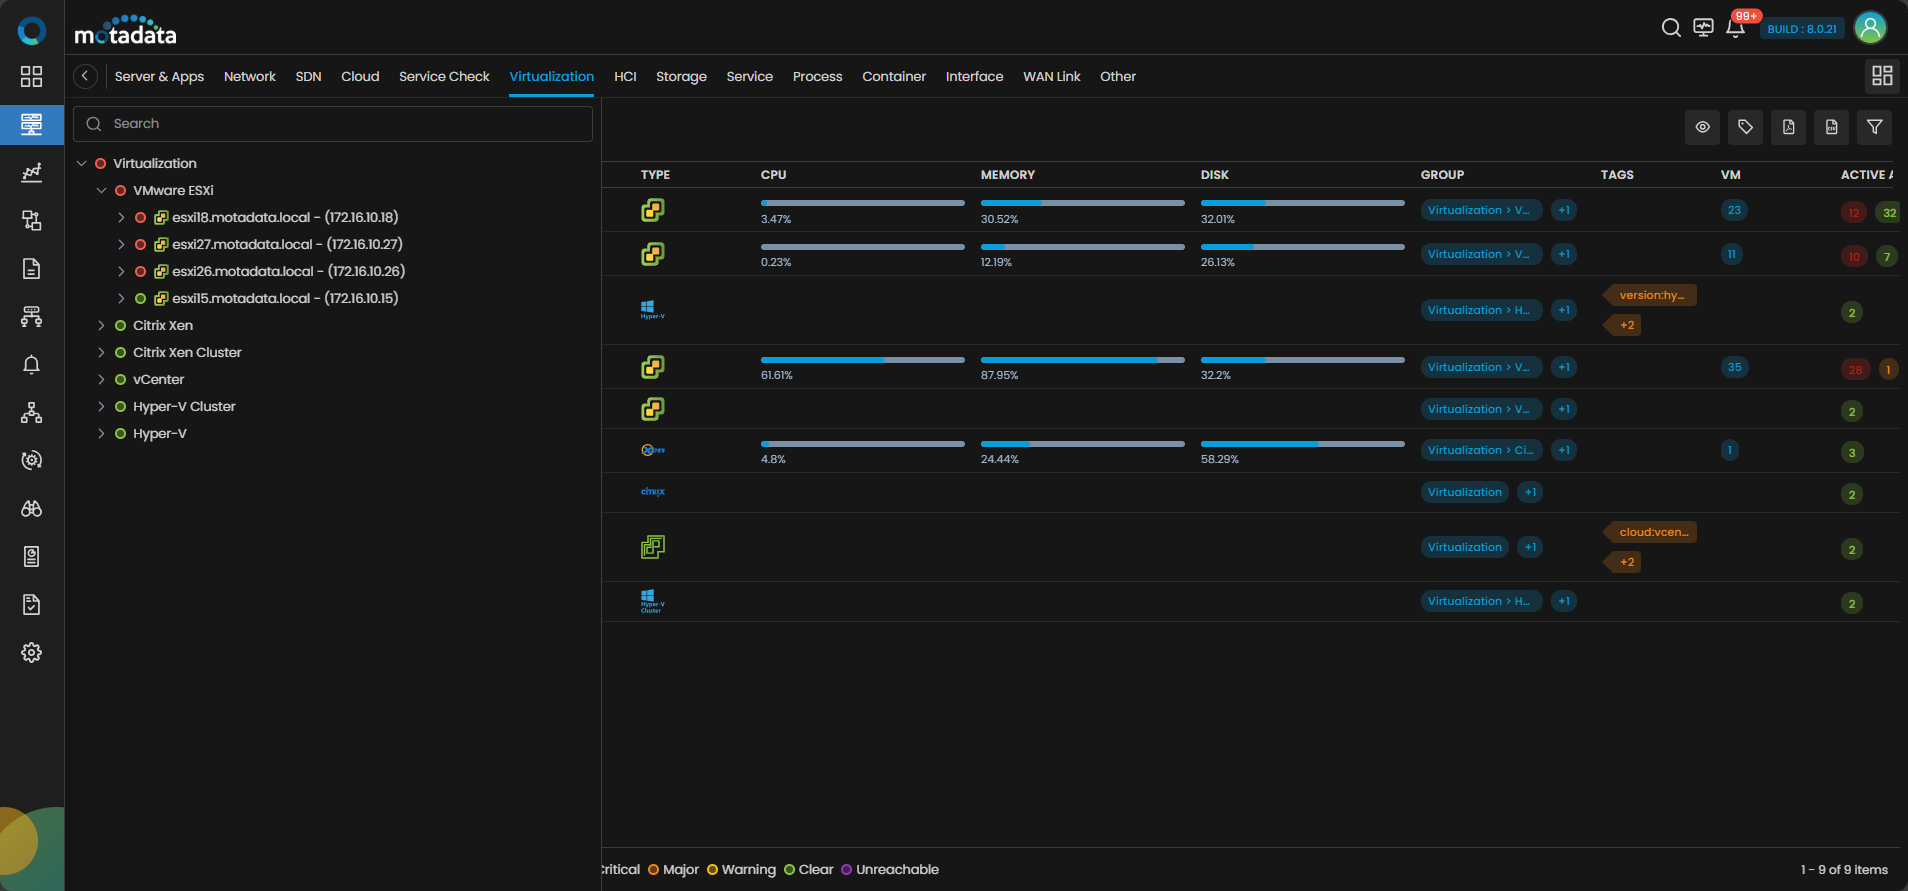
The ESXi hosts are now added to ObserveOps.
Adding a vCenter
1. Create a Credential Profile
Go to Menu. Select Settings . Select Discovery Settings . Select Credential Profile. The Credential Profile screen opens. Select Create Credential Profile.
The Create Credential Profile form opens.
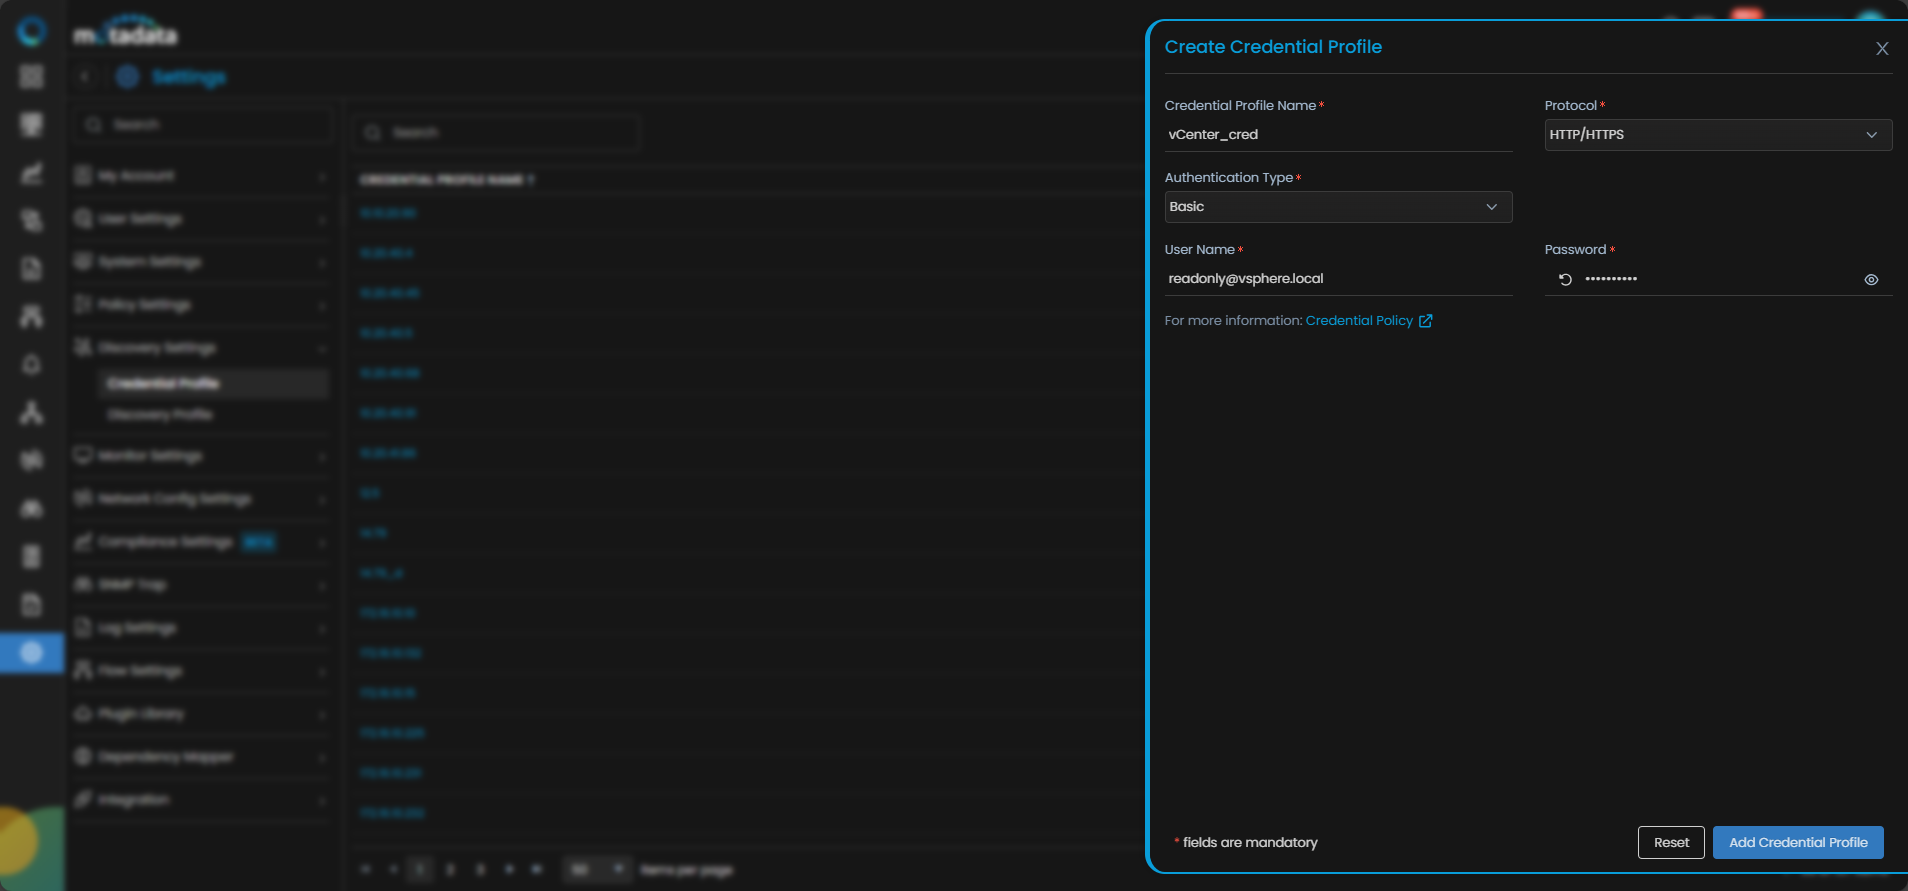
| Field | What to Enter |
|---|---|
| Credential Profile Name | A unique name to identify this profile |
| Protocol | Select HTTP/HTTPS |
| Username | The vCenter username |
| Password | The password for that account |
| Authentication Type | Select the authentication type configured on the vCenter |
Select Reset to clear all fields. Select Create Credential Profile to save.
The profile now appears in the Credential Profile list.
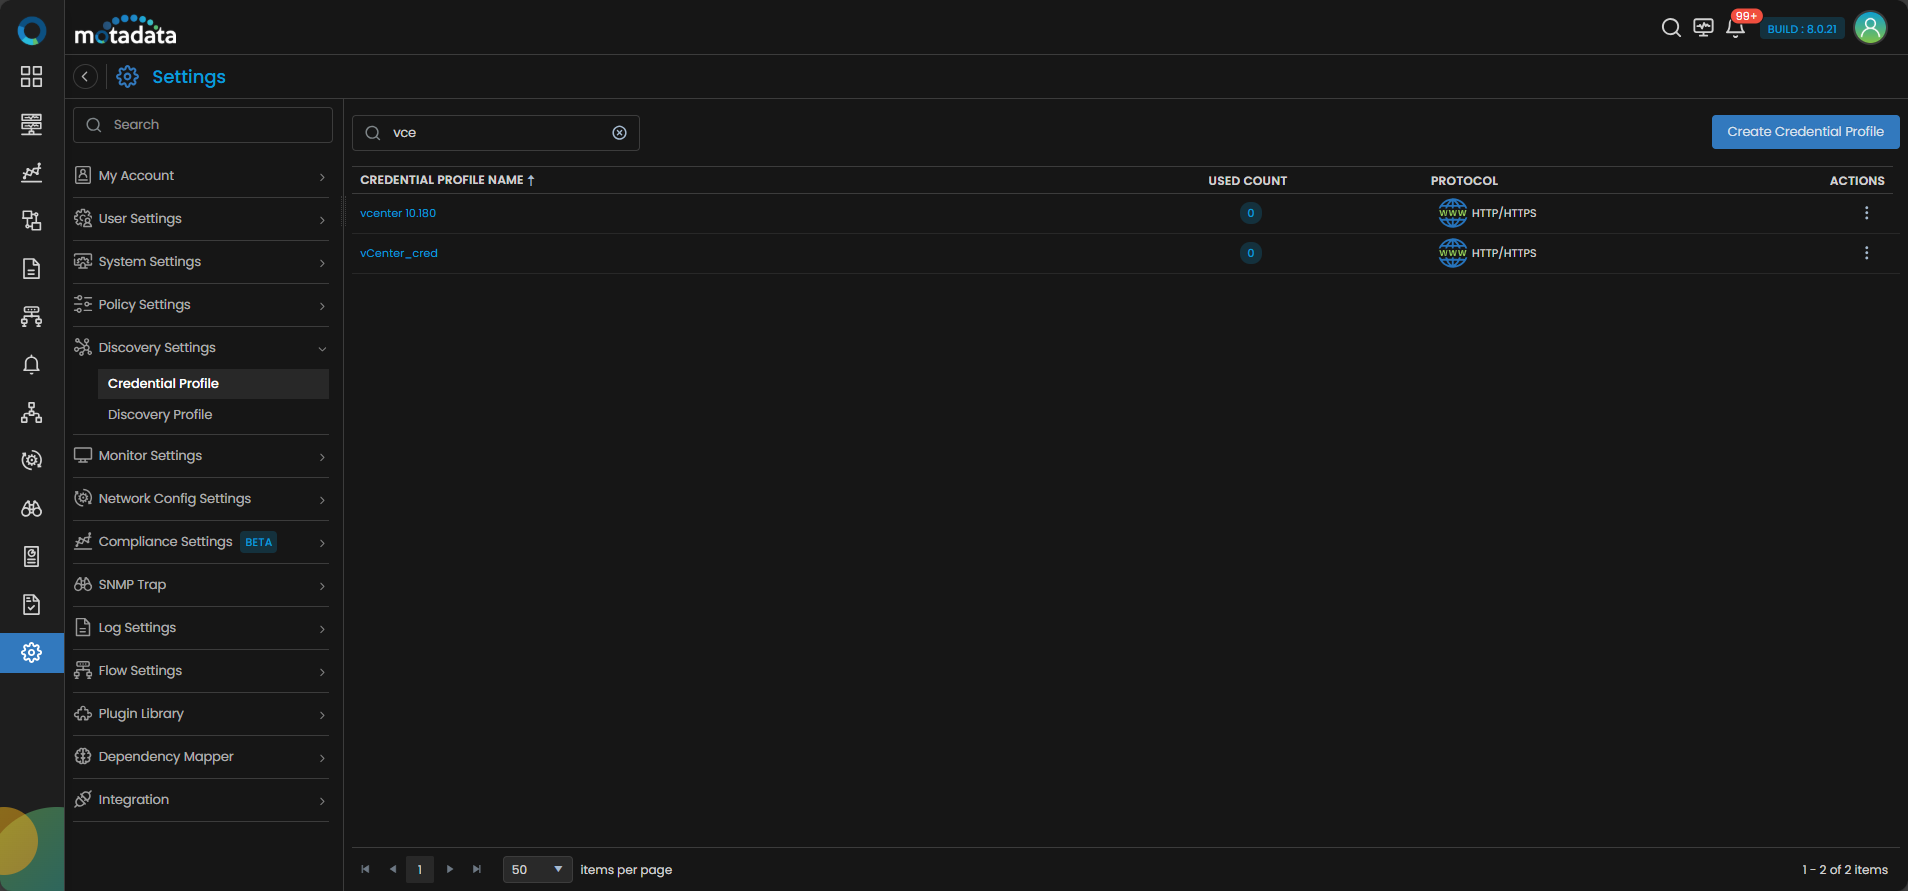
2. Create a Discovery Profile
Go to Menu. Select Settings . Select Discovery Settings . Select Discovery Profile. The Discovery Profile screen opens. Select Create Discovery Profile.
The Create Discovery Profile form opens. Select Virtualization from the sidebar. Select vCenter.
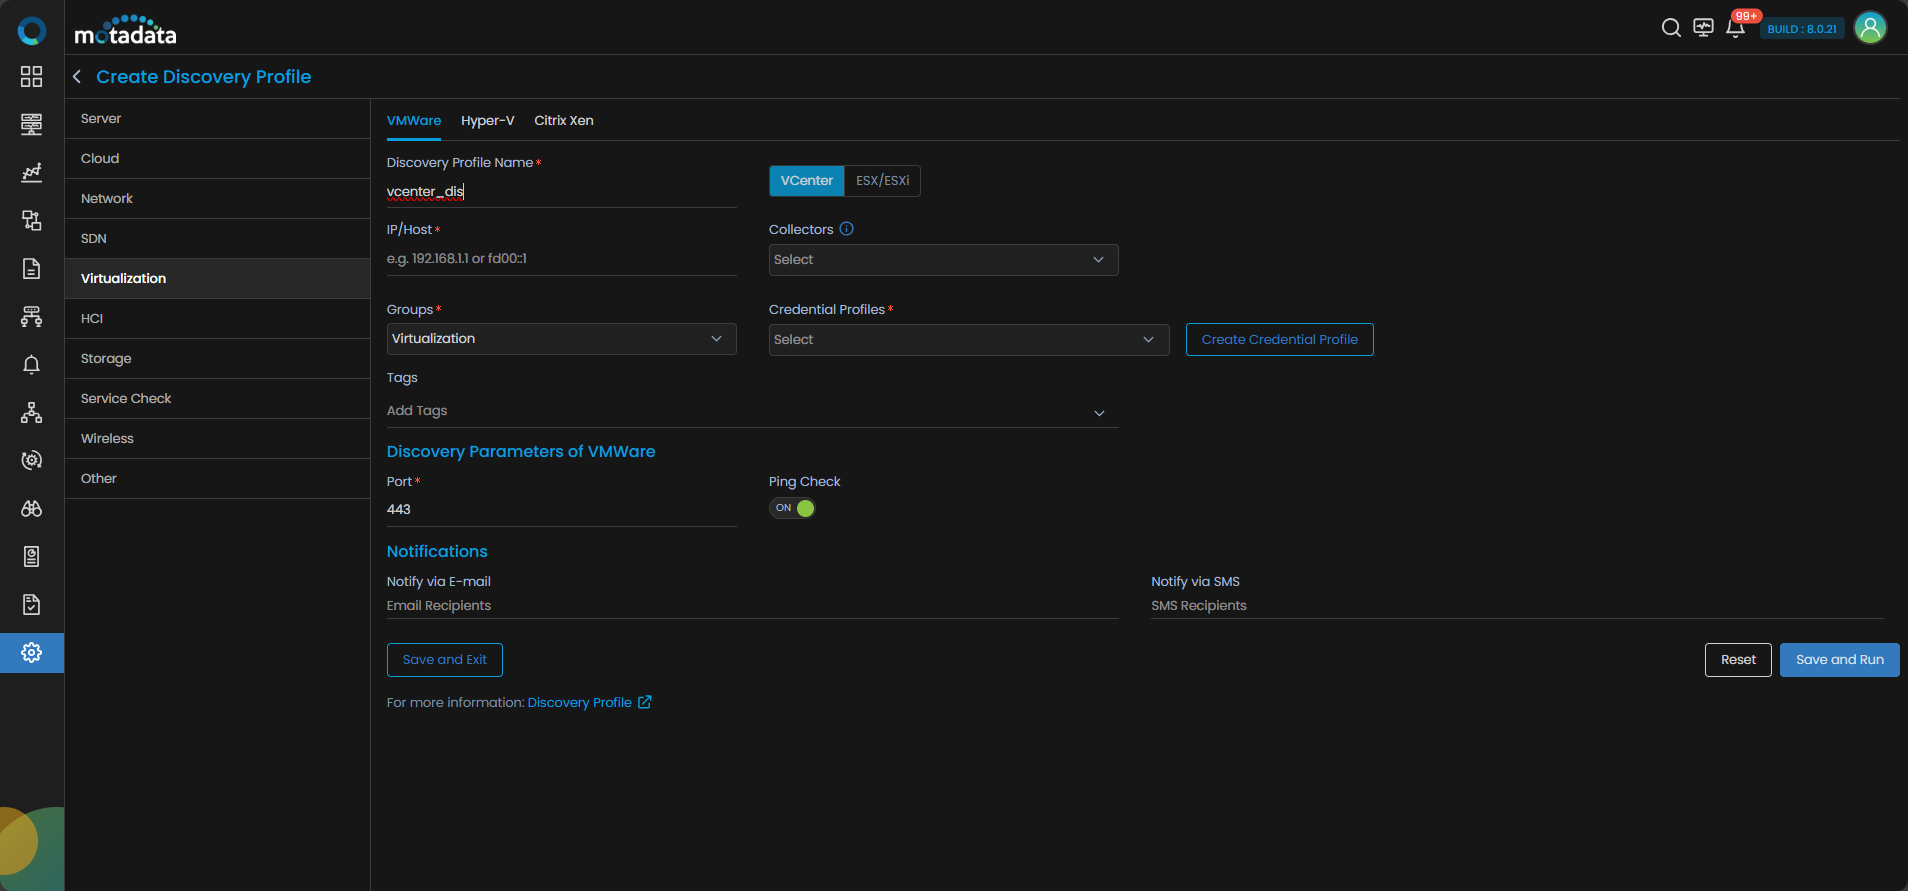
| Field | What to Enter |
|---|---|
| Discovery Profile Name | A unique name to identify this profile |
| IP / Host | The IP address or hostname of the vCenter server |
| Collectors | One or more Collectors for data collection. If you skip this, ObserveOps selects a Collector automatically. |
| Groups | One or more Groups to assign to provisioned monitors |
| Credential Profile | Select the vCenter credential profile you just created |
| Tags | Tags to assign to discovered devices |
| Port | Pre-populated. No change needed. |
| Ping Check | On by default. Toggle off to discover devices that don't respond to ping. |
| Notify Team | Email addresses, handles, or user profiles to notify when discovery completes |
Select Collectors based on how you want to distribute the monitoring load.
Select Save and Run to save and start discovery immediately. Select Save and Exit to save without running.
3. Provision the Discovered Devices as Monitors
After the discovery run completes, ObserveOps shows all discovered components.

Select the components you want to add as Monitors.

The Provisioning screen shows three tabs: vCenter, ESXi Host, and Virtual Machine. Each tab lets you select and provision components individually.
To assign credential profiles to ESXi Host or Virtual Machine components:
Select the Select Credential Profile option on the relevant tab. You can assign to individual devices or select multiple checkboxes to assign in bulk.
You can assign credential profiles to multiple ESXi Hosts at once by selecting their checkboxes.
A side panel opens where you assign a credential profile, create a new one, and set the port. ObserveOps tests the profile automatically. A green success message confirms it worked. A red error message means the assignment failed.
Select Add Selected Objects to provision the selected components as monitors.
- vCenter appears under Virtualization in the vCenter section.
- ESXi Hosts appear under Virtualization in the VMware ESXi section.
- Virtual Machines appear under Virtualization with their associated vCenter or VMware ESXi host, and also under Server & Apps when provisioned with a credential profile.
ESXi Hosts are auto-tagged with datacenter, cluster, vcenter, esxi, and depends_on. Virtual Machines get the tags esxi_host, type:vm, os, depends_on, and hypervisor:esxi. During vMotion, the assigned ESXi tag on VMs updates automatically during polling.
To view the monitors, go to Menu. Select Monitor. Select Virtualization.

The vCenter devices are now added to ObserveOps.
Adding a Hyper-V Host
1. Create a Credential Profile
Go to Menu. Select Settings . Select Discovery Settings . Select Credential Profile. The Credential Profile screen opens. Select Create Credential Profile.
The Create Credential Profile form opens.
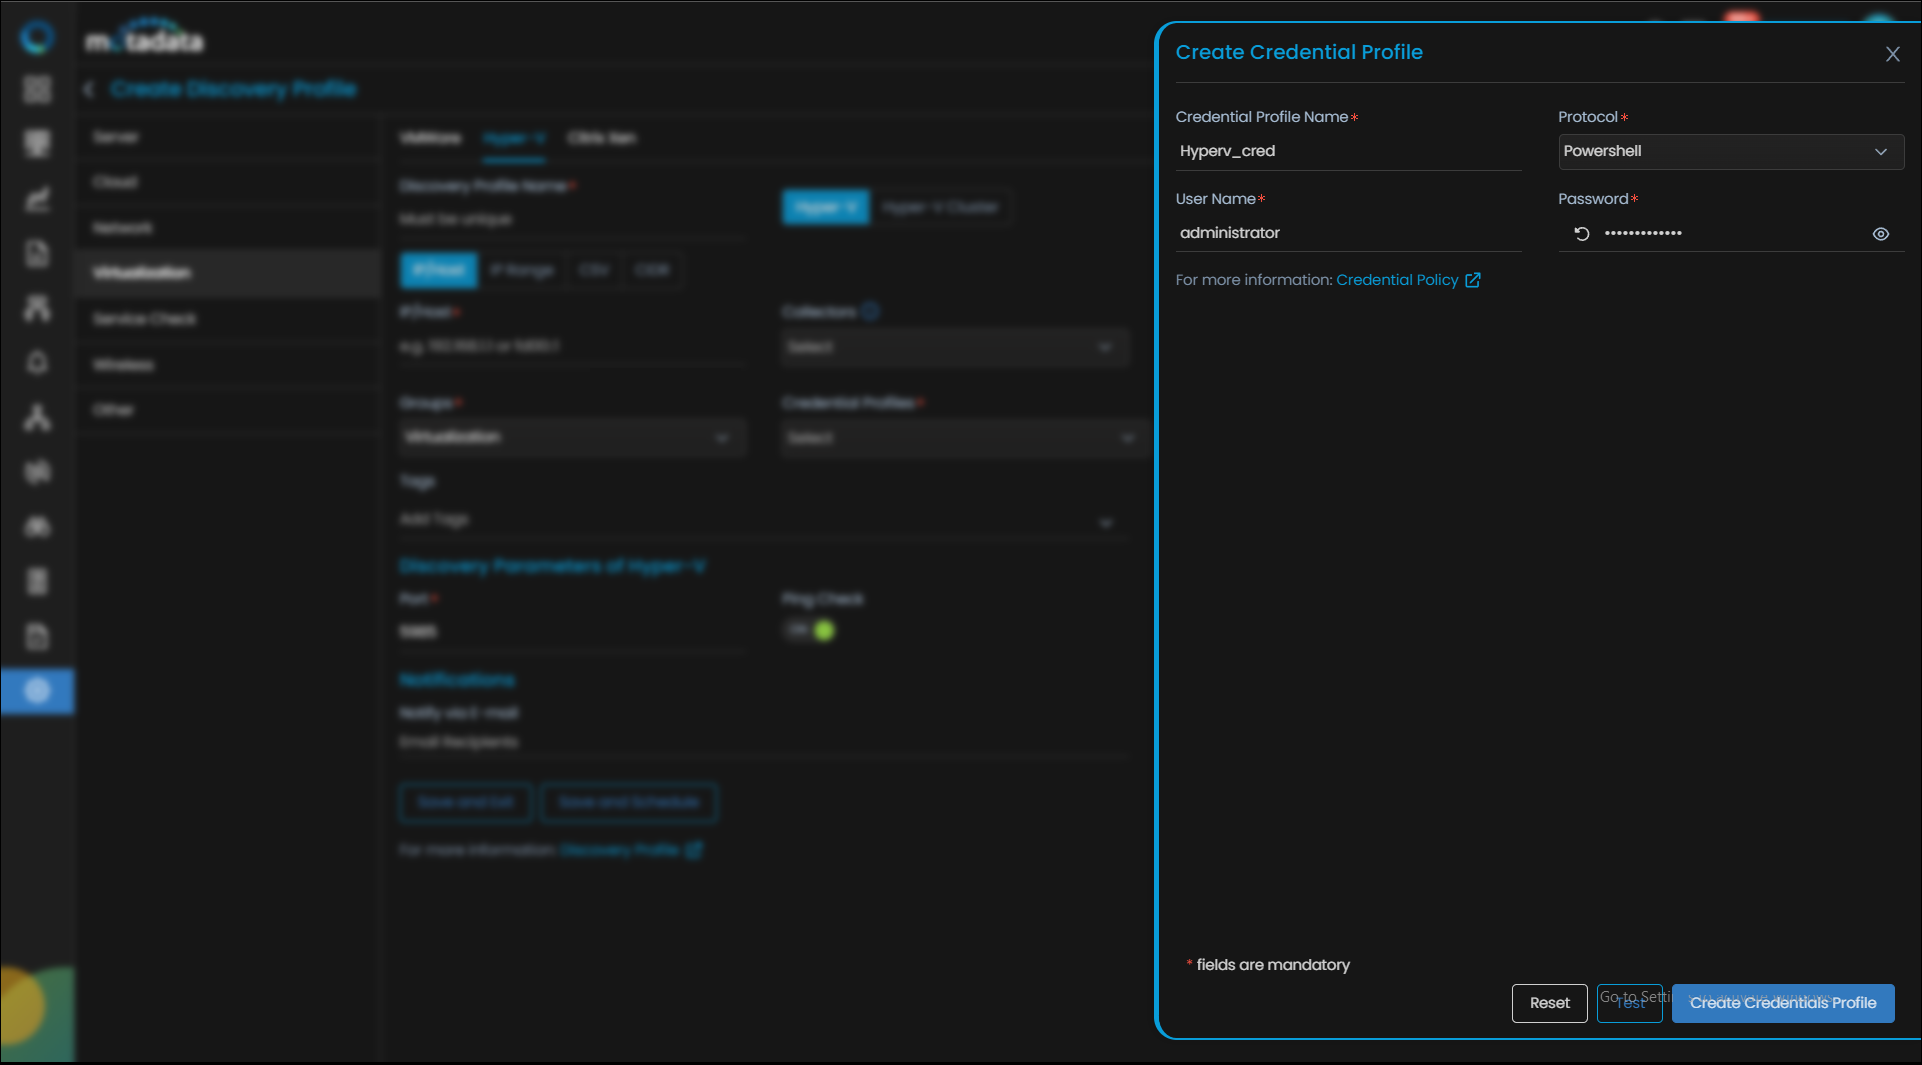
| Field | What to Enter |
|---|---|
| Credential Profile Name | A unique name to identify this profile |
| Protocol | Select Powershell |
| Username | The Windows account username with PowerShell remoting access |
| Password | The password for that account |
Select Reset to clear all fields. Select Add Credential Profile to save.
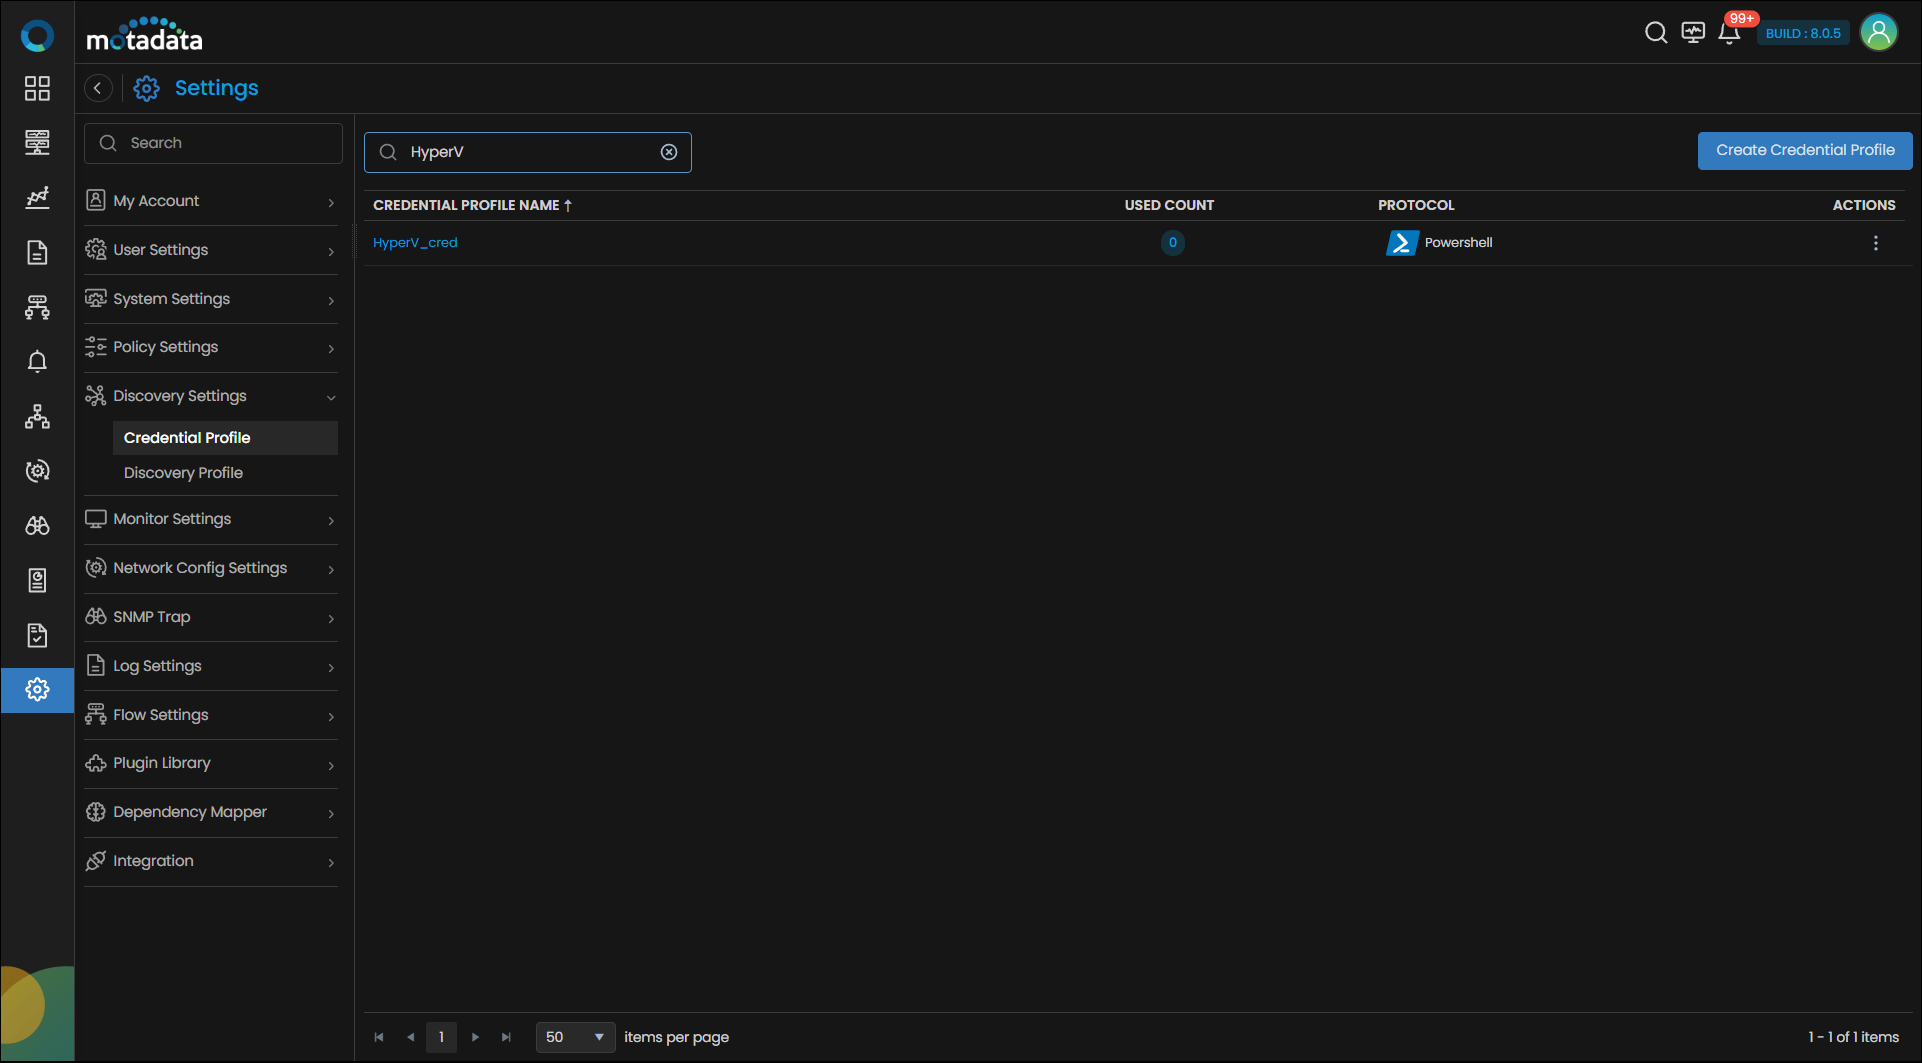
The profile now appears in the Credential Profile list.
2. Create a Discovery Profile
Go to Menu. Select Settings . Select Discovery Settings . Select Discovery Profile. The Discovery Profile screen opens. Select Create Discovery Profile.
The Create Discovery Profile form opens. Select Virtualization from the sidebar. Select the Hyper-V tab.
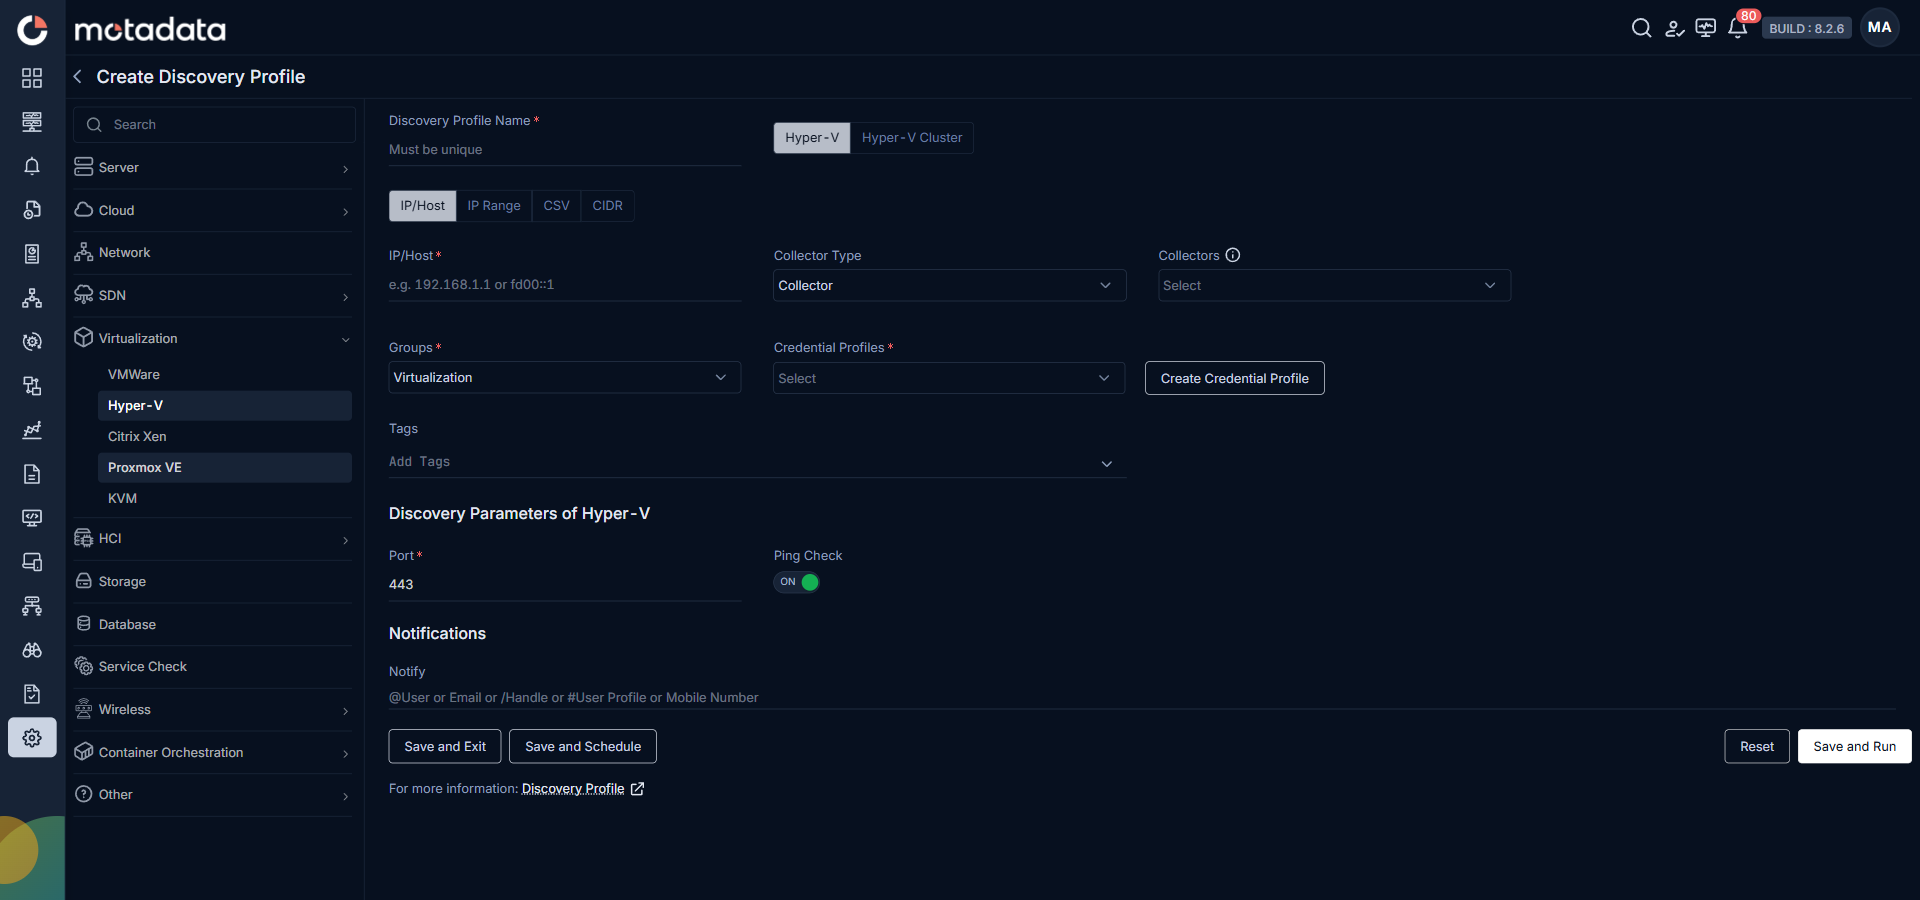
| Field | What to Enter |
|---|---|
| Discovery Profile Name | A unique name to identify this profile |
| IP / Host / IP Range / CIDR / CSV | The address or address range of your Hyper-V hosts |
| Collectors | One or more Collectors for data collection. If you skip this, ObserveOps selects a Collector automatically. |
| Groups | One or more Groups to assign to provisioned monitors |
| Credential Profile | Select the Powershell credential profile you just created |
| Tags | Tags to assign to discovered devices |
| Port | Pre-populated. No change needed. |
| Ping Check | On by default. Toggle off to discover devices that don't respond to ping. |
| Notify Team | Email addresses, handles, or user profiles to notify when discovery completes |
Select Collectors based on how you want to distribute the monitoring load.
Select Save and Run to save and start discovery immediately. Select Save and Exit to save without running. Select Save and Schedule to schedule discovery for a specific time.
3. Provision the Discovered Devices as Monitors
After discovery starts, ObserveOps scans the specified Hyper-V hosts.
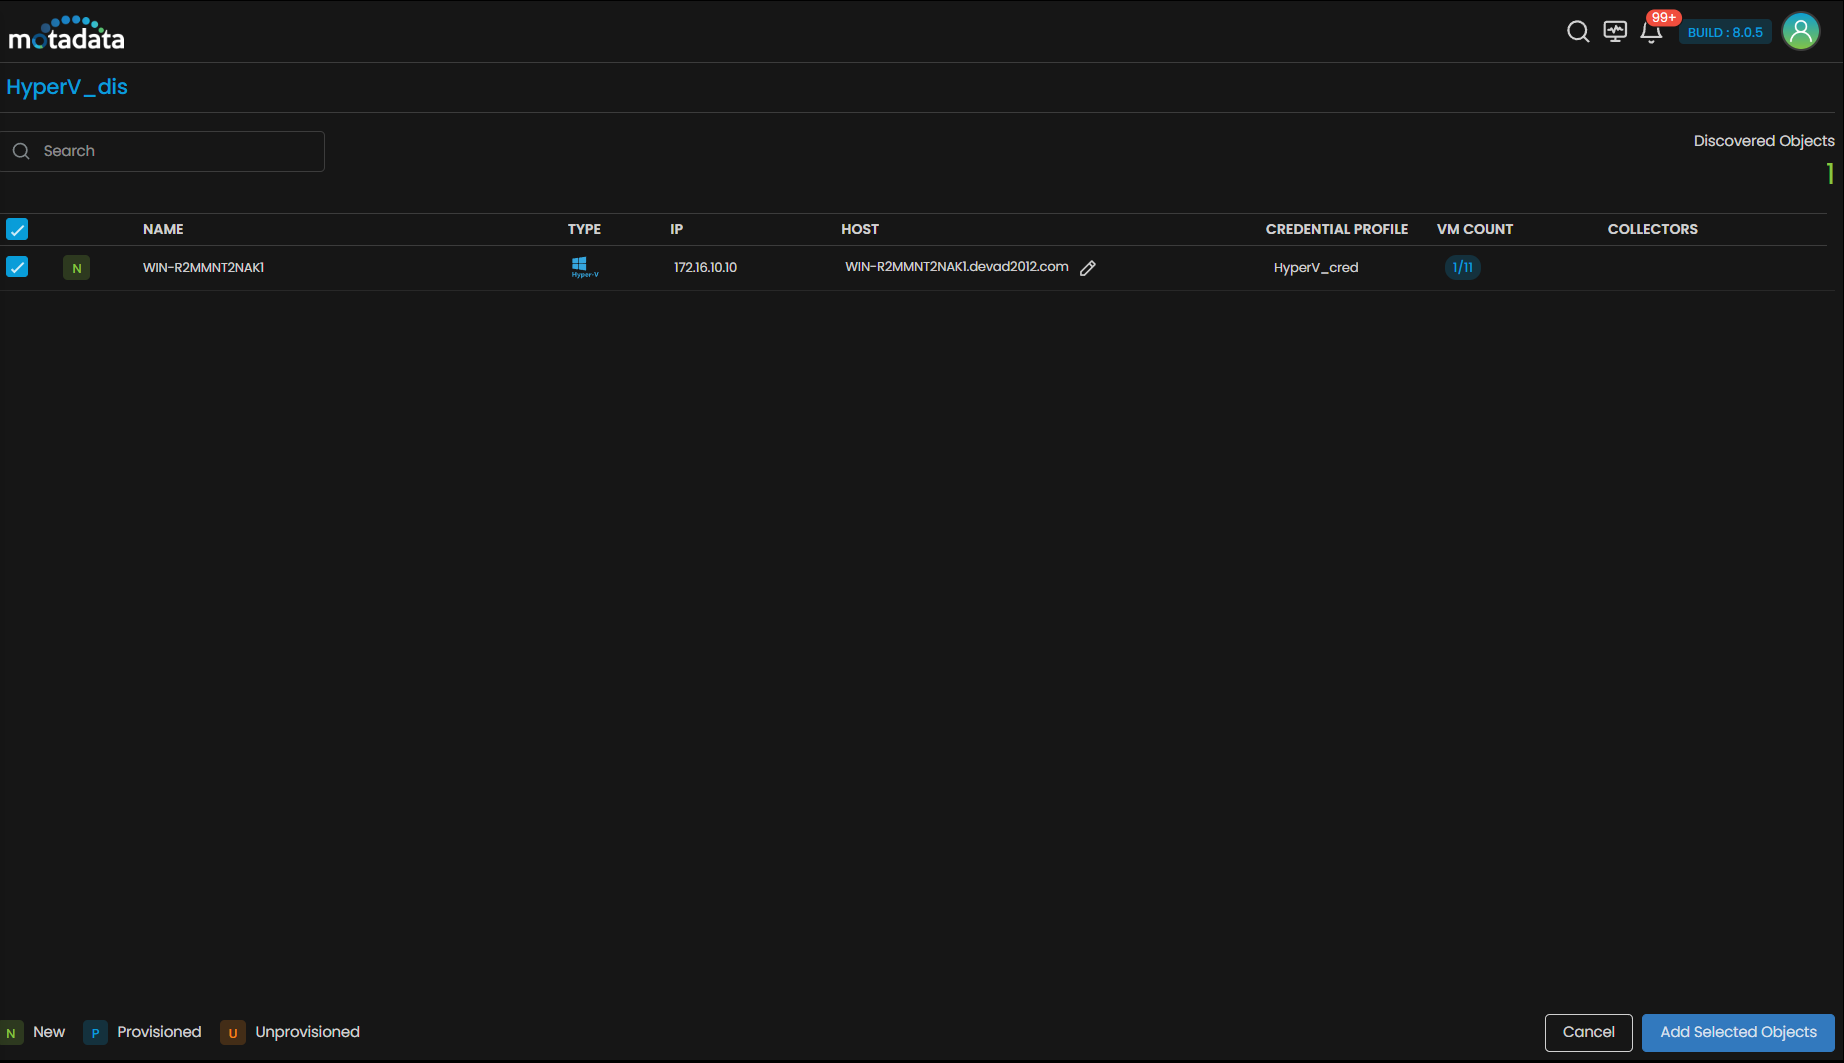
When the run completes, ObserveOps shows all discovered devices. Select the ones you want to add as Monitors.
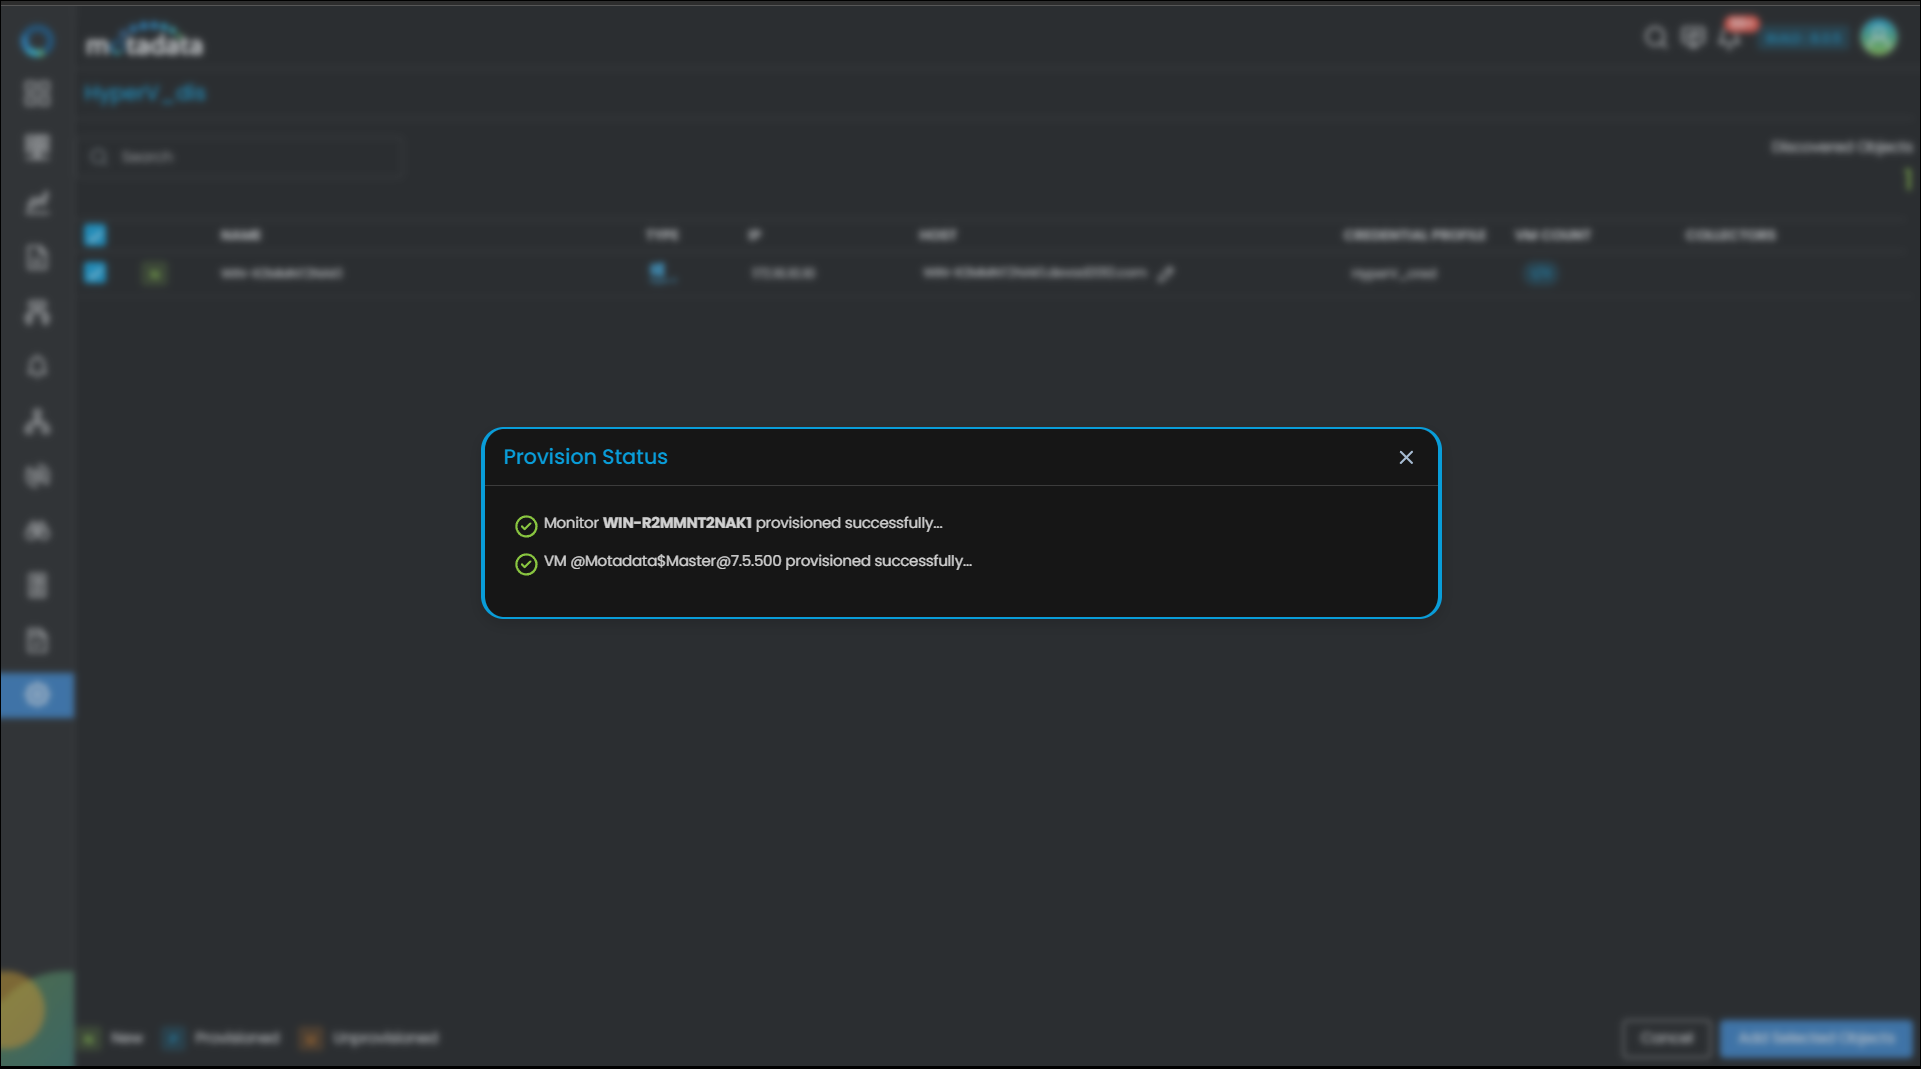
Select Add Selected Objects to provision the selected devices as monitors. ObserveOps now collects metrics continuously.
To view the monitors, go to Menu. Select Monitor. Select Virtualization.
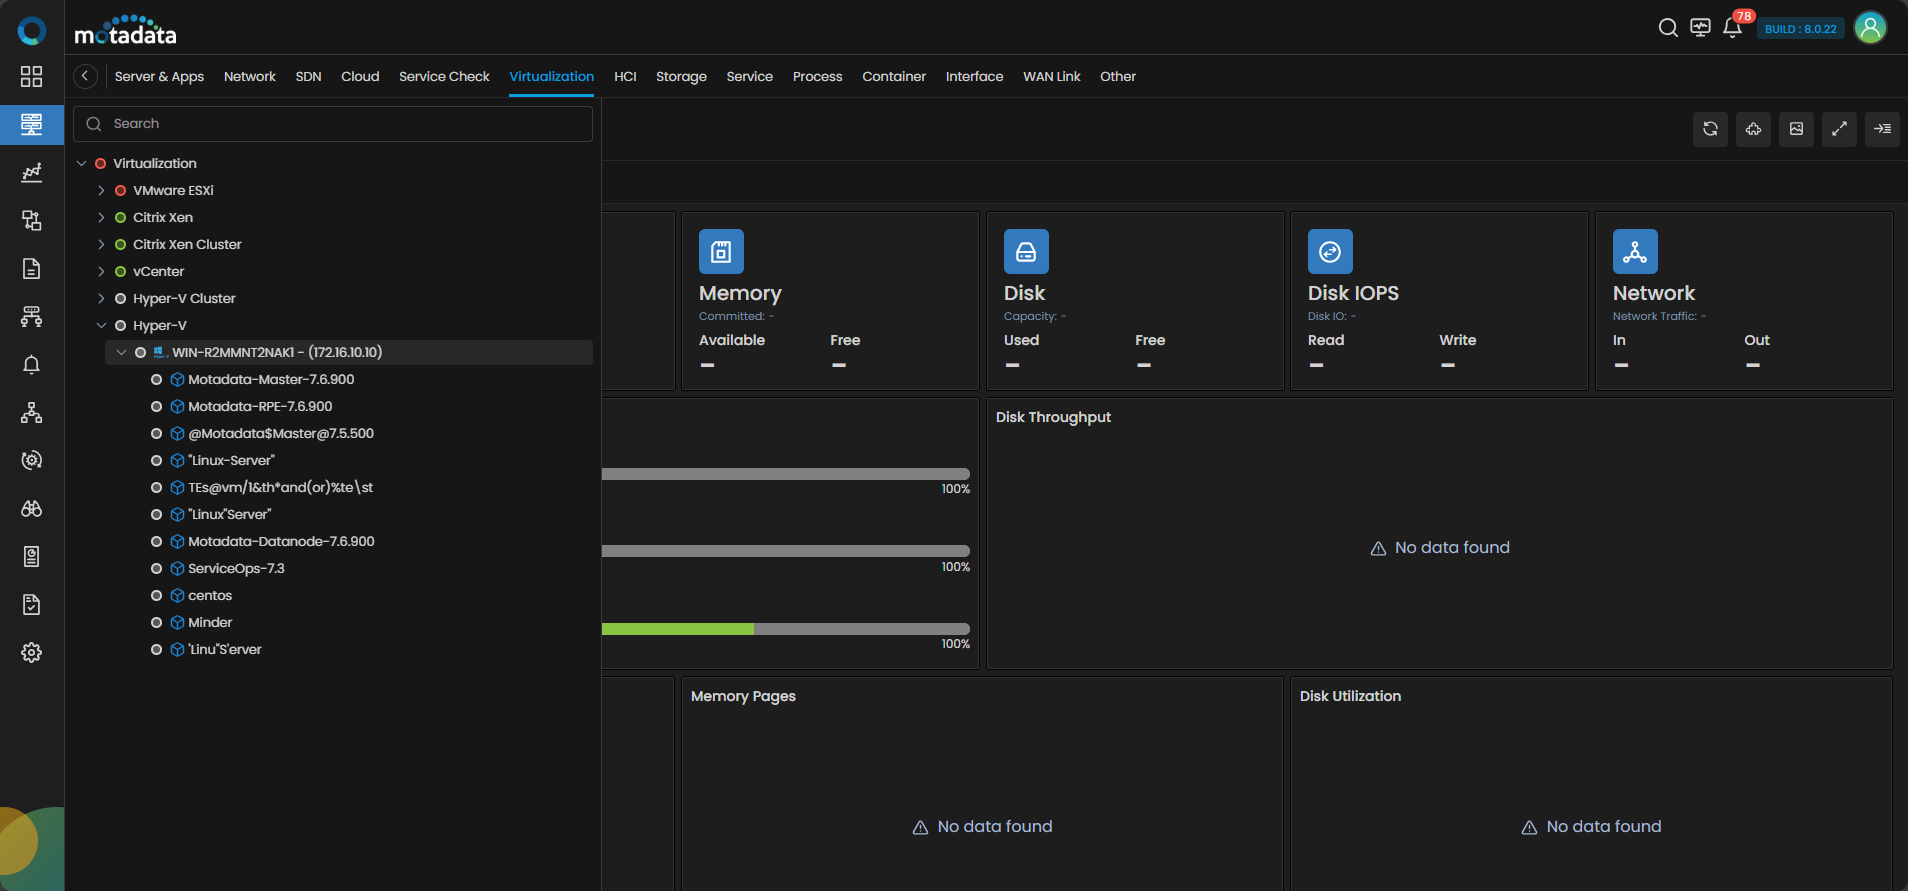
The Hyper-V hosts are now added to ObserveOps.
Adding a Hyper-V Cluster
1. Create a Credential Profile
Go to Menu. Select Settings . Select Discovery Settings . Select Credential Profile. The Credential Profile screen opens. Select Create Credential Profile.
The Create Credential Profile form opens.
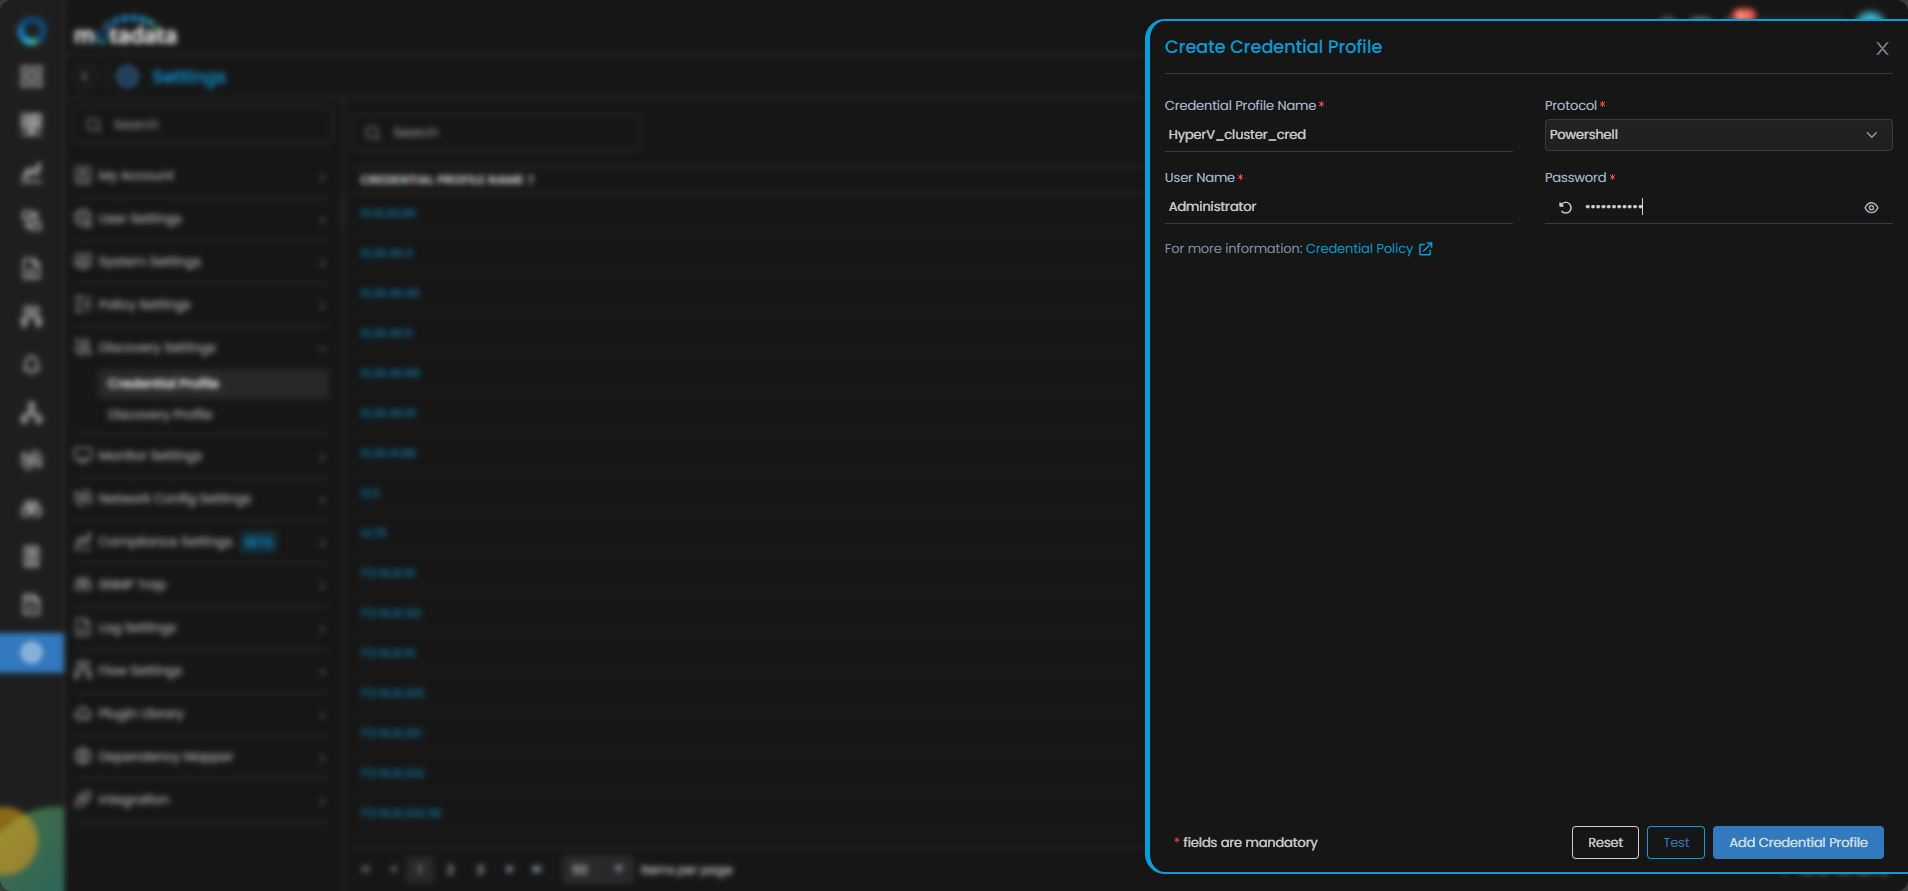
| Field | What to Enter |
|---|---|
| Credential Profile Name | A unique name to identify this profile |
| Protocol | Select Powershell |
| Username | The Windows account username with PowerShell remoting access |
| Password | The password for that account |
Select Reset to clear all fields. Select Add Credential Profile to save.
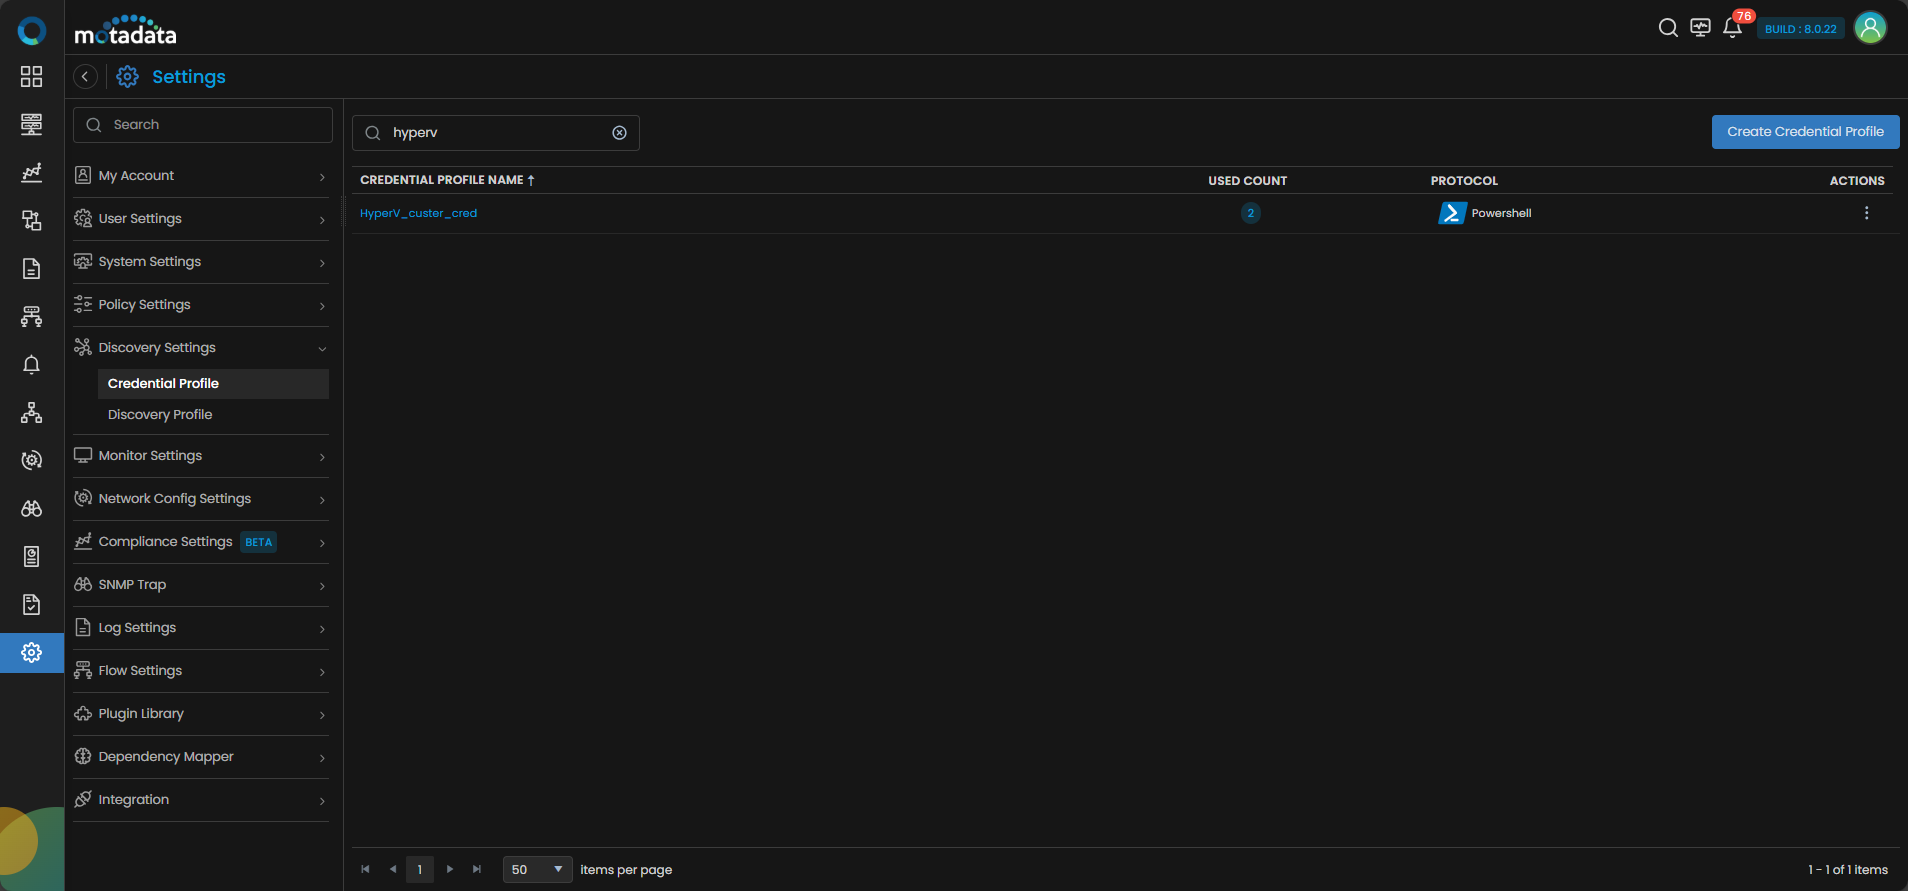
The profile now appears in the Credential Profile list.
2. Create a Discovery Profile
Go to Menu. Select Settings . Select Discovery Settings . Select Discovery Profile. The Discovery Profile screen opens. Select Create Discovery Profile.
The Create Discovery Profile form opens. Select Virtualization from the sidebar. Select the Hyper-V tab, then select Hyper-V Cluster.
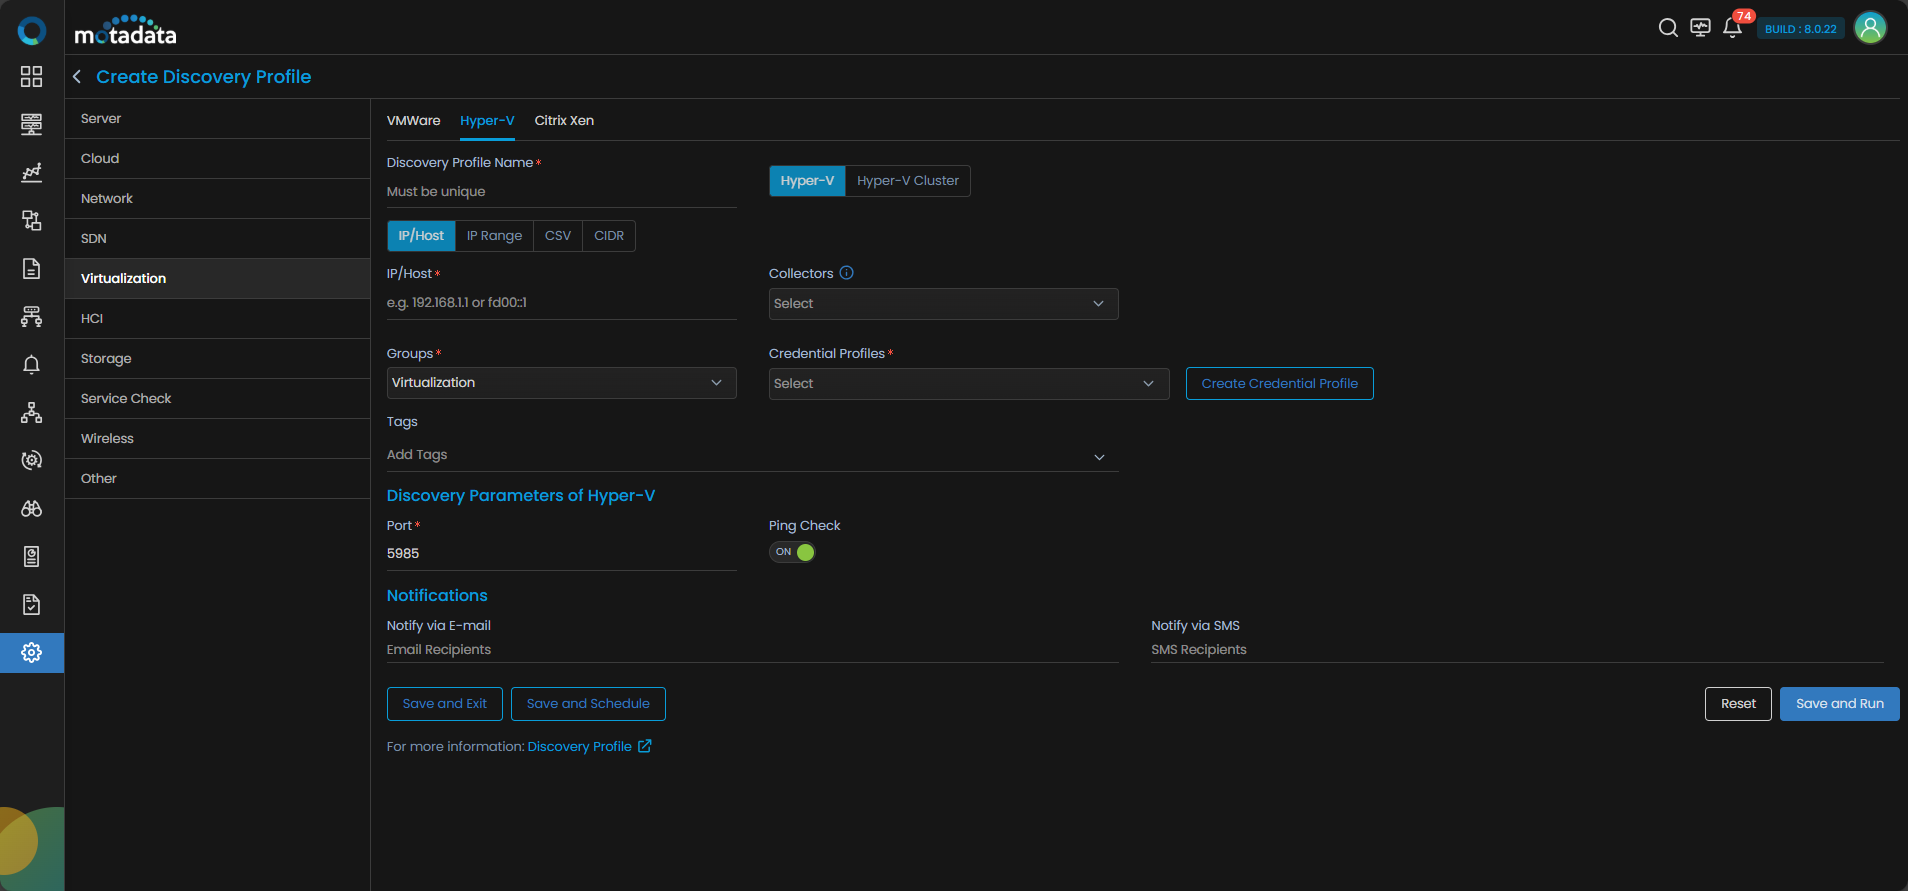
| Field | What to Enter |
|---|---|
| Discovery Profile Name | A unique name to identify this profile |
| IP / Host | The IP address or hostname of the cluster |
| Collectors | One or more Collectors for data collection. If you skip this, ObserveOps selects a Collector automatically. |
| Groups | One or more Groups to assign to provisioned monitors |
| Credential Profile | Select the Powershell credential profile you just created |
| Tags | Tags to assign to discovered devices |
| Port | Pre-populated. No change needed. |
| Ping Check | On by default. Toggle off to discover devices that don't respond to ping. |
| Notify Team | Email addresses, handles, or user profiles to notify when discovery completes |
Select Collectors based on how you want to distribute the monitoring load.
Select Save and Run to save and start discovery immediately. Select Save and Exit to save without running.
3. Provision the Discovered Devices as Monitors
After the discovery run completes, ObserveOps shows all discovered components.
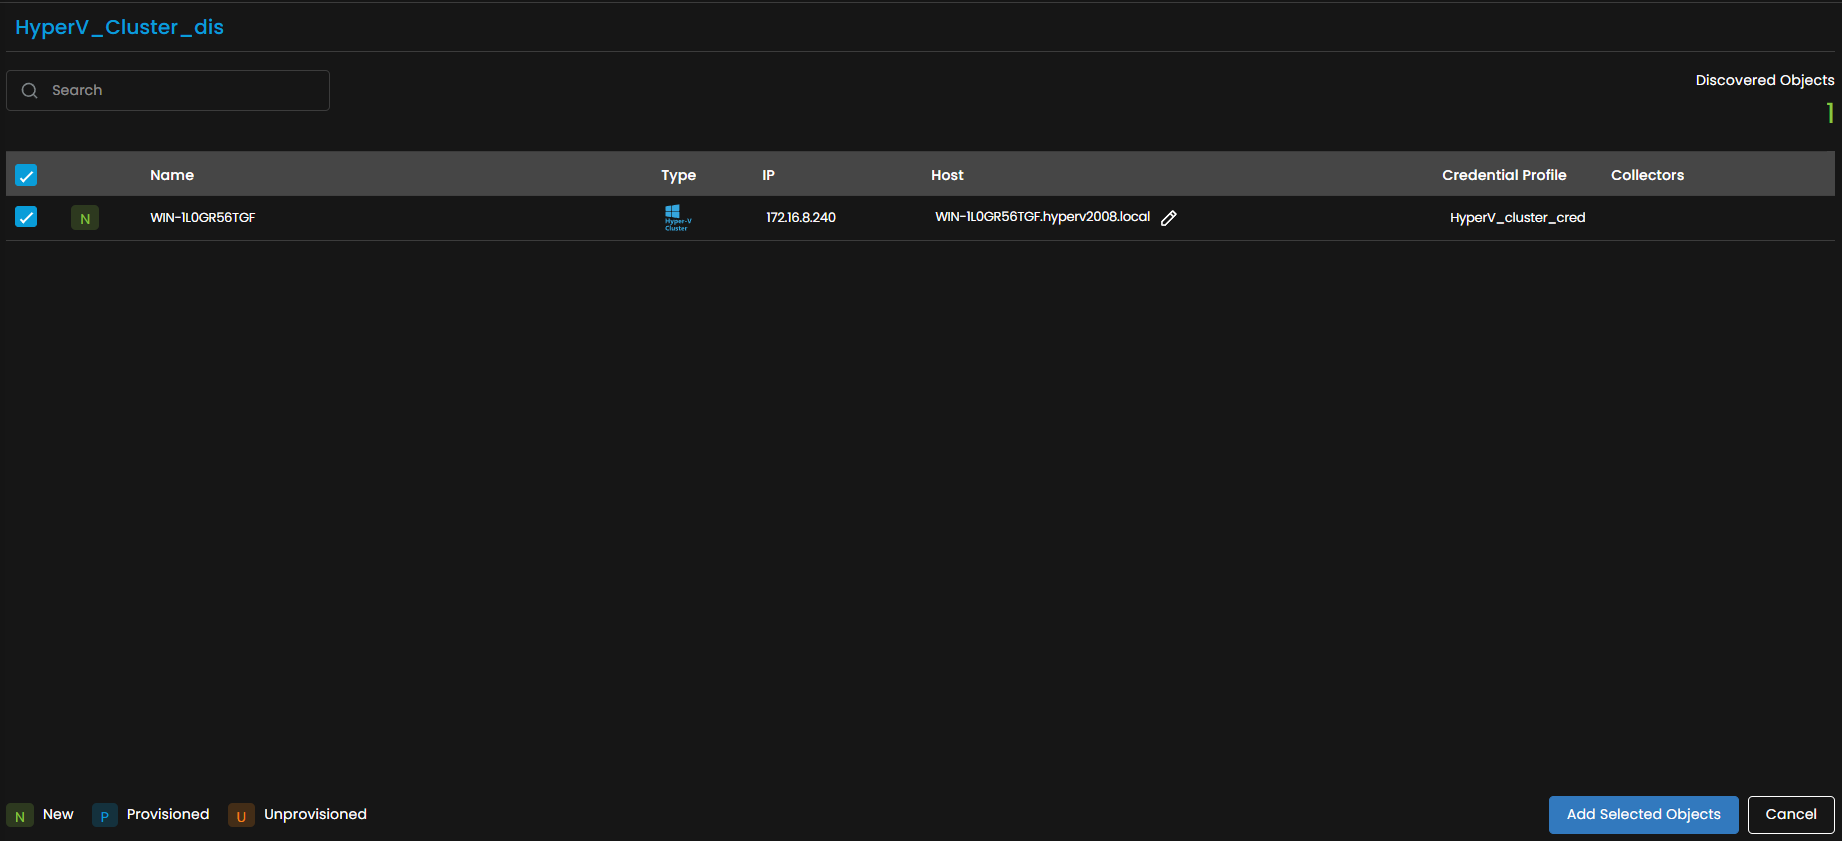
Select the components you want to add as Monitors.

The Provisioning screen shows three tabs: Hyper-V Failover Cluster, Hyper-V Host, and Virtual Machine. Each tab lets you select and provision components individually.
To assign credential profiles to Hyper-V Host or Virtual Machine components:
Select the Select Credential Profile option on the relevant tab. You can assign to individual devices or select multiple checkboxes to assign in bulk.
You can assign credential profiles to multiple Hyper-V Hosts at once by selecting their checkboxes.
A side panel opens where you assign a credential profile, create a new one, and set the port. ObserveOps tests the profile automatically. A green success message confirms it worked. A red error message means the assignment failed.
Select Add Selected Objects to provision the selected components as monitors.
- Hyper-V Failover Cluster appears under Virtualization in the Hyper-V Failover Cluster section.
- Hyper-V Hosts appear under Virtualization in the Microsoft Hyper-V section.
- Virtual Machines appear under Virtualization with their associated Hyper-V Host or Failover Cluster, and also under Server & Apps when provisioned with a credential profile.
Hyper-V Hosts are auto-tagged with datacenter, cluster, hyperv, and depends_on. Virtual Machines get the tags hyperv_host, type:vm, os, depends_on, and hypervisor:hyperv. During vMotion, the Hyper-V Host tag on VMs updates automatically during polling.
To view the monitors, go to Menu. Select Monitor. Select Virtualization.
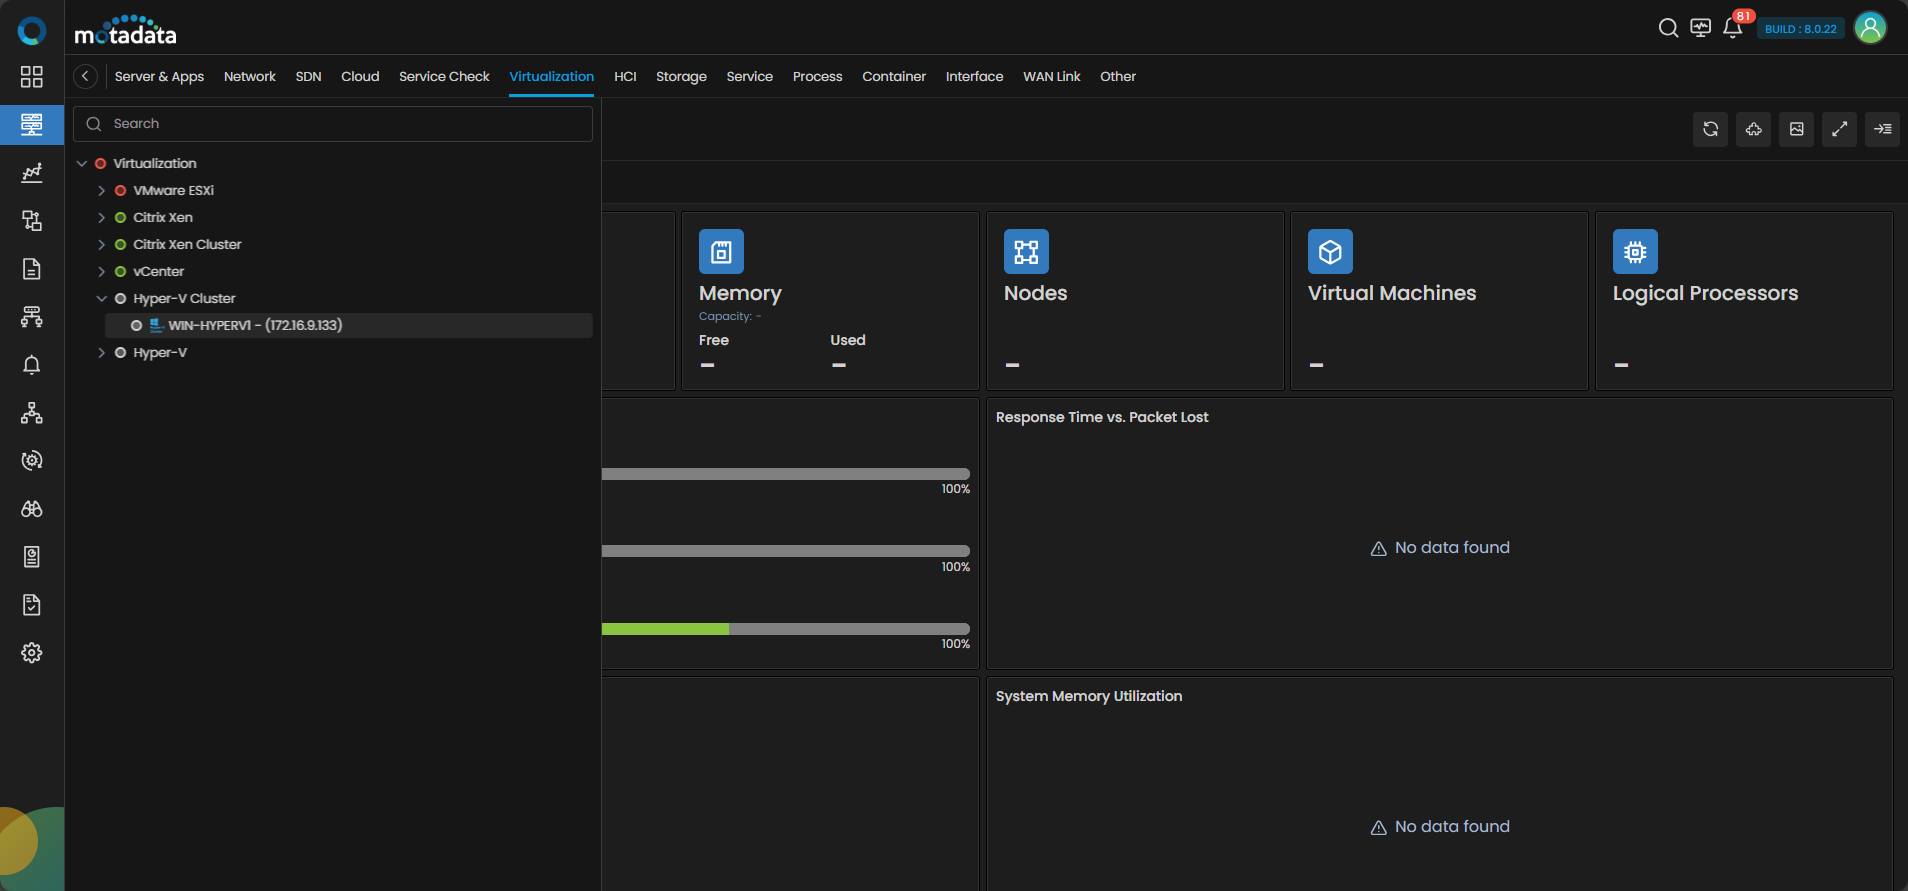
The Hyper-V Cluster devices are now added to ObserveOps.
Adding a Proxmox VE Node
1. Create a Credential Profile
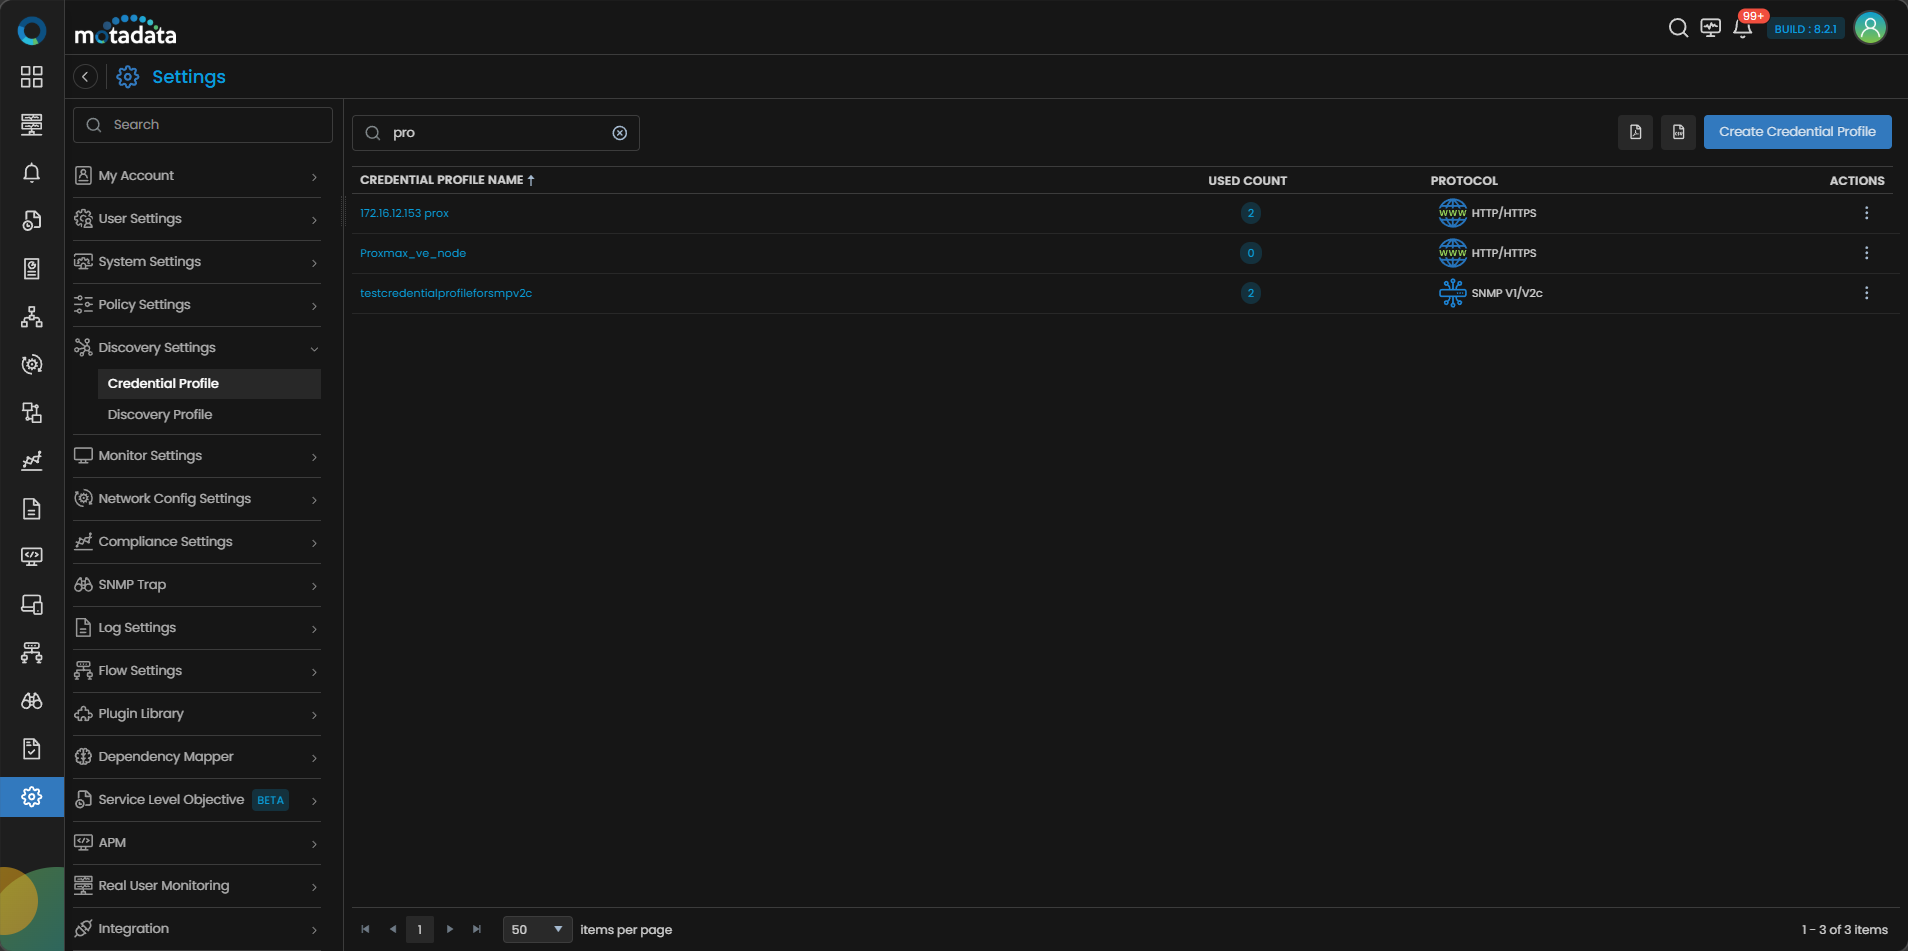
Go to Menu. Select Settings . Select Discovery Settings . Select Credential Profile. The Credential Profile screen opens. Select Create Credential Profile.
The Create Credential Profile form opens.
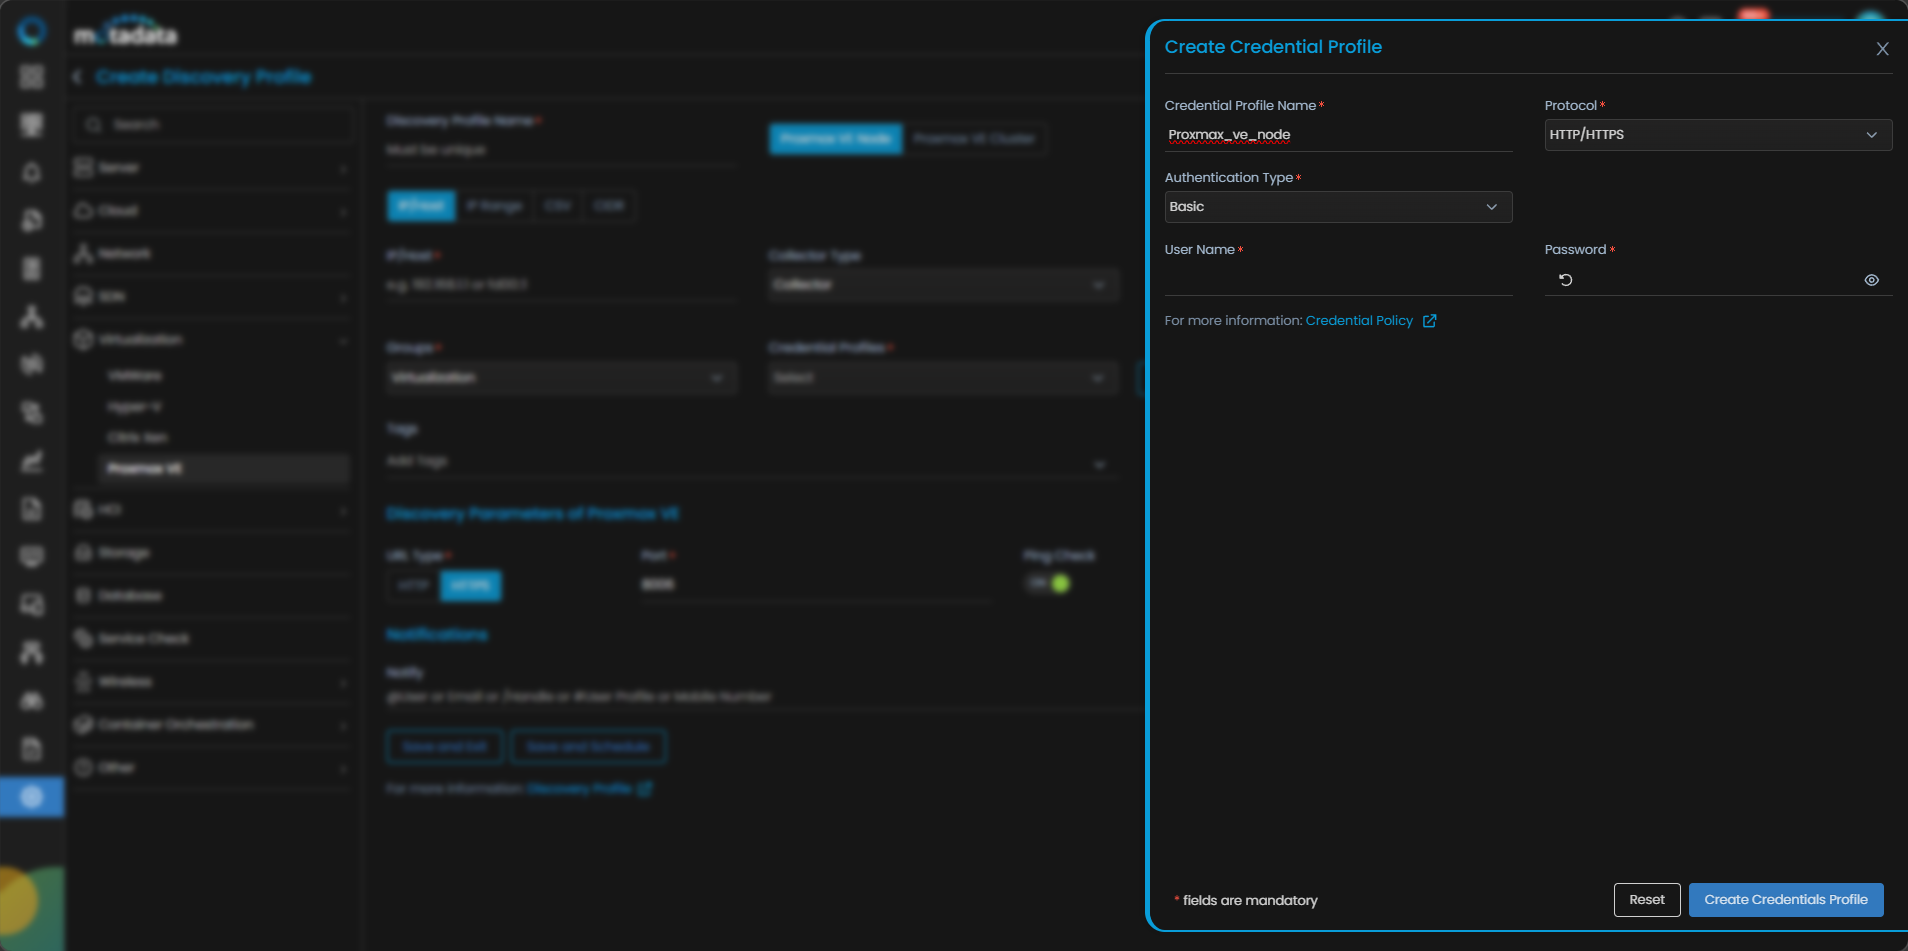
| Field | What to Enter |
|---|---|
| Credential Profile Name | A unique name to identify this profile |
| Protocol | Select HTTP/HTTPS |
| Username | The username for the Proxmox VE node |
| Password | The password for that account |
| Authentication Type | Select the authentication type configured on the node |
Select Test to verify the credentials connect to the device. Select Reset to clear all fields. Select Create Credential Profile to save.
The profile now appears in the Credential Profile list.
2. Create a Discovery Profile
Go to Menu. Select Settings . Select Discovery Settings . Select Discovery Profile. The Discovery Profile screen opens. Select Create Discovery Profile.
The Create Discovery Profile form opens. Select Virtualization from the sidebar. Select Proxmox VE Node.
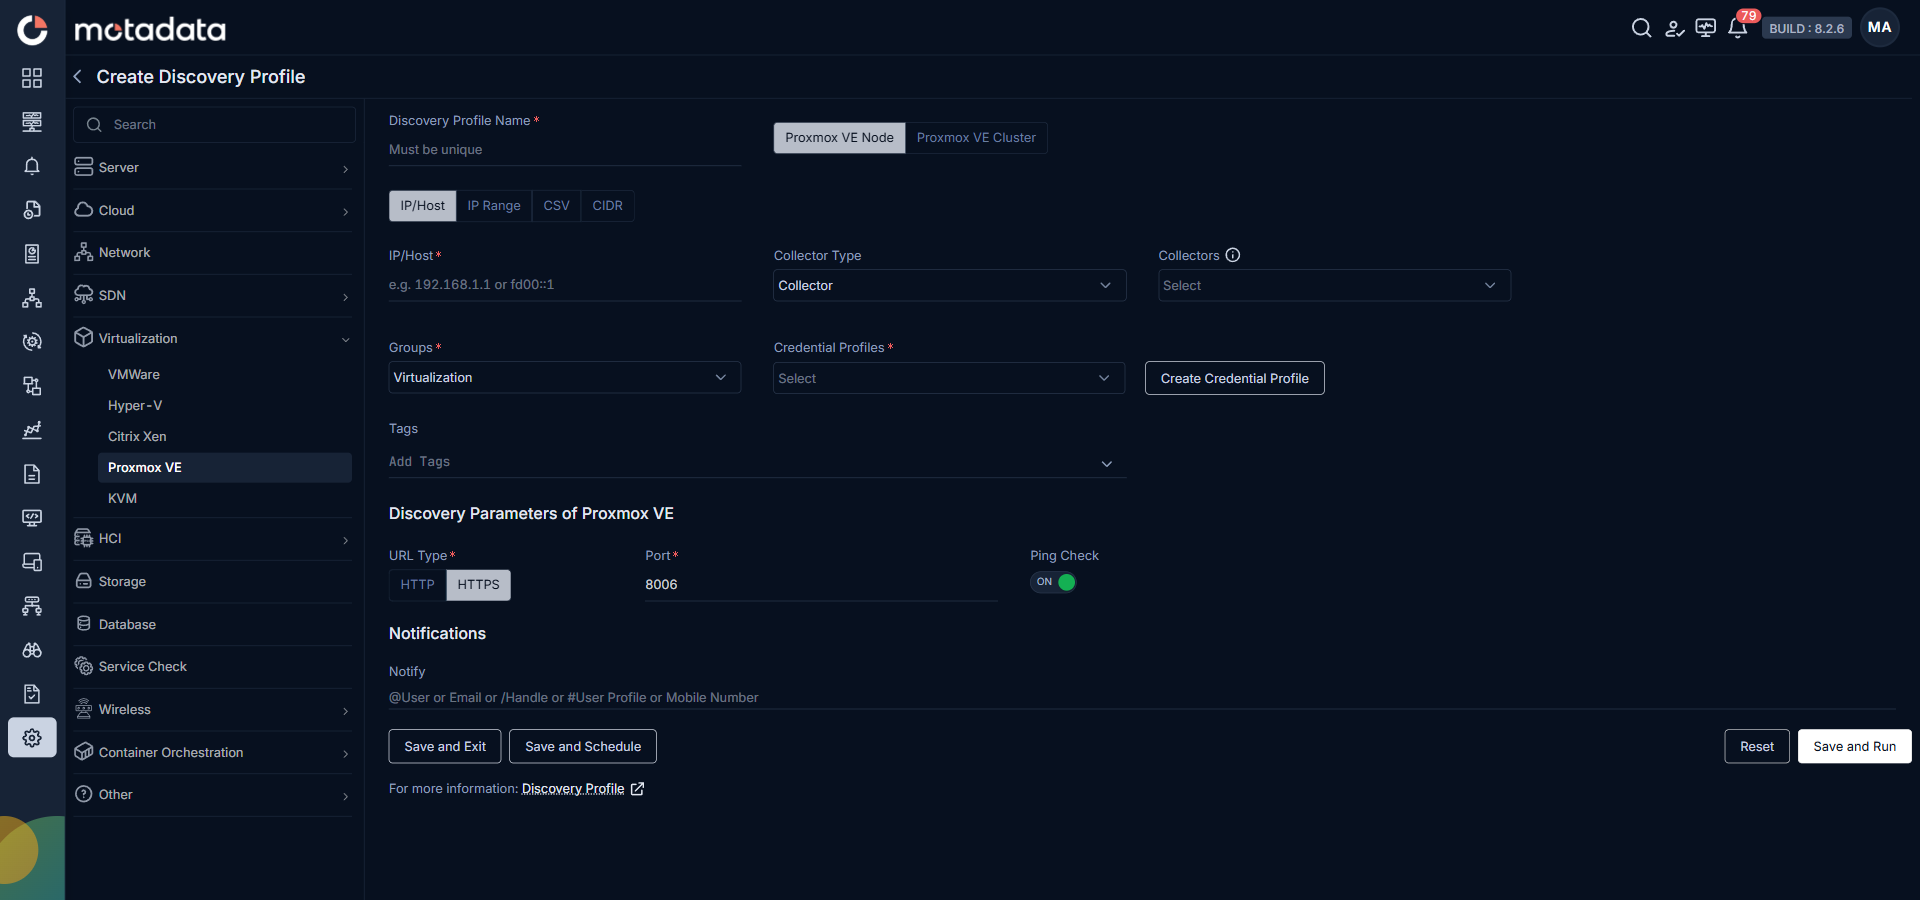
| Field | What to Enter |
|---|---|
| Discovery Profile Name | A unique name to identify this profile |
| IP / Host / IP Range / CIDR / CSV | The address or address range of your Proxmox VE nodes |
| Collectors | One or more Collectors for data collection. If you skip this, ObserveOps selects a Collector automatically. |
| Groups | One or more Groups to assign to provisioned monitors |
| Credential Profile | Select the Proxmox VE Node credential profile you just created |
| Tags | Tags to assign to discovered devices |
| Port | Pre-populated. No change needed. |
| Ping Check | On by default. Toggle off to discover devices that don't respond to ping. |
| Notify Team | Email addresses, handles, or user profiles to notify when discovery completes |
Select Collectors based on how you want to distribute the monitoring load.
Select Save and Run to save and start discovery immediately. Select Save and Exit to save without running. Select Save and Schedule to schedule discovery for a specific time.
3. Provision the Discovered Devices as Monitors
After the discovery run completes, ObserveOps shows all discovered components.
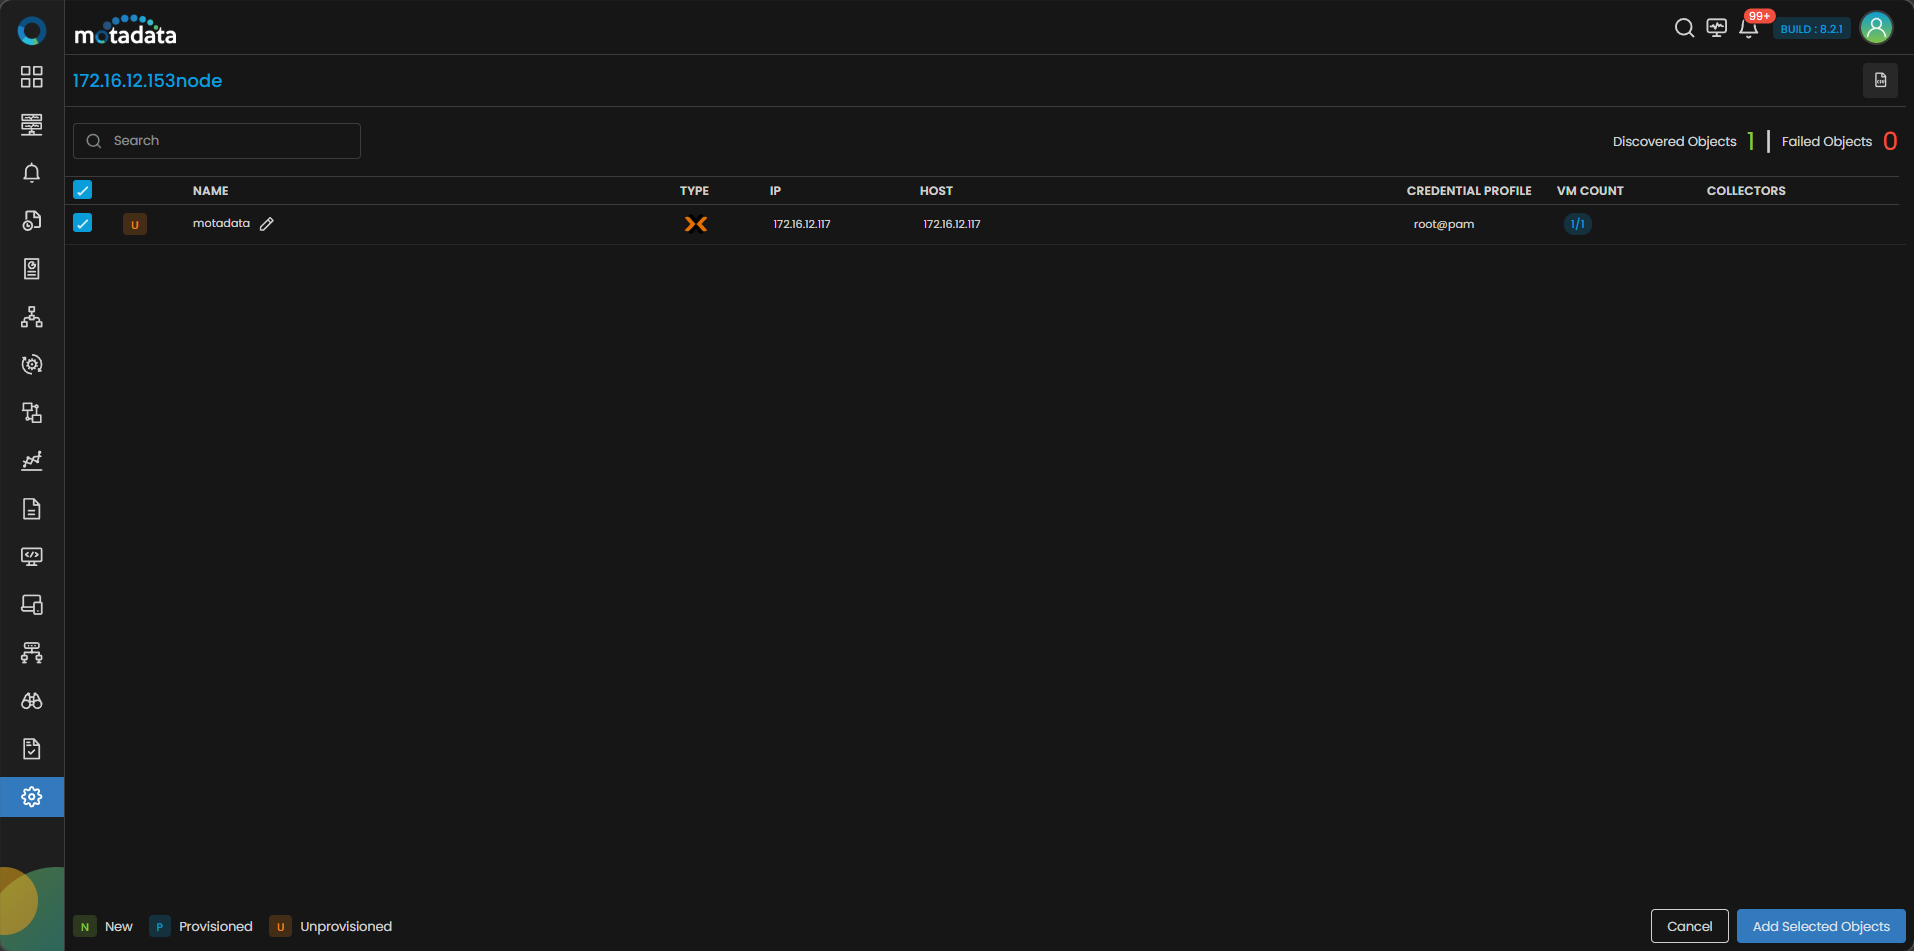
Select the devices you want to add as Monitors.
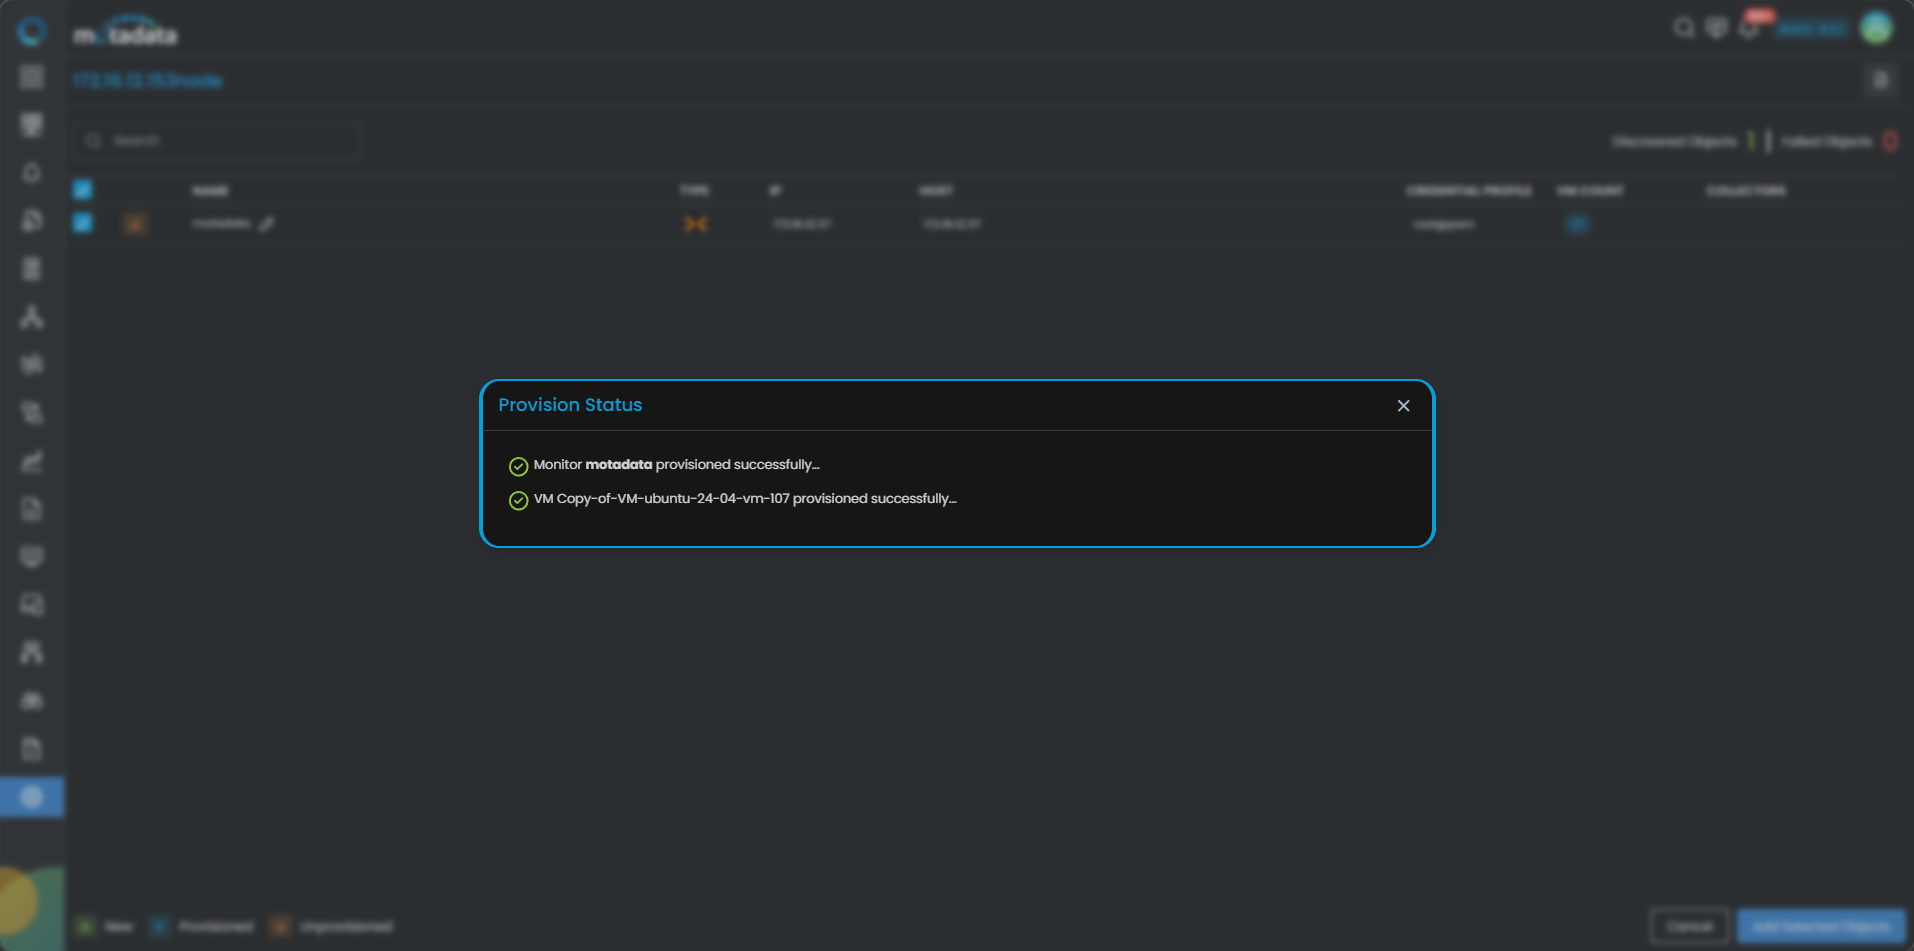
Select Add Selected Objects to provision the selected devices as monitors. ObserveOps now collects metrics continuously.
To view the monitors, go to Menu. Select Monitor. Select Virtualization.
The Proxmox VE Node devices are now added to ObserveOps.
Adding a Proxmox VE Cluster
1. Create a Credential Profile
Go to Menu. Select Settings . Select Discovery Settings . Select Credential Profile. The Credential Profile screen opens. Select Create Credential Profile.
The Create Credential Profile form opens.
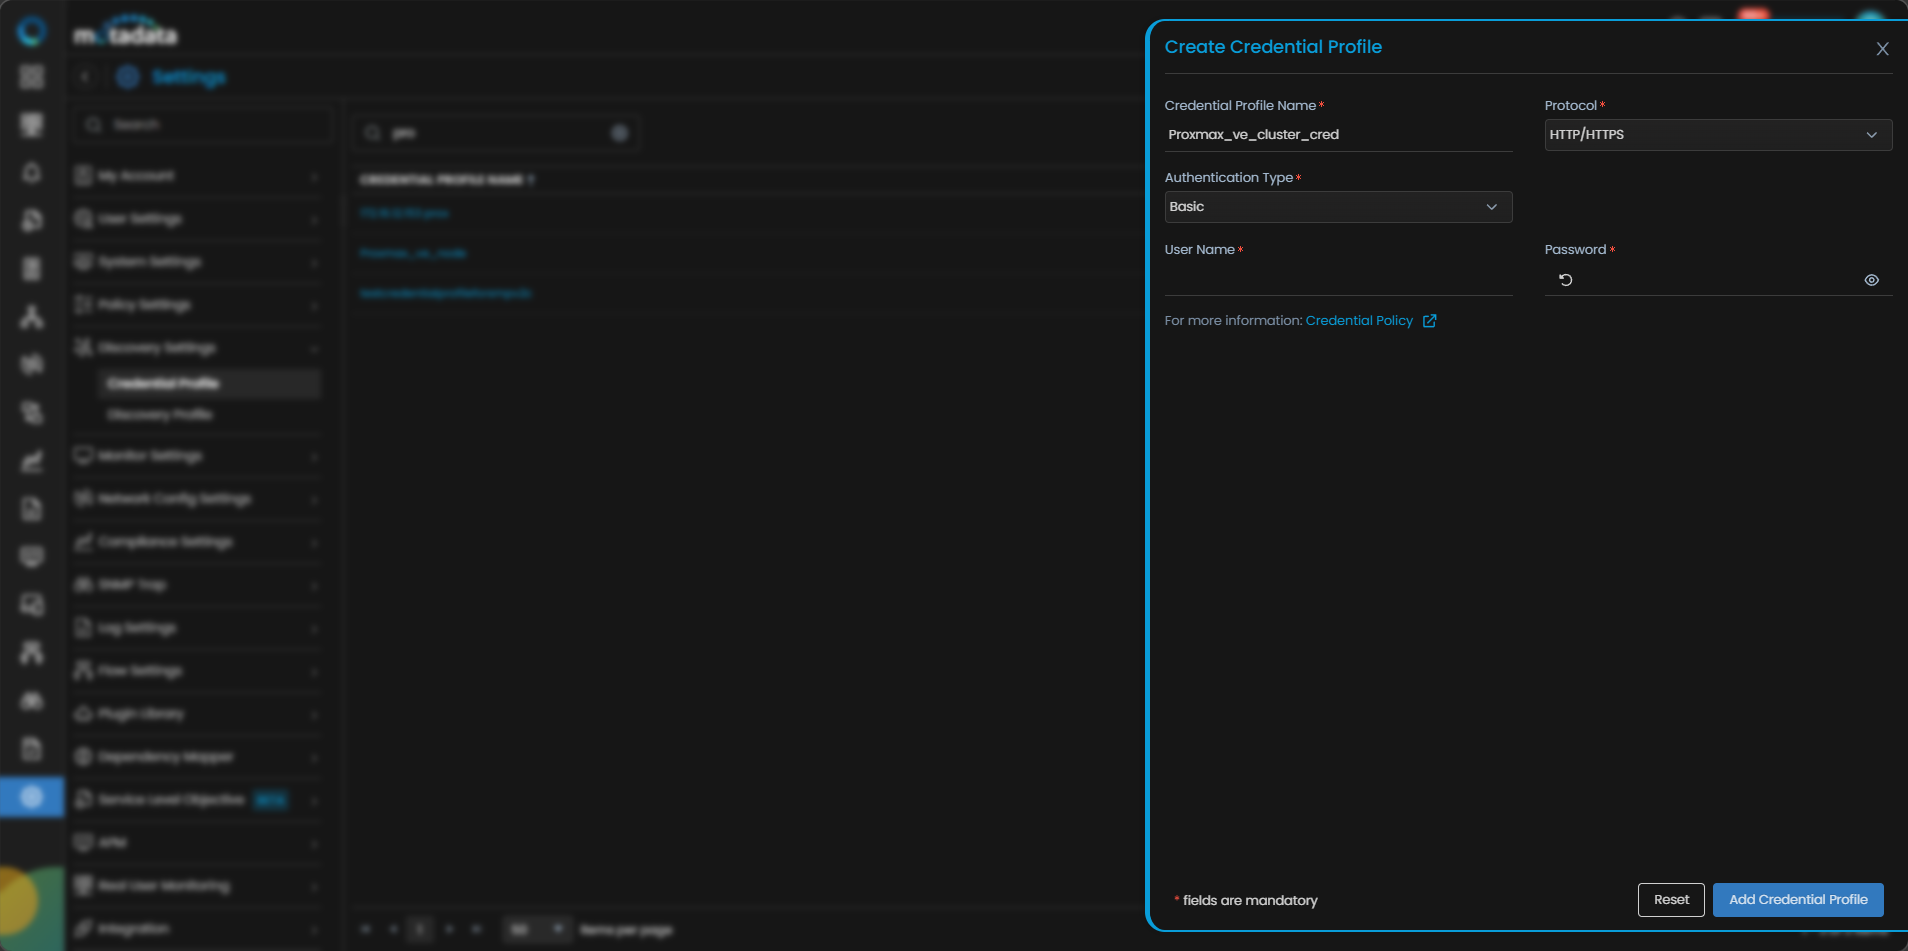
| Field | What to Enter |
|---|---|
| Credential Profile Name | A unique name to identify this profile |
| Protocol | Select HTTP/HTTPS |
| Username | The username for the Proxmox VE Cluster |
| Password | The password for that account |
| Authentication Type | Select the authentication type configured on the cluster |
Select Reset to clear all fields. Select Create Credential Profile to save.
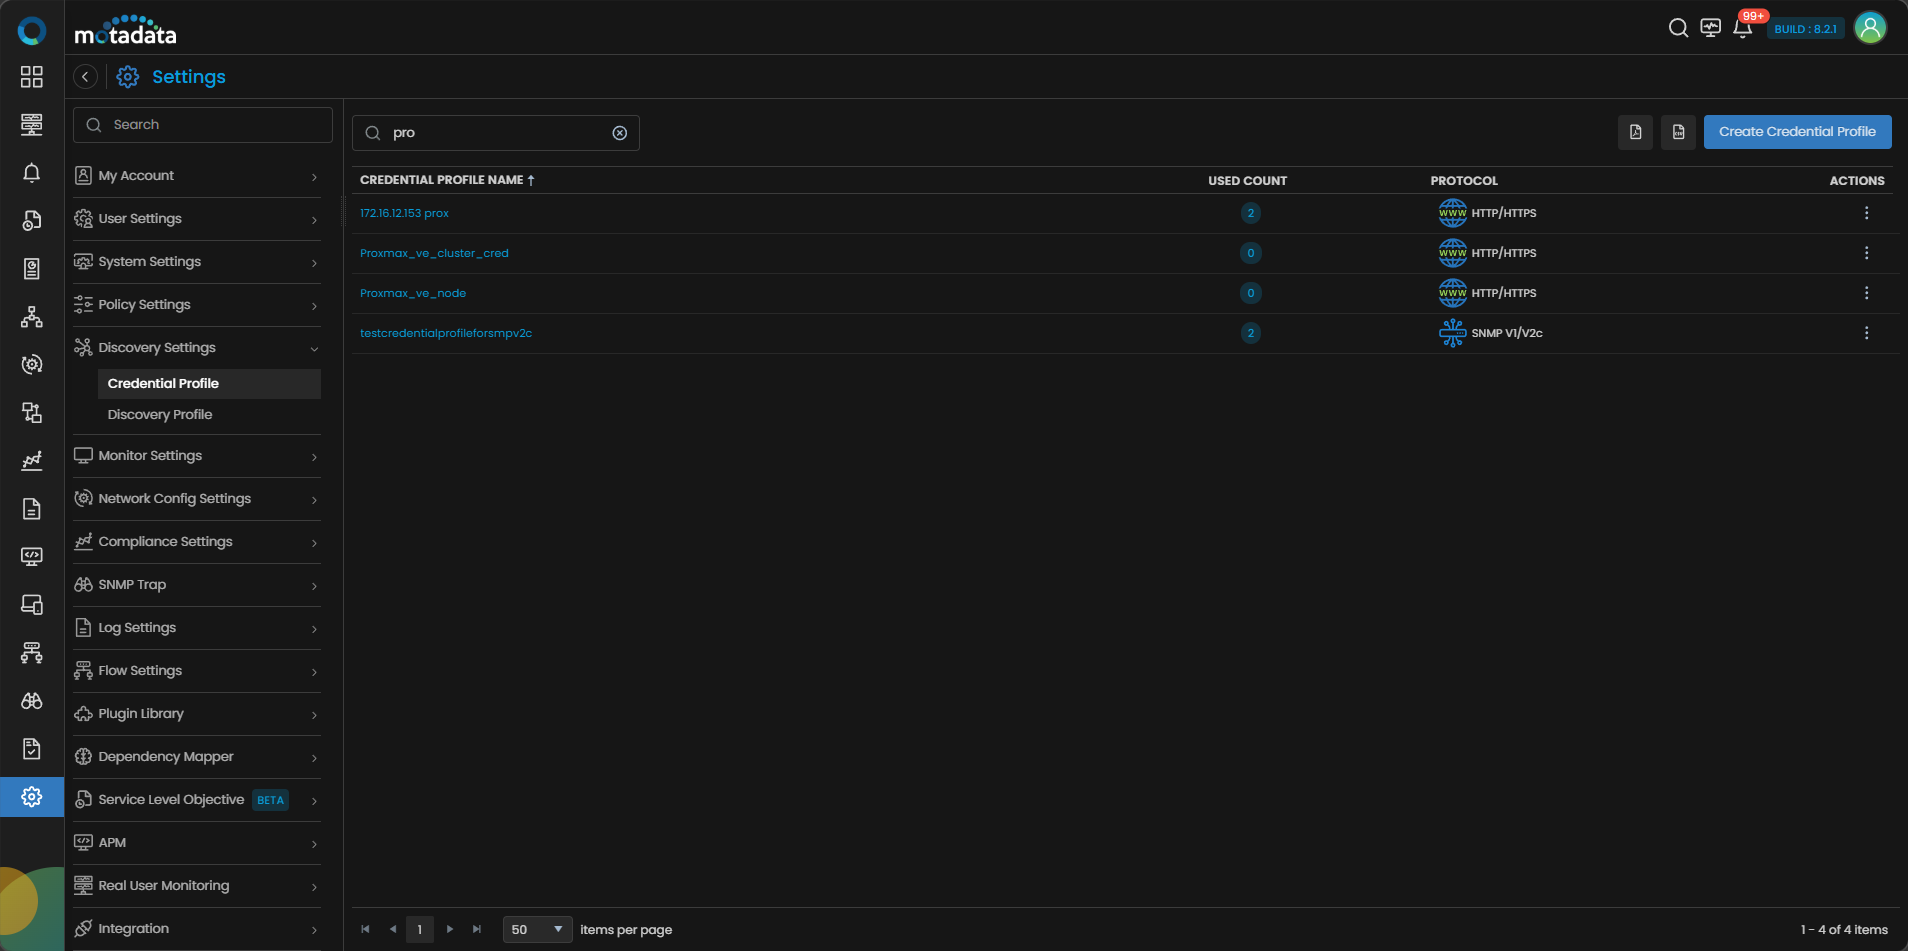
The profile now appears in the Credential Profile list.
2. Create a Discovery Profile
Go to Menu. Select Settings . Select Discovery Settings . Select Discovery Profile. The Discovery Profile screen opens. Select Create Discovery Profile.
The Create Discovery Profile form opens. Select Virtualization from the sidebar. Select Proxmox VE Cluster.
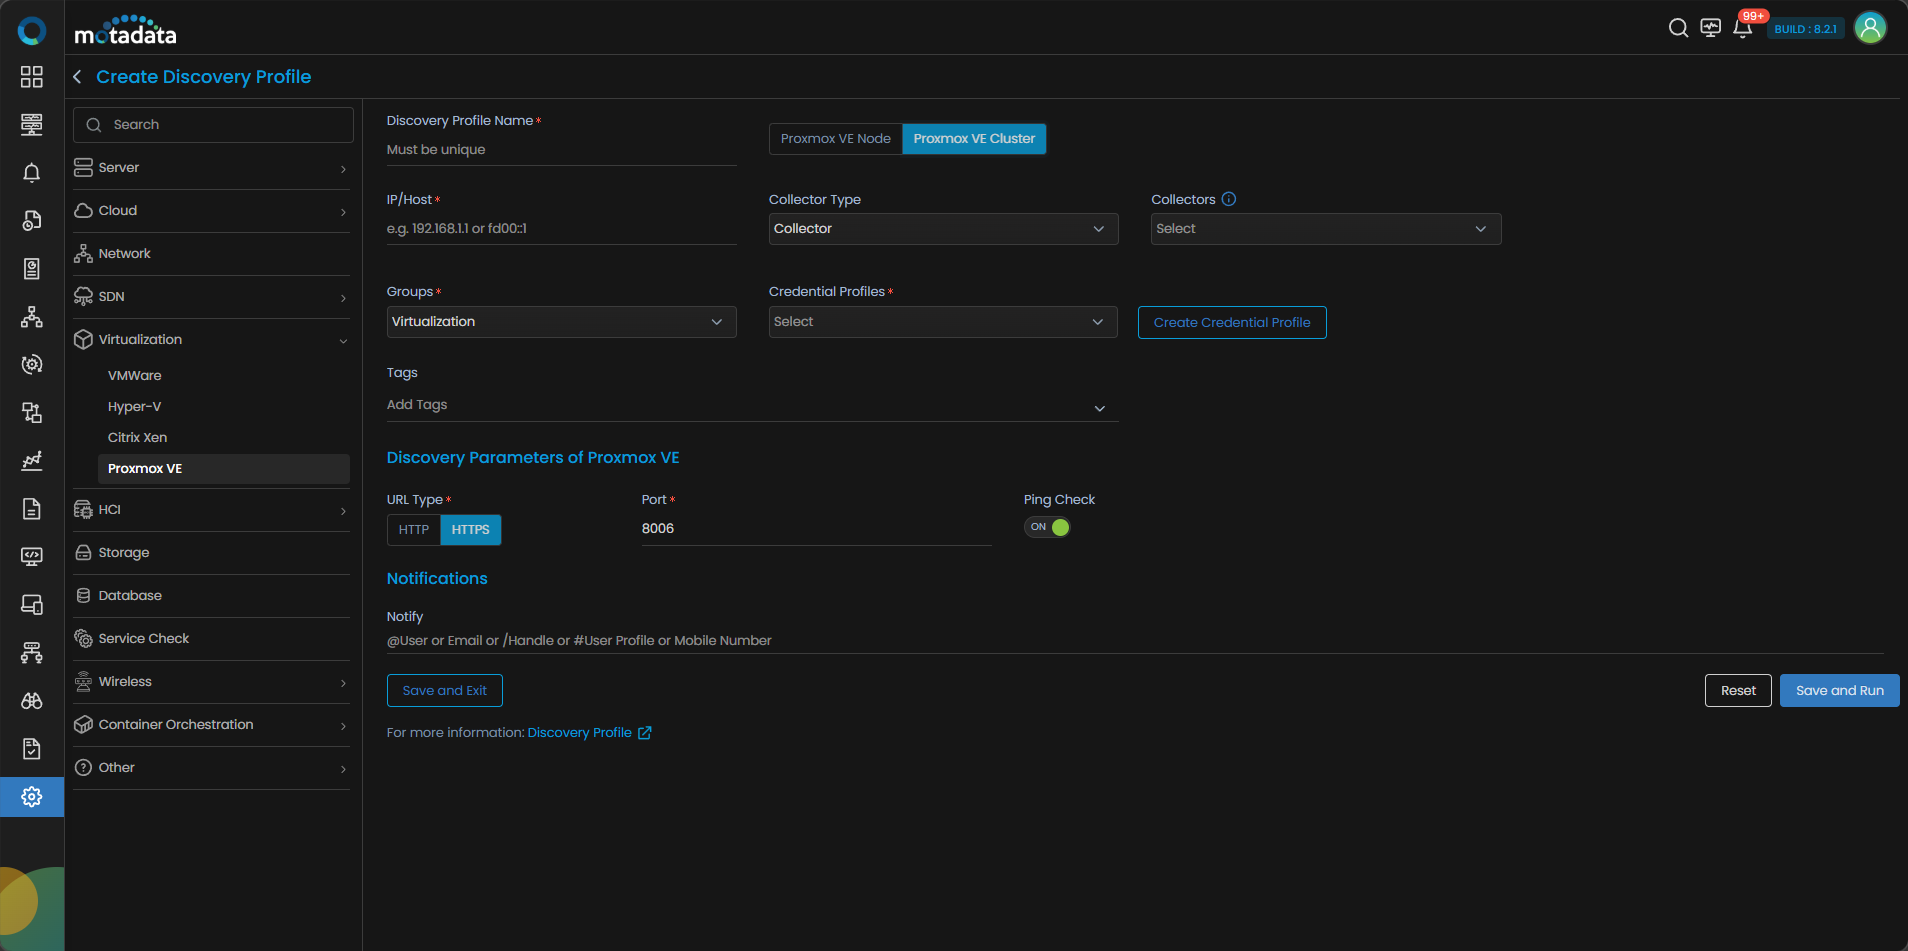
| Field | What to Enter |
|---|---|
| Discovery Profile Name | A unique name to identify this profile |
| IP / Host | The IP address of any single node in the cluster. ObserveOps discovers all nodes and VMs automatically from that entry point. |
| Collectors | One or more Collectors for data collection. If you skip this, ObserveOps selects a Collector automatically. |
| Groups | One or more Groups to assign to provisioned monitors |
| Credential Profile | Select the Proxmox VE Cluster credential profile you just created |
| Tags | Tags to assign to discovered devices |
| URL Type | Select HTTP or HTTPS to match your cluster configuration |
| Port | Pre-populated. No change needed. |
| Ping Check | On by default. Toggle off to discover devices that don't respond to ping. |
| Notify Team | Email addresses, handles, or user profiles to notify when discovery completes |
You can initiate Proxmox VE Cluster discovery using the IP address of any single node. ObserveOps automatically discovers all nodes and VMs in the cluster. The same credentials apply to all nodes. No separate per-node credentials are needed.
Select Collectors based on how you want to distribute the monitoring load.
Select Save and Run to save and start discovery immediately. Select Save and Exit to save without running.
3. Provision the Discovered Devices as Monitors
After the discovery run completes, ObserveOps shows all discovered components.
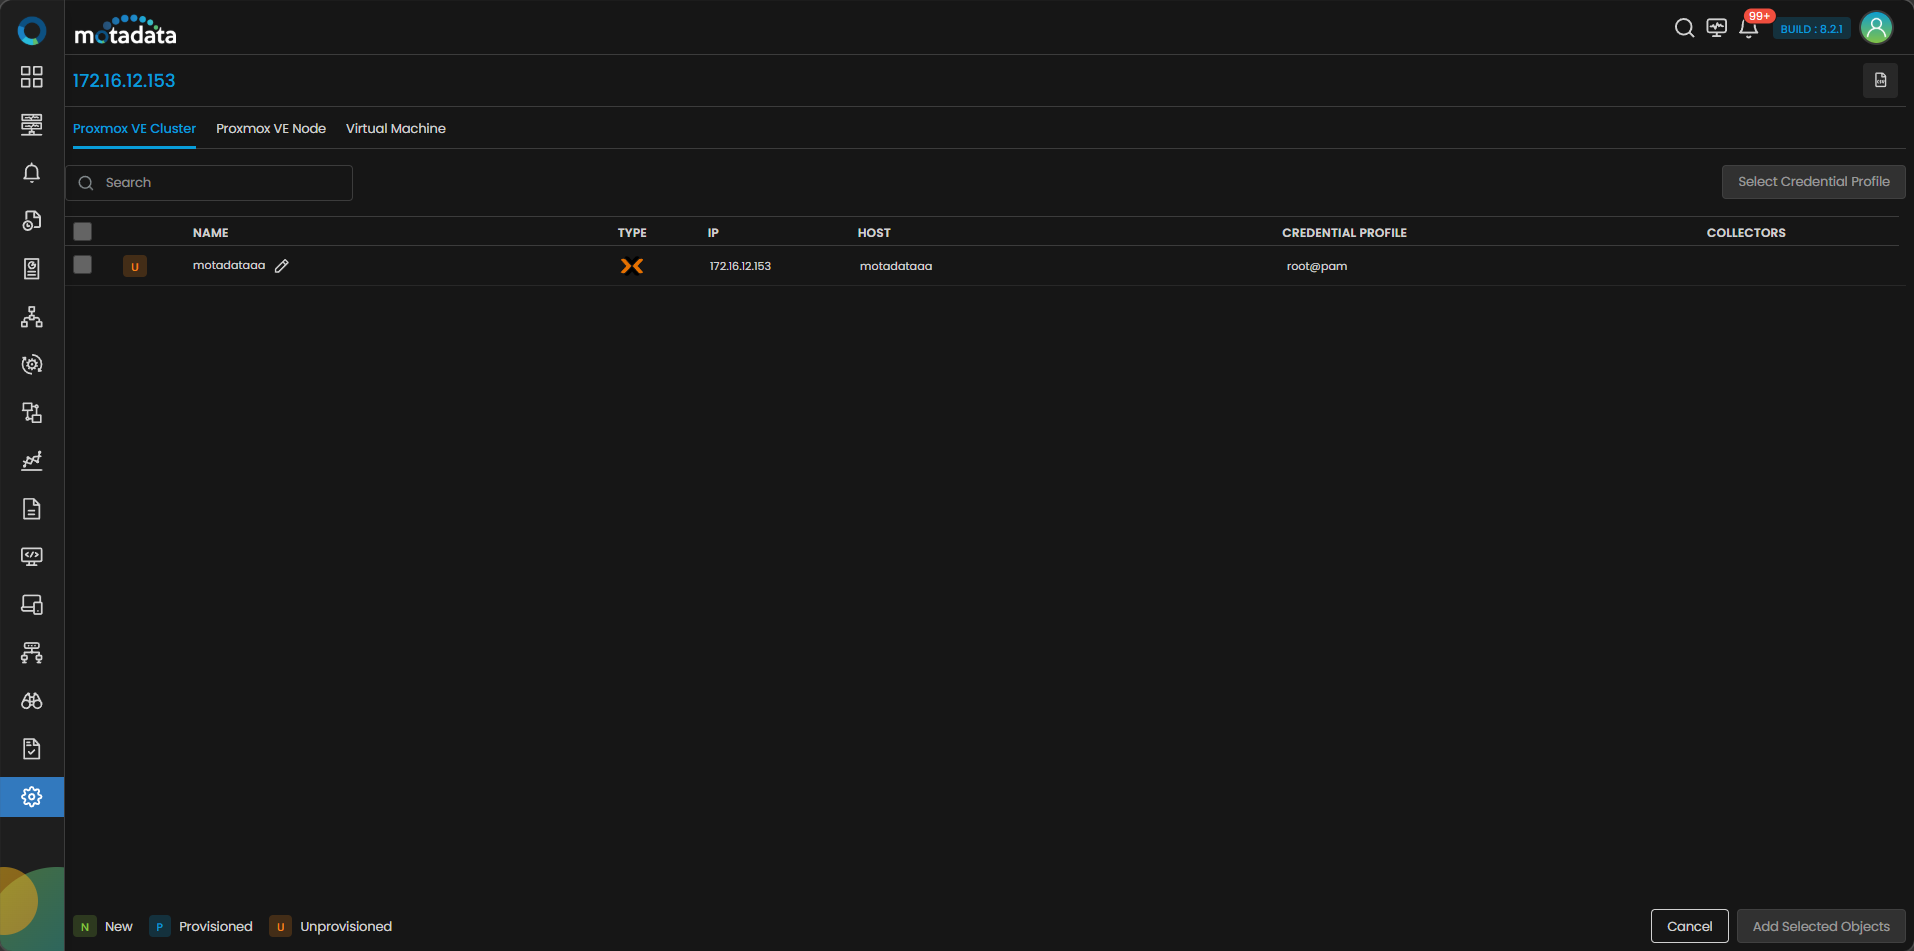
Select the components you want to add as Monitors.
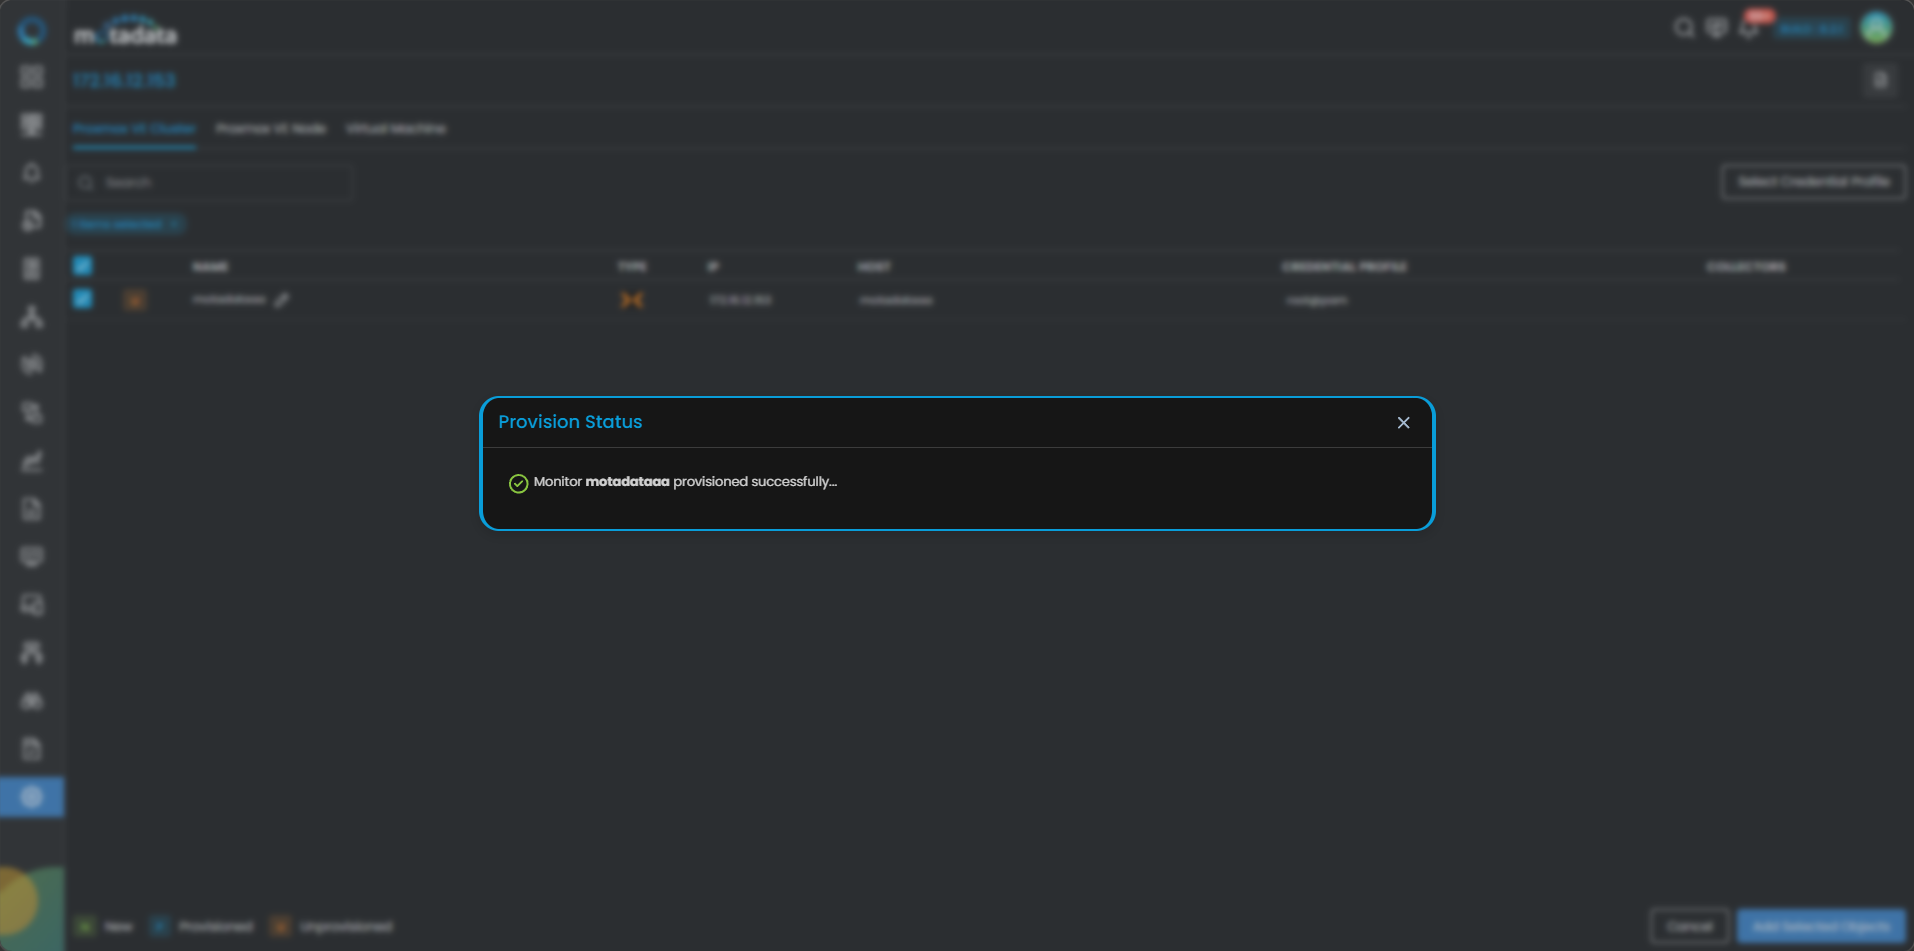
The Provisioning screen shows three tabs: Proxmox VE Cluster, Proxmox VE Node, and Virtual Machine. Select and assign credential profiles to components using the Select Credential Profile button in the upper right corner.
A side panel opens where you assign a credential profile, create a new one, and set the port. ObserveOps tests the profile automatically. A green success message confirms it worked. A red error message means the assignment failed.
Select Add Selected Objects to provision the selected components as monitors.
- Proxmox VE Cluster appears under Virtualization in the Proxmox VE Cluster section.
- Proxmox VE Node appears under Virtualization in the Proxmox VE Node section.
- Virtual Machines appear under Virtualization with their associated Proxmox VE Cluster or Node, and also under Server & Apps when provisioned with a credential profile.
Proxmox VE Nodes are auto-tagged with resource_pool, depends_on, and proxmox. Virtual Machines get the tags hypervisor:proxmox, depends_on, type:vm, os, and vm. During VMotion, the Proxmox VE Cluster tag on VMs updates automatically during polling.
To view the monitors, go to Menu. Select Monitor. Select Virtualization.
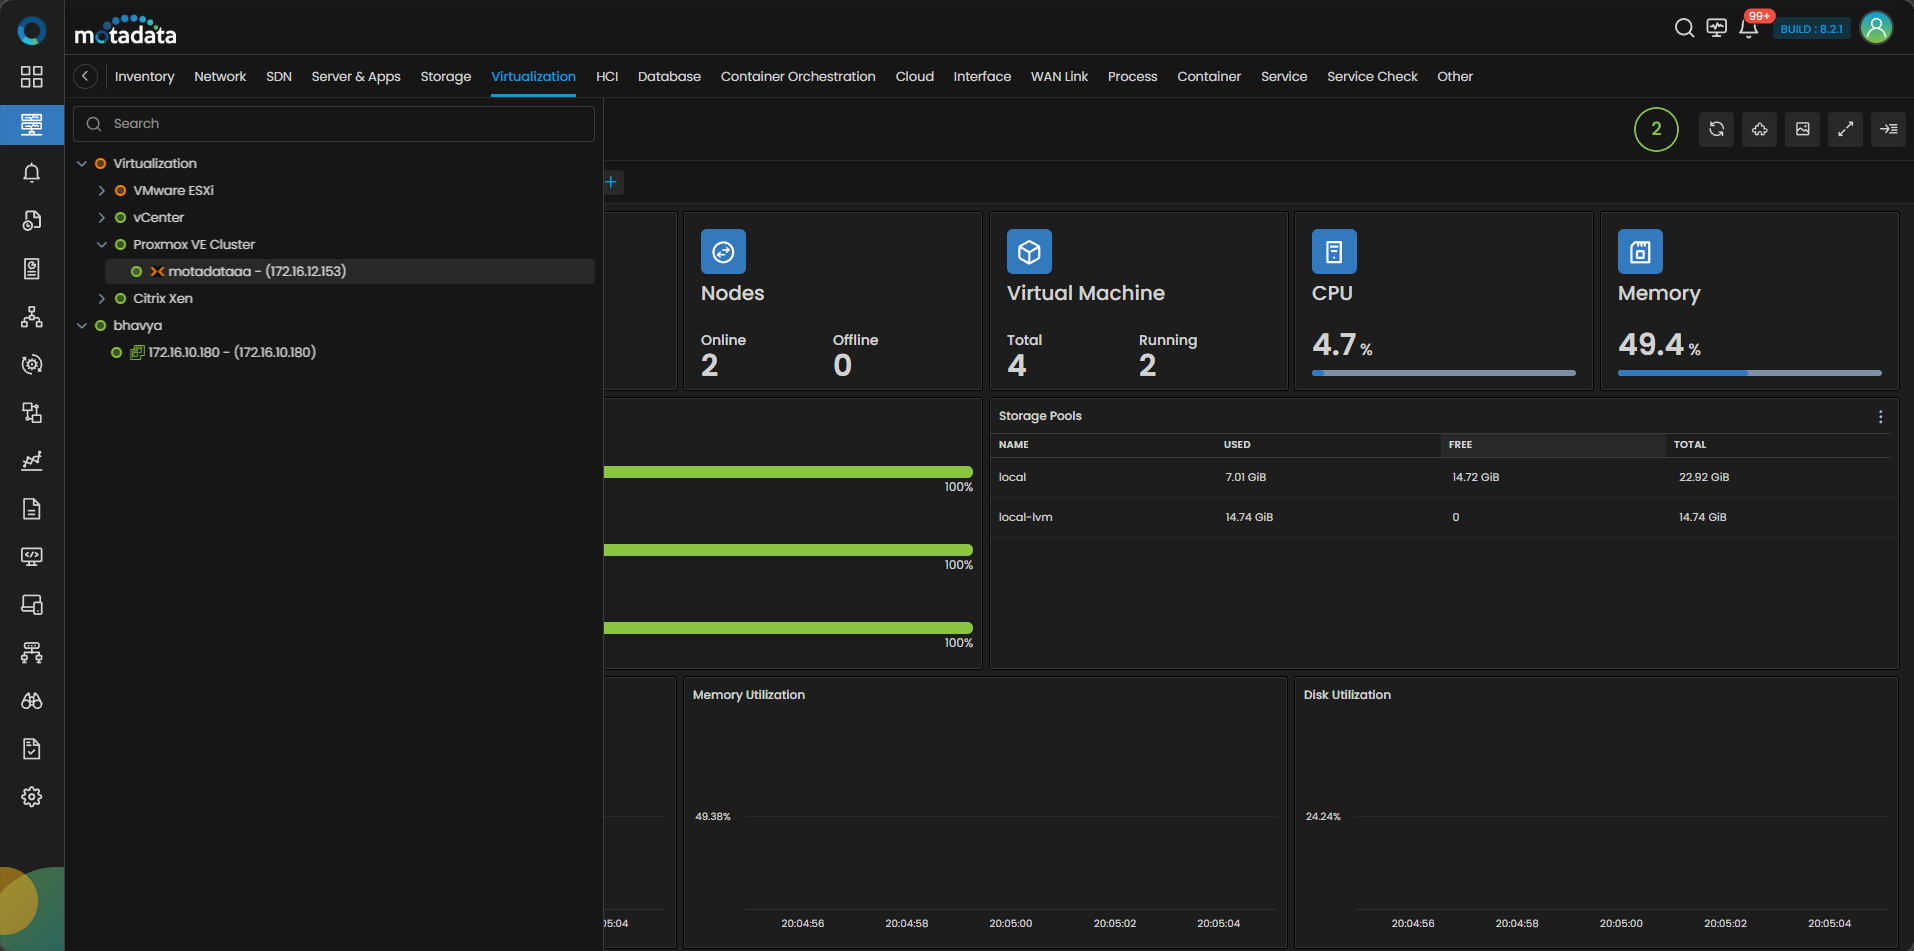
The Proxmox VE Cluster devices are now added to ObserveOps.
Adding a KVM Device
Prerequisites
Run the following commands before discovery.
On the KVM host:
sudo apt install virt-top
On Windows VMs running on KVM:
# Install qemu guest agent
# Install VirtIO Serial Driver
On Linux VMs running on KVM:
sudo apt install qemu-guest-agent
sudo systemctl enable --now qemu-guest-agent
The account you use for discovery must have sudoer privileges on the KVM host.
1. Create a Credential Profile
Go to Menu. Select Settings . Select Discovery Settings . Select Credential Profile. The Credential Profile screen opens. Select Create Credential Profile.
The Create Credential Profile form opens.
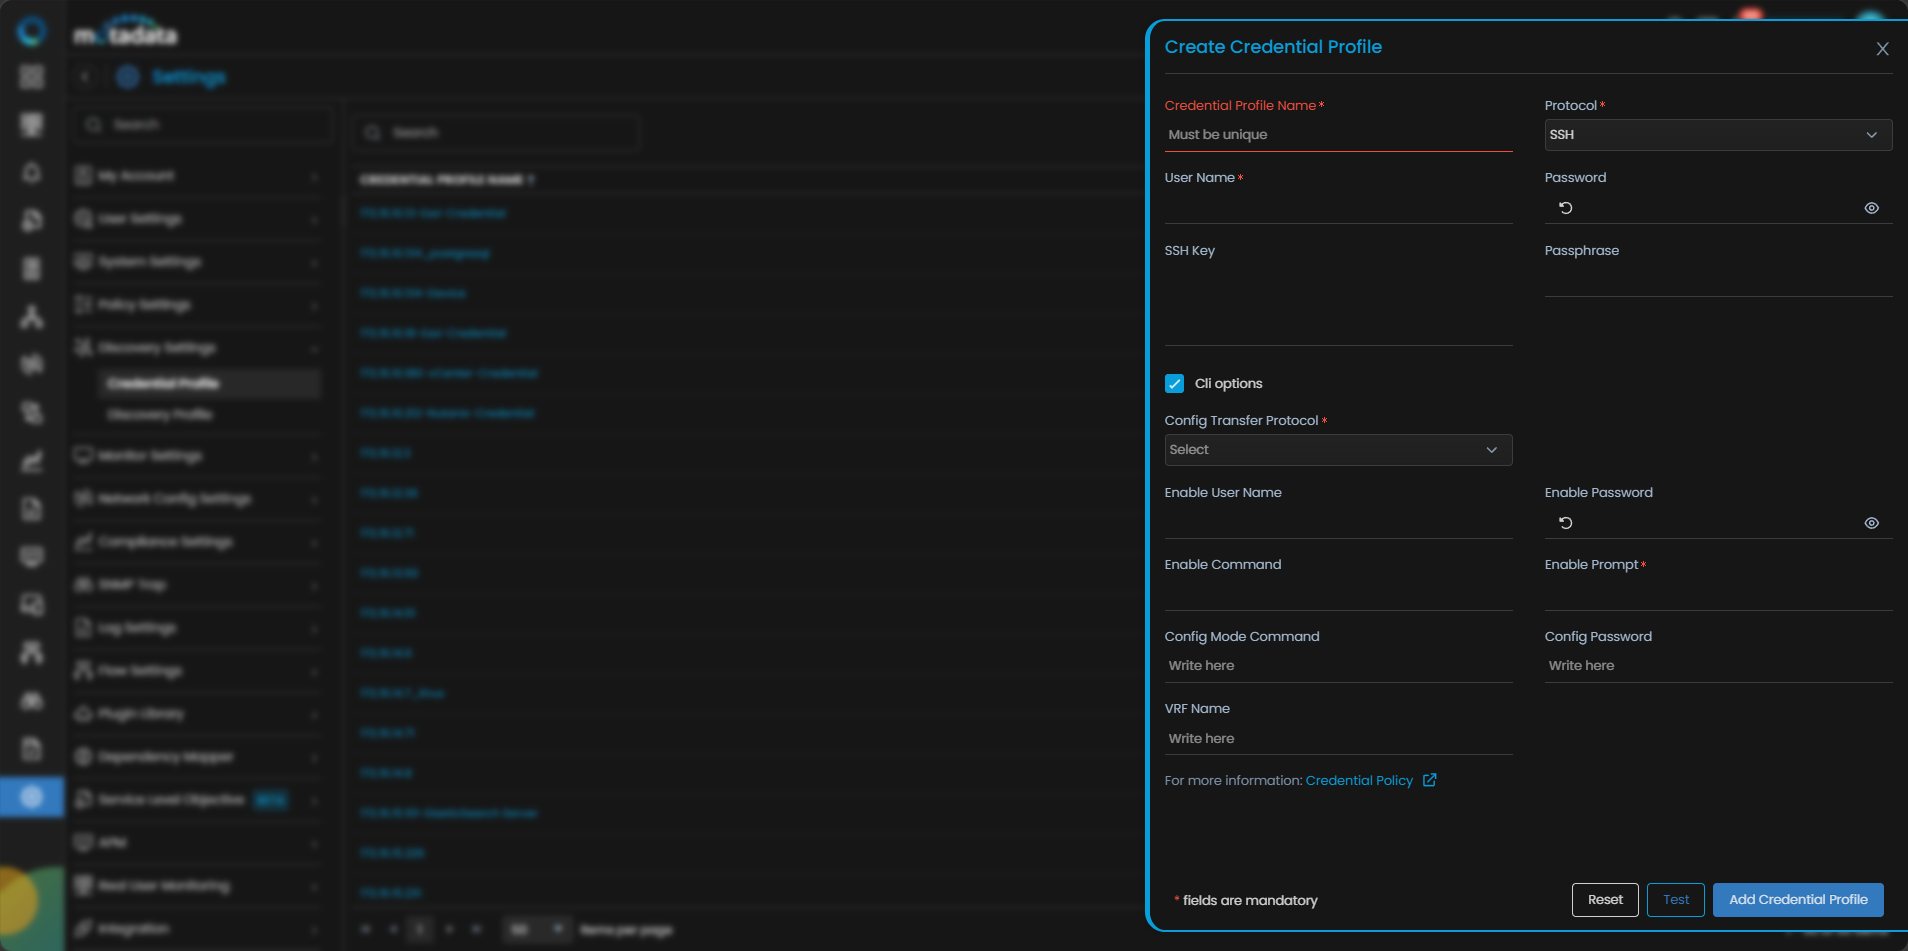
| Field | What to Enter |
|---|---|
| Credential Profile Name | A unique name to identify this profile |
| Protocol | Select SSH |
| Username | The Linux account username with sudoer privileges on the KVM host |
| Password | The password for that account |
| SSH Key / Passphrase | The SSH key and passphrase if you connect using key-based authentication instead of a password |
Select Test to verify the credentials connect to the device. Select Reset to clear all fields. Select Create Credential Profile to save.
The profile now appears in the Credential Profile list.
2. Create a Discovery Profile
Go to Menu. Select Settings . Select Discovery Settings . Select Discovery Profile. The Discovery Profile screen opens. Select Create Discovery Profile.
The Create Discovery Profile form opens. Select Virtualization from the sidebar. Select KVM.
| Field | What to Enter |
|---|---|
| Discovery Profile Name | A unique name to identify this profile |
| IP / Host / IP Range / CIDR / CSV | The address or address range of your KVM hosts |
| Collectors | One or more Collectors for data collection. If you skip this, ObserveOps selects a Collector automatically. |
| Groups | One or more Groups to assign to provisioned monitors |
| Credential Profile | Select the KVM credential profile you just created |
| Tags | Tags to assign to discovered devices |
| Port | Pre-populated. No change needed. |
| Ping Check | On by default. Toggle off to discover devices that don't respond to ping. |
| Notify Team | Email addresses, handles, or user profiles to notify when discovery completes |
Select Collectors based on how you want to distribute the monitoring load.
Select Save and Run to save and start discovery immediately. Select Save and Exit to save without running. Select Save and Schedule to schedule discovery for a specific time.
3. Provision the Discovered Devices as Monitors
After the discovery run completes, ObserveOps shows all discovered devices. Select the ones you want to add as Monitors.
Select Add Selected Objects to provision the selected devices as monitors. ObserveOps now collects metrics continuously.
To view the monitors, go to Menu. Select Monitor. Select Virtualization.
The KVM devices are now added to ObserveOps.