11.11. Asset Logs
11.11.1. Viewing Audit Trail
An Audit Trail provides an active log of changes made to an Asset (of details stored locally in the tool) in a CMDB with timestamp and info about the user responsible for the change. This is a tracking feature that allows monitoring of Technicians’ activities in relation to an Asset.
You can view the Audit Trail in the following ways:
History Tab: You can view the Audit Trail in the History tab (in Asset Details View) of a Hardware, Service, Cloud and Other Asset types.

You can filter the data using a Start date-time and End date-time.
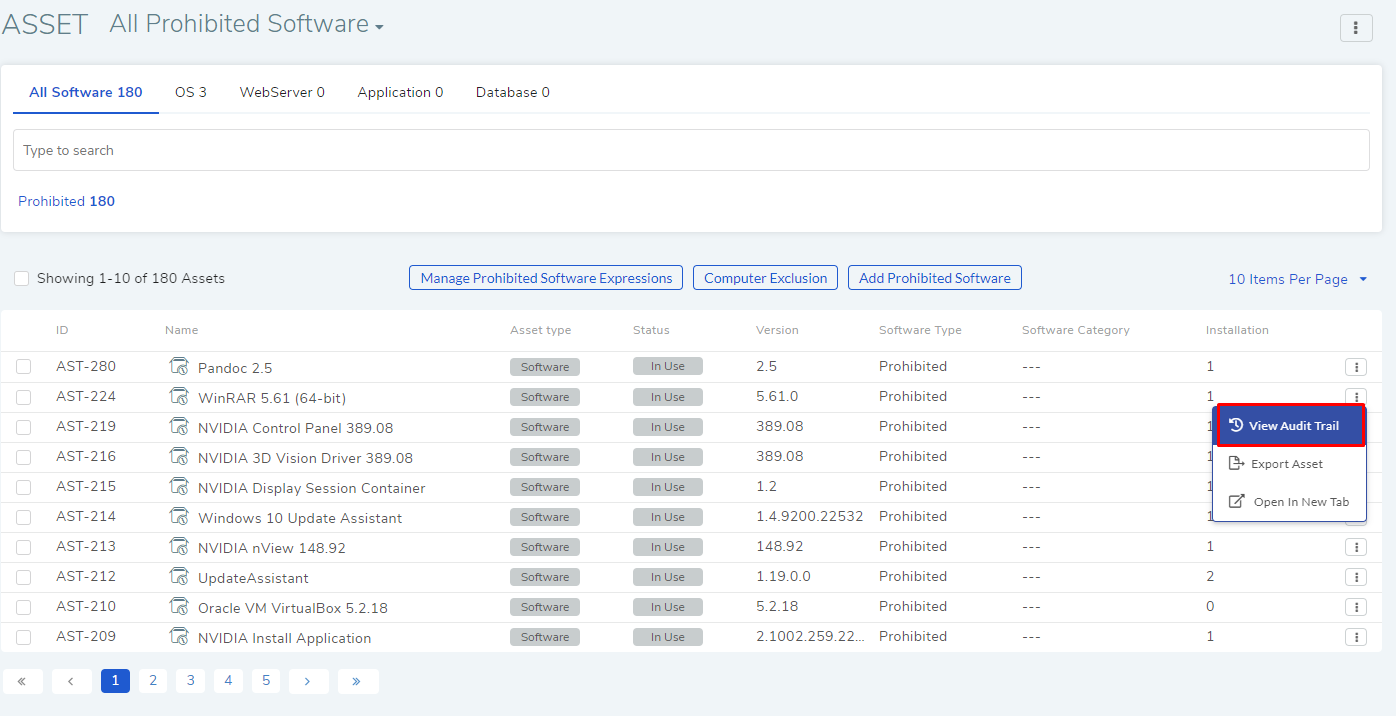
Asset List View: You can access the Audit Trail from the Action Menu of an Asset in the Asset List View.

Asset Details View: You can access the Audit Trail from the Action Menu of an Asset in the Asset Details View.

11.11.2. Change and Scan Log
Asset types other than Software provide two important logs; you can find them in the History tab on the Details View of an Asset, they are:
Scan Log: Here you can view the number of times the Asset was scanned along with the timestamp and mode of scan.
The log also shows whether a scan was done by an Agent or through an Agent-less method. You can filter the log by the method of scan (see below diagram).

Here, you can also filter the data using a Start date-time and End date-time.
Change Log: During a Polling process, Assets in the CMDB are updated for changes in Software and Hardware. A Change log lists the discrepancies between a source (Asset in network) and a destination (Asset in CMDB). For example: a new addition of a software to an already discovered Asset gets reflected in the Change Log during polling. The Change log is shown along with scan log.
You can filter the data by Hardware, Software and Users. You can also filter the data using a Start date-time and End date-time.

You can open the details of a change by clicking on the adjacent View.
