NodeJS
This guide explains how to instrument a NodeJS application by selecting Linux Agent or Windows Agent for trace ingestion.
Motadata APM instruments NodeJS applications using OpenTelemetry-based runtime instrumentation through the Motadata Agent.
Supported NodeJS versions:
- ^18.19.0, 20.6.0 or higher
- Linux
- Windows
Prerequisites
- The Motadata Agent must be installed and running on the Linux server where the NodeJS application is deployed.
otelcolmust also be running as part of the Motadata Agent.
Check agent status:
service motadata status
If the agent is not running:
service motadata stop
service motadata start
Additional requirements:
- NodeJS ^18.19.0, 20.6.0 or higher
To verify the NodeJS version use the below command:
node -v
- npm 7 or higher
nodeandnpmmust be available in systemPATH- Instrumentation must be executed from the NodeJS project root directory
- Internet connectivity is required during the setup process
Configuration Steps
Step 1: Register the Application Service
Go to:
Menu > Settings > APM > Application Registration
Click Application Registration and create a new service.
- Host/VM
- Docker
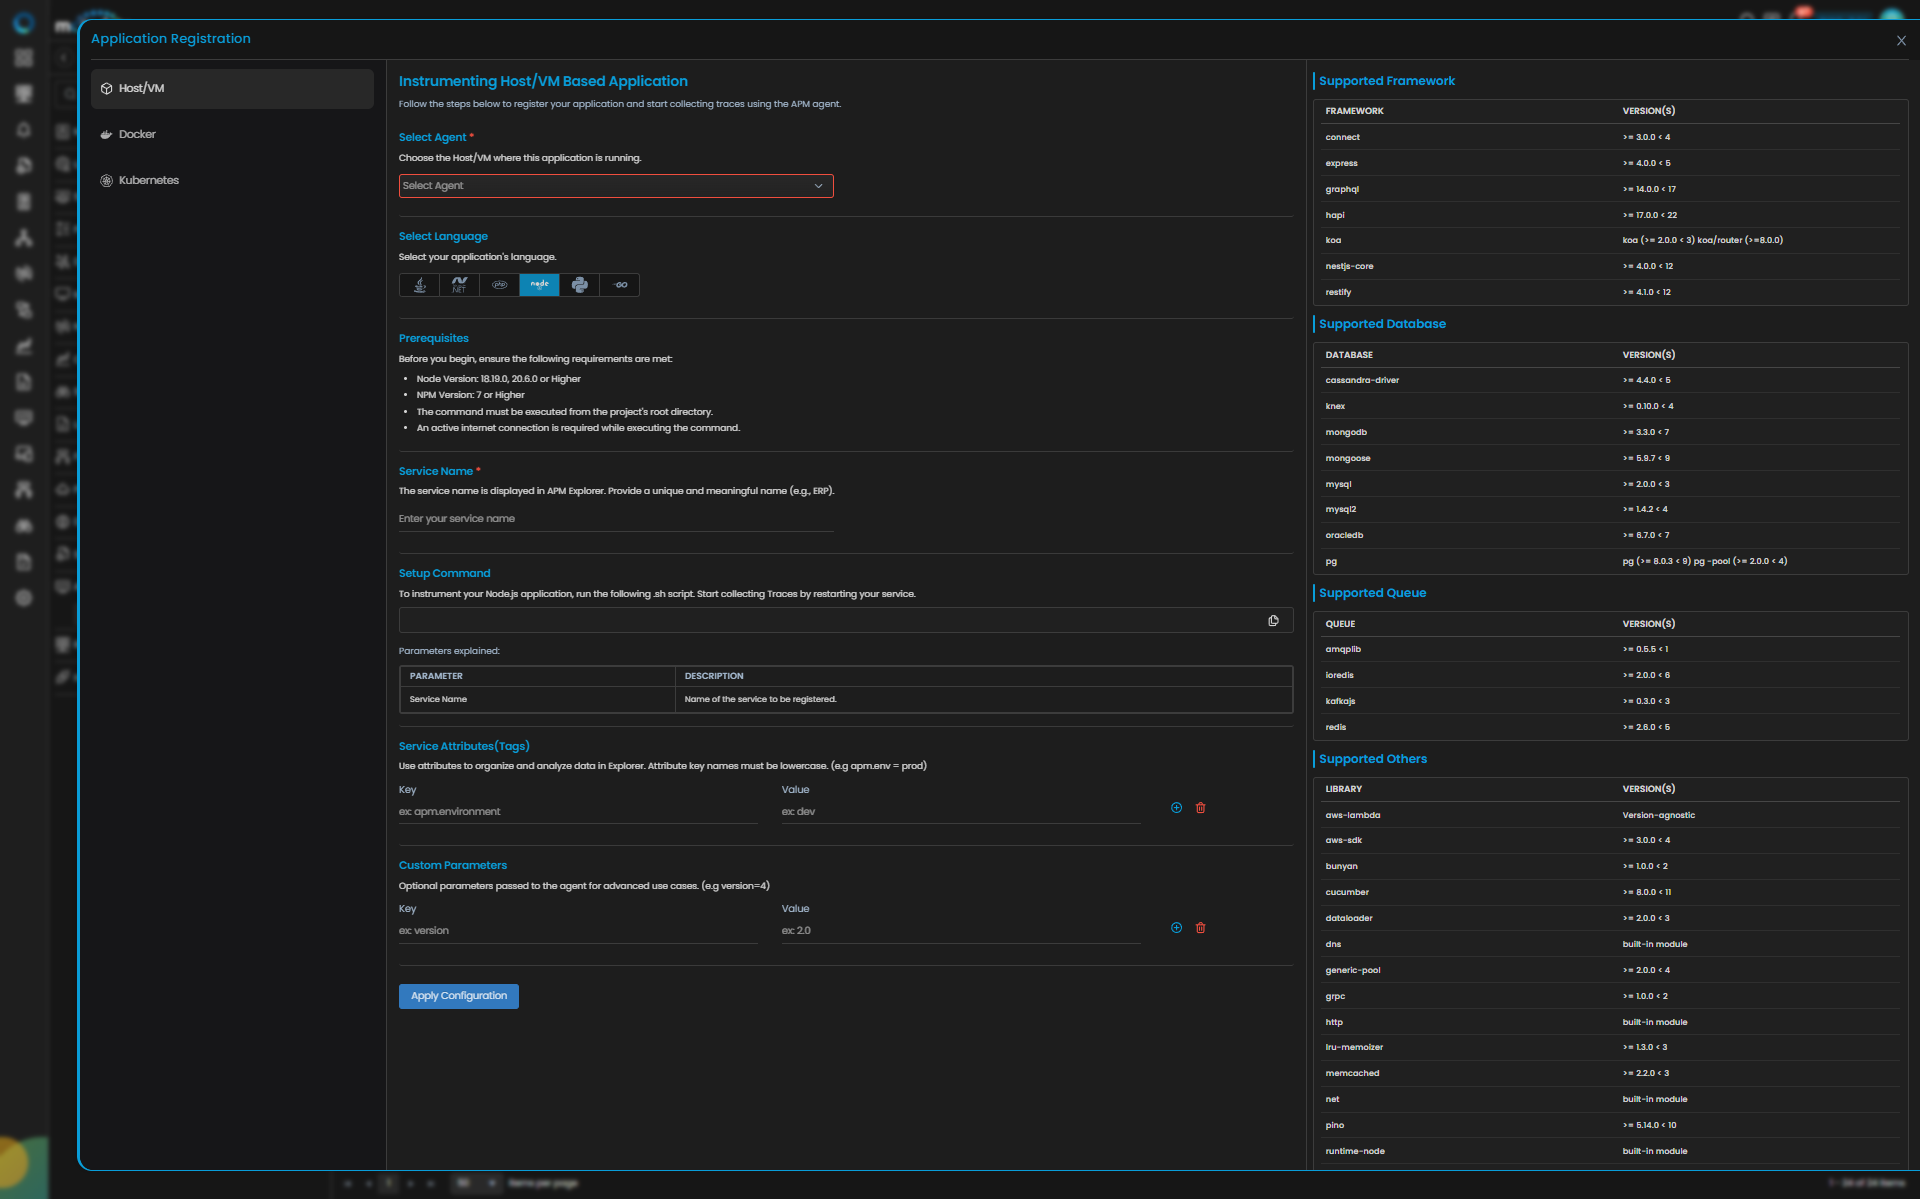
NodeJS Trace Configuration
| Field | Description |
|---|---|
| Select Agent | Select the Host/VM where the application runs |
| Language | Select NodeJS |
| Service Name | Provide a unique name (example: payment_gateway) |
After filling these fields, the UI displays the Setup Command.
Step 2: Instrument the Application
Open a terminal on the server and navigate to the project root directory.
The directory should contain:
package.jsonpackage-lock.jsonnode_modules
Run the setup command generated in the UI.
Example:
SERVICE_NAME=payment_gateway source "/motadata/motadata/instrumentation/agents/nodejs/node-instrumentation.sh" "/motadata/motadata/config/test.properties"
During execution:
- Instrumentation dependencies are installed
- Runtime hooks are injected
- Environment variables are exported
Step 3: Start the Application
Start the application normally.
Example:
npm start
or
node app.js
Once the application starts, traces begin flowing automatically.
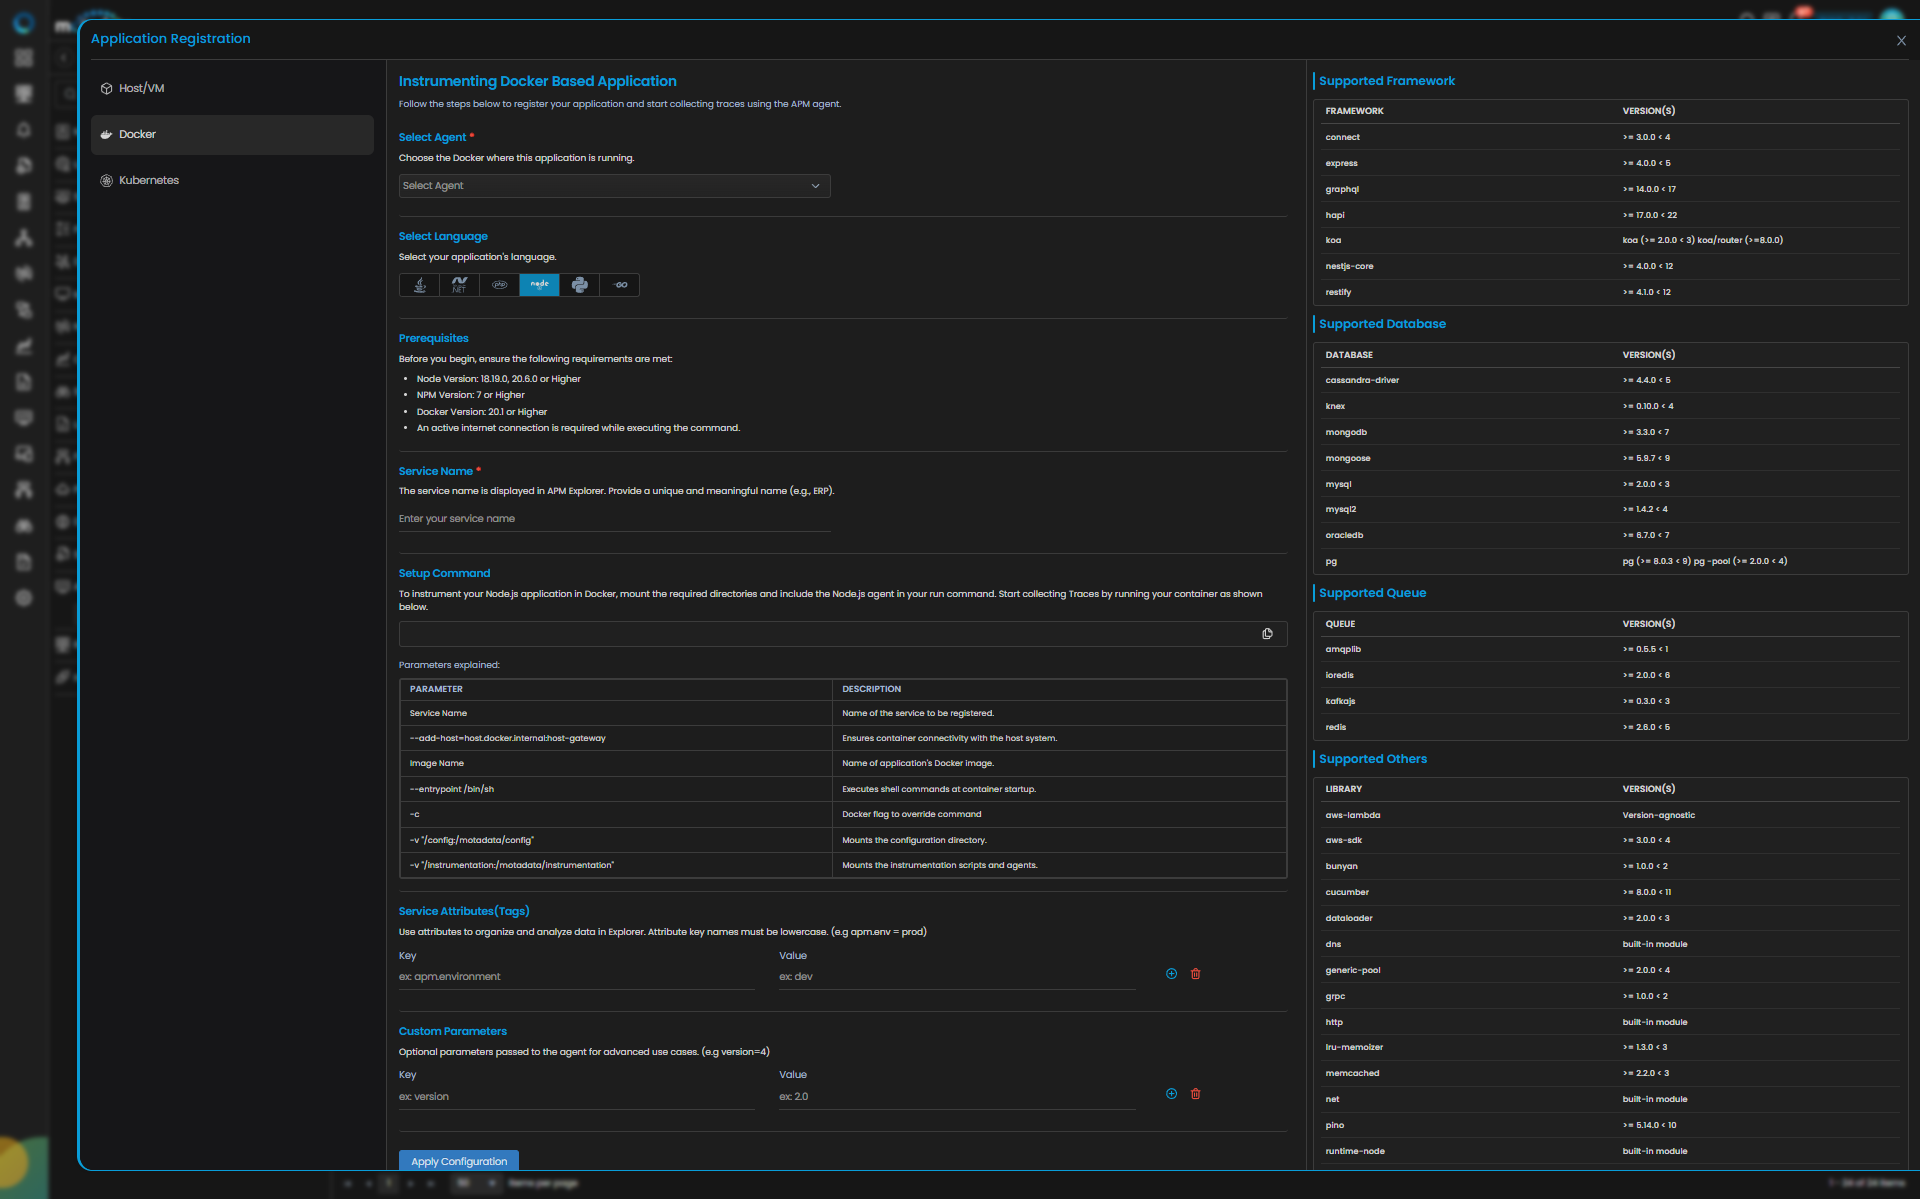
NodeJS Trace Configuration
| Field | Description |
|---|---|
| Select Agent | Select the Docker host |
| Language | Select NodeJS |
| Service Name | Provide a unique service name |
| Image Name | Provide the Docker image name |
Step 2: Instrument the Container
The UI generates a Docker command similar to the following:
docker run -d \
--add-host=host.docker.internal:host-gateway \
-v "/motadata/motadata/config:/motadata/config" \
-v "/motadata/motadata/instrumentation:/motadata/instrumentation" \
--entrypoint /bin/sh \
<your_docker_image> \
-c '. "/motadata/instrumentation/agents/nodejs/node-instrumentation.sh" "/motadata/config/<service_name>.properties" && <nodejs_app_startup_command>'
Replace:
<your_docker_image>with your Docker image name.<service_name>with the exact service name registered in Motadata APM.<nodejs_app_startup_command>with the actual NodeJS application startup command.
Step 3: Start Container
Run the generated Docker command.
Once the container starts:
- Instrumentation initializes
- Environment variables are injected
- NodeJS application starts
- Traces begin appearing in Motadata
Supported Frameworks
The following frameworks are supported for NodeJS instrumentation.
| Framework | Version |
|---|---|
| connect | ≥ 3.0.0 < 4 |
| express | ≥ 4.0.0 < 5 |
| graphql | ≥ 14.0.0 < 17 |
| hapi | ≥ 17.0.0 < 22 |
| koa | ≥ 2.0.0 < 3 |
| koa/router | ≥ 8.0.0 |
| nestjs-core | ≥ 4.0.0 < 12 |
| restify | ≥ 4.1.0 < 12 |
Supported Database
| Database | Version(s) |
|---|---|
| cassandra-driver | >= 4.4.0 < 5 |
| knex | >= 0.10.0 < 4 |
| mongodb | >= 3.3.0 < 7 |
| mongoose | >= 5.9.7 < 9 |
| mysql | >= 2.0.0 < 3 |
| mysql2 | >= 1.4.2 < 4 |
| oracledb | >= 6.7.0 < 7 |
| pg | pg (>= 8.0.3 < 9), pg-pool (>= 2.0.0 < 4) |
Supported Queue
| Queue | Version(s) |
|---|---|
| amqplib | >= 0.5.5 < 1 |
| ioredis | >= 2.0.0 < 6 |
| kafkajs | >= 0.3.0 < 3 |
| redis | >= 2.6.0 < 5 |
Supported Others
| Library | Version(s) |
|---|---|
| aws-lambda | Version-agnostic |
| aws-sdk | >= 3.0.0 < 4 |
| bunyan | >= 1.0.0 < 2 |
| cucumber | >= 8.0.0 < 11 |
| dataloader | >= 2.0.0 < 3 |
| dns | built-in module |
| generic-pool | >= 2.0.0 < 4 |
| grpc | >= 1.0.0 < 2 |
| http | built-in module |
| lru-memoizer | >= 1.3.0 < 3 |
| memcached | >= 2.2.0 < 3 |
| net | built-in module |
| pino | >= 5.14.0 < 10 |
| runtime-node | built-in module |
| socket.io | >= 2.0.0 < 5 |
| undici | >= 5.12.0 |
| winston | >= 1.0.0 < 4 |
Configure Attributes and Parameters
| Field | Description |
|---|---|
| Service Attributes (Tags) | Add key-value metadata for filtering traces |
| Add Custom Parameters | Optional sampling or tagging parameters |
Example:
apm.env=prod
version=4
Click Apply Configuration.
Verification
After the application starts:
Confirm the following:
- Service appears in Application Registration
- Service Trace Status shows Running
- Traces appear in APM Explorer
Troubleshooting
Problem1: NodeJS command not found
Cause
NodeJS is not in system PATH.
Remedy
Check NodeJS location:
which node
Add to PATH:
export PATH=/usr/local/bin:$PATH
Problem2: Instrumentation command executed outside project directory
Cause
The setup command must run in the directory containing package.json.
Remedy
Navigate to the project directory and rerun the command.
Problem3: Traces not appearing
Cause
Environment variables were not exported in the runtime session.
Remedy
Restart the application after executing the instrumentation script.
Problem4: Partial traces
Cause
The application is bundled.
Bundled NodeJS applications bypass runtime module loading.
Remedy
Deploy the application with runtime node_modules.
Debug Logging
Enable OpenTelemetry debug logs:
export OTEL_LOG_LEVEL=debug
Supported values:
- none
- error
- warn
- info
- debug
- verbose
- all
Default:
OTEL_LOG_LEVEL=info
Prerequisites
- Motadata Agent installed and running
- NodeJS version must be ^18.19.0, 20.6.0 or higher
To verify the NodeJS version use the below command:
node -v
- npm 7 or higher
- PowerShell access
Check agent status:
Open Run → services.msc
Locate motadata-agent
Ensure it is Running.
Configuration Steps
Step 1: Register Application
Navigate to:
Menu > Settings > APM > Application Registration
Select Host/VM instrumentation.
NodeJS Trace Configuration
| Field | Description |
|---|---|
| Select Agent | Select Windows agent |
| Language | NodeJS |
| Service Name | Provide unique service name |
Step 2: Run Instrumentation Script
Open PowerShell and navigate to the project root.
Run the command generated by the UI.
Example:
powershell -ExecutionPolicy Bypass -File node-instrumentation.ps1
This script will:
- Install required instrumentation packages
- Configure runtime hooks
- Export required environment variables
Step 3: Start Application
Start the NodeJS application.
Example:
npm start
or
node app.js
Traces will begin flowing automatically.
Supported Frameworks
| Framework | Version |
|---|---|
| connect | ≥ 3.0.0 < 4 |
| express | ≥ 4.0.0 < 5 |
| graphql | ≥ 14.0.0 < 17 |
| hapi | ≥ 17.0.0 < 22 |
| koa | ≥ 2.0.0 < 3 |
| koa/router | ≥ 8.0.0 |
| nestjs-core | ≥ 4.0.0 < 12 |
| restify | ≥ 4.1.0 < 12 |
Supported Database
| Database | Version(s) |
|---|---|
| cassandra-driver | >= 4.4.0 < 5 |
| knex | >= 0.10.0 < 4 |
| mongodb | >= 3.3.0 < 7 |
| mongoose | >= 5.9.7 < 9 |
| mysql | >= 2.0.0 < 3 |
| mysql2 | >= 1.4.2 < 4 |
| oracledb | >= 6.7.0 < 7 |
| pg | pg (>= 8.0.3 < 9), pg-pool (>= 2.0.0 < 4) |
Supported Queue
| Queue | Version(s) |
|---|---|
| amqplib | >= 0.5.5 < 1 |
| ioredis | >= 2.0.0 < 6 |
| kafkajs | >= 0.3.0 < 3 |
| redis | >= 2.6.0 < 5 |
Supported Others
| Library | Version(s) |
|---|---|
| aws-lambda | Version-agnostic |
| aws-sdk | >= 3.0.0 < 4 |
| bunyan | >= 1.0.0 < 2 |
| cucumber | >= 8.0.0 < 11 |
| dataloader | >= 2.0.0 < 3 |
| dns | built-in module |
| generic-pool | >= 2.0.0 < 4 |
| grpc | >= 1.0.0 < 2 |
| http | built-in module |
| lru-memoizer | >= 1.3.0 < 3 |
| memcached | >= 2.2.0 < 3 |
| net | built-in module |
| pino | >= 5.14.0 < 10 |
| runtime-node | built-in module |
| socket.io | >= 2.0.0 < 5 |
| undici | >= 5.12.0 |
| winston | >= 1.0.0 < 4 |
Troubleshooting
Problem1: PowerShell script execution blocked
Cause
PowerShell execution policy restricts scripts.
Remedy
Run:
Set-ExecutionPolicy -Scope Process -ExecutionPolicy Bypass
Problem2: NodeJS command not recognized
Cause
NodeJS installation path not present in PATH.
Remedy
Add NodeJS path:
$env:PATH="C:\Program Files\nodejs\;$env:PATH"
Problem3: Traces not appearing
Cause
Environment variables were not applied to the runtime.
Remedy
Restart the application after running the instrumentation script.
Debug Logging
Enable debug logs:
$env:OTEL_LOG_LEVEL="debug"