Error Tracker
The Error Tracker in APM provides a unified, real-time view of all errors and exceptions across your registered applications. It eliminates the need to investigate failures service-by-service and enables faster identification of critical issues affecting system reliability.
Errors are separated into two dedicated tabs, so you can focus on API-level failures or exception-level issues without switching contexts.
Understanding Error Tracker
The APM screen exposes two error views as top-level tabs.
| Tab | What It Shows |
|---|---|
| API Errors | Endpoint-level failures returned by services — HTTP 5xx server errors and HTTP 4xx client errors. Use this tab to prioritise issues that break API contracts. |
| Exceptions | Application-level exceptions captured by the instrumentation — uncaught exceptions, thrown errors, and framework failures. Use this tab to focus on code-level issues that may not surface as HTTP errors. |
Each tab has its own filters, trend chart, and issue table. The same split is also available inside every instrumented APM service, so you can drill from the global view into a single service without losing the tab context.
Error Trend Visualization
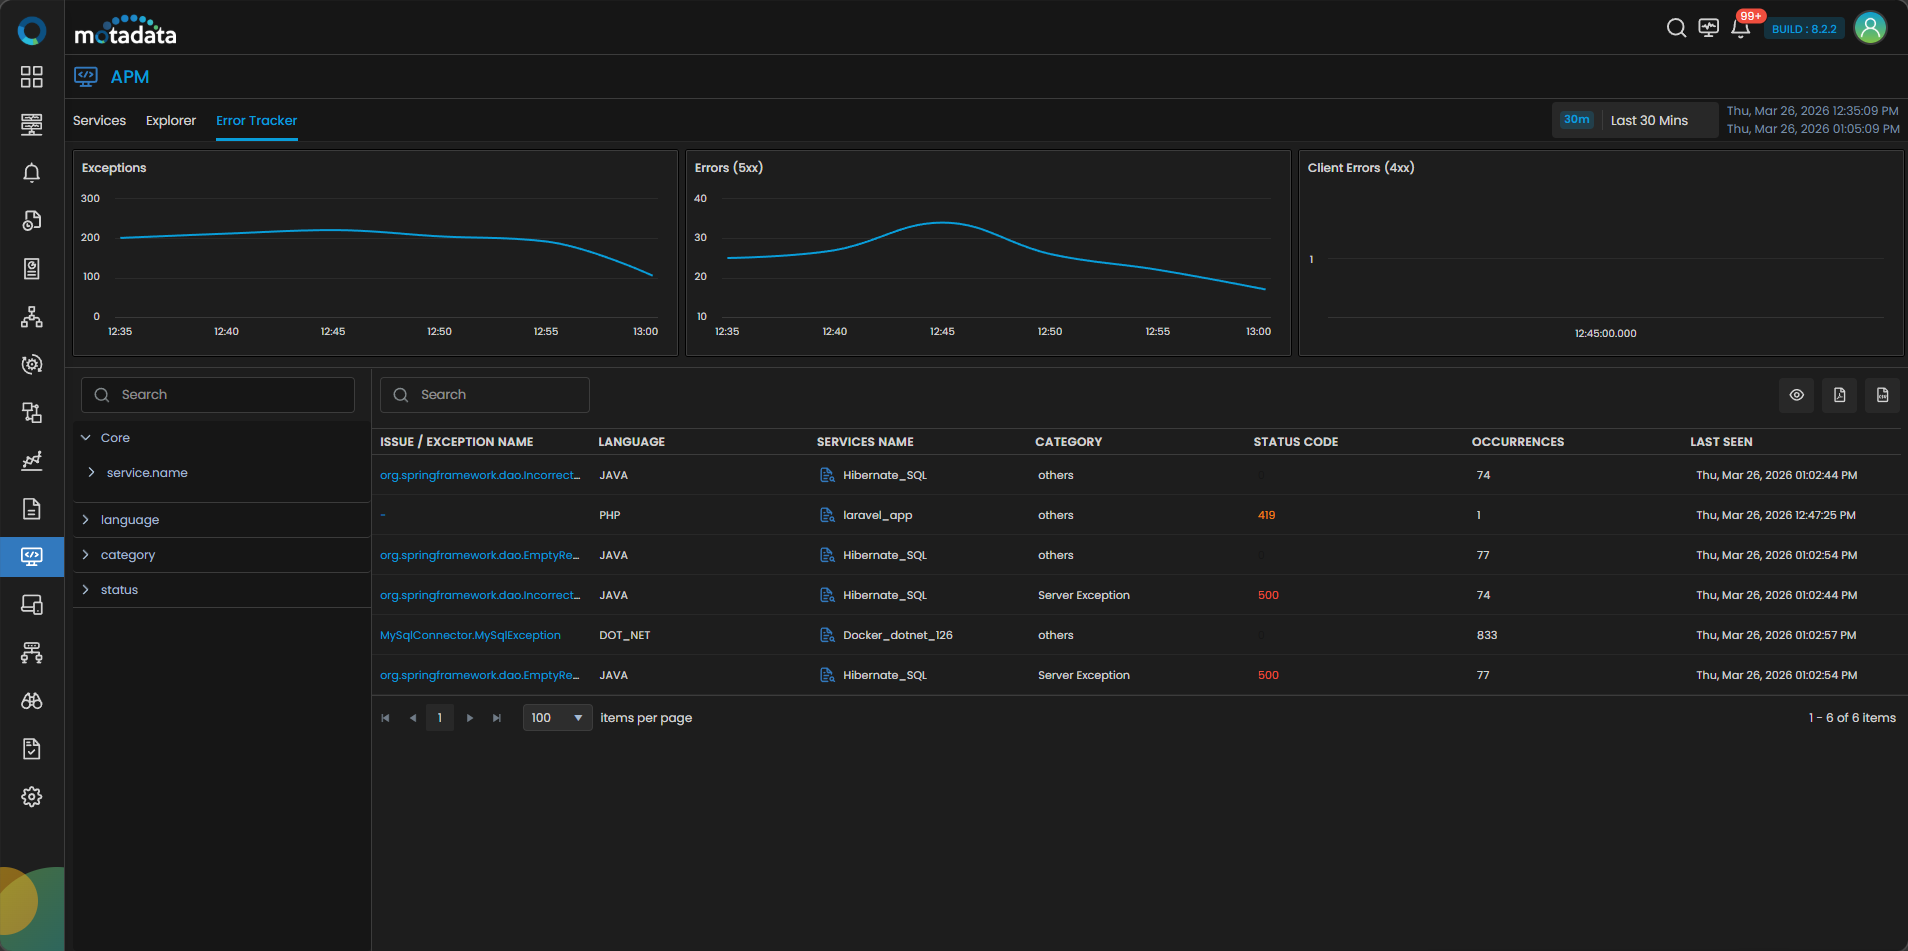
The top of each tab shows a trend chart to help you spot spikes and patterns over the selected time range.
- The API Errors tab shows the trend for Errors (5xx) and Client Errors (4xx).
- The Exceptions tab shows the trend for application Exceptions.
Trend charts are available at both the global level and the individual service level, so the same time-range view works for the whole environment or for a single service.
Global Filters and Search
Each tab provides flexible filtering to narrow down analysis.
Left Panel Filters
You can filter errors using structured attributes:
- service.name: Filter by specific service.
- language: Java, .NET, PHP, NodeJS, and other supported runtimes.
- category: Exception, Server Exception, or Others.
- status: HTTP status classification.
Search Bar
Use the search bar to quickly locate specific exceptions, services, or patterns within the dataset. All charts and tables update dynamically based on applied filters.
Error Table
Each tab displays a consolidated list of detected issues.
| Field | Description |
|---|---|
| Issue / Exception Name | Name of the exception or error (clickable for drilldown). |
| Language | Technology stack where the issue occurred. |
| Services Name | Service associated with the error. |
| Category | Type of issue, such as Server Exception or Others. |
| Status Code | HTTP response code, such as 500 or 419 (API Errors tab). |
| Occurrences | Number of times the issue has occurred. |
| Last Seen | Timestamp of the most recent occurrence. |
The table highlights:
- High-frequency issues.
- Critical failures such as repeated 5xx errors.
- Recently active errors.
Issue-Level Drilldown
Click any Issue / Exception Name to open a detailed view of that specific error. The drilldown includes:
- Occurrence Trend Chart: Shows how the error frequency changes over time.
- Span-Level Occurrences: Lists every span where the error was captured.
Trace Table
The trace table lists every trace impacted by the selected issue.
| Field | Description |
|---|---|
| Trace Name | Name of the trace where the error occurred. |
| Start Time | Timestamp when the trace started. |
| Duration | Total execution time of the trace. |
| Span | Span in which the error occurred. |
| Entities | Associated services or infrastructure entities. |
This lets you move from issue to trace-level impact in a single flow.
Trace-Level Deep Dive
Click any Trace to open a complete, correlated view of telemetry data across the stack. The deep-dive view includes multiple tabs:
- Info: Overview of trace execution and flow.
- Exception: Detailed exception message and stack trace.
- JVM: JVM metrics for Java-based services.
- Network: Network latency and communication insights.
- Host: Host-level performance metrics.
- Metrics: Application performance metrics.
- Database: Database queries and execution details.
- Logs: Correlated logs for the trace.
- Container: Container-level insights, when applicable.
This enables full-stack root cause analysis without switching tools.
Key Capabilities
- Separate API Errors and Exceptions tabs for focused triage.
- Trend-based analysis at both global and per-service levels.
- Error categorization with a clean split between Exceptions, 4xx, and 5xx.
- Dynamic filtering across services, languages, and status codes.
- End-to-end drilldown from issue to trace to infrastructure.
- Faster RCA through correlated insights across the stack.