Kubernetes
Motadata APM supports Kubernetes-based application instrumentation using a Kubernetes Operator and OTEL-powered agents. This enables automatic trace collection from containerized workloads running inside a Kubernetes cluster.
Kubernetes instrumentation extends existing Host/VM and Docker APM capabilities to cloud-native environments and gives multi-language observability across pods and namespaces.
Navigation
Go to Settings > APM > Application Registration. Select Application Registration at the top right to open the registration drawer, then select the Kubernetes tab on the left.
Prerequisites
Before you begin, ensure the following requirements are met:
- Helm version: 3.9 or higher
- Kubernetes version: v1.24 or higher
- Valid SSL certificates for secure communication between the cluster and the ObserveOps server
- Outbound network access from the cluster to the ObserveOps server on the OTLP port
- Ensure TCP port 4318 is open on the Motadata ObserveOps application with bidirectional access. For a full port reference, see the Installation Guide.
Supported Languages
Kubernetes APM supports the following application languages and runtime versions.
| Language | Version |
|---|---|
| Java | 8 or higher |
| .NET | 8 and 9 |
| Node | 18.19.0, 20.6.0 or higher |
| Python | 3.9 or higher |
| C++ | 14 or higher |
| Go | 1.19 or higher |
Instrumentation Configuration
Pick an Instrumentation Method first, then pick the Deployment Type for your cluster. After the installation command runs successfully, the remaining steps are the same across every deployment type: select the applications you want to instrument from the detected list and select Save.
The exact Install command shown in the APM onboarding wizard on your ObserveOps server is always authoritative; use it as-is if it differs from the examples below.
For each deployment type the UI expects a Cluster Name. Open the Cluster Name dropdown and either pick an existing cluster, or select the + icon, type a unique name (for example, prod-k8s or dev-eks), and confirm with the green check. The generated installation command uses the cluster name you selected.
You can also attach an optional Business Service value (for example, Order Management) that groups related microservices under a single business application, and one or more free-form Tags to filter the selected services from the APM Explorer. Both are applied to every application selected in this registration.
- Manual
- eBPF
Manual instrumentation gives you full control over service onboarding. The chart installs the Motadata Operator, the Instrumentation Custom Resources, and the APM Agent together into the motadata-operator-np namespace.
- Kubernetes
- OpenShift
- EKS
- OKE
- GKE
- Rancher
- AKS
- ECS Fargate
Supported Languages: Java, .NET, Node, Python, C++, Go.
Run the following command on your Kubernetes main node:
helm repo add motadata-charts https://motadata2025.github.io/motadata-helm-charts/
helm repo update

helm upgrade --install motadata motadata-charts/motadata-k8s \
  --namespace motadata-operator-np \
  --create-namespace \
  --version 0.1.0 \
  --wait \
  --set global.otlpEndpoint=http://{observeops-server}:4318 \
  --set global.collectorIp={observeops-server}:4318 \
  --set global.clusterName='{your-cluster}' \
  --set motadata-apm-agent.env.clusterName='{your-cluster}' \
  --set motadata-apm-agent.env.motadataServerUrl=http://{observeops-server}:4318/kubernetes/cluster
Supported Languages: Java, .NET, Node, Python, Go.
Run the following command on your OpenShift main node:
helm repo add motadata-charts https://motadata2025.github.io/motadata-helm-charts/
helm repo update

helm upgrade --install motadata motadata-charts/motadata-k8s \
  --namespace motadata-operator-np \
  --create-namespace \
  --version 0.1.0 \
  --wait \
  --set global.otlpEndpoint=http://{observeops-server}:4318 \
  --set global.collectorIp={observeops-server}:4318 \
  --set global.clusterName='{your-cluster}' \
  --set motadata-apm-agent.env.clusterName='{your-cluster}' \
  --set motadata-apm-agent.env.motadataServerUrl=http://{observeops-server}:4318/kubernetes/cluster \
  --set motadata-apm-agent.env.deployment=openshift \
  --set opentelemetry-operator.openshift.enabled=true
Supported Languages: Java, .NET, Node, Python, Go.
Run the following command on a node with kubectl and helm access to your EKS cluster:
helm repo add motadata-charts https://motadata2025.github.io/motadata-helm-charts/
helm repo update

helm upgrade --install motadata motadata-charts/motadata-k8s \
  --namespace motadata-operator-np \
  --create-namespace \
  --version 0.1.0 \
  --wait \
  --set global.otlpEndpoint=http://{observeops-server}:4318 \
  --set global.collectorIp={observeops-server}:4318 \
  --set global.clusterName='{your-cluster}' \
  --set motadata-apm-agent.env.clusterName='{your-cluster}' \
  --set motadata-apm-agent.env.motadataServerUrl=http://{observeops-server}:4318/kubernetes/cluster \
  --set motadata-apm-agent.env.deployment=aws
Supported Languages: Java, .NET, Node, Python, Go.
Run the following command on a node with kubectl and helm access to your OKE cluster:
helm repo add motadata-charts https://motadata2025.github.io/motadata-helm-charts/
helm repo update

helm upgrade --install motadata motadata-charts/motadata-k8s \
  --namespace motadata-operator-np \
  --create-namespace \
  --version 0.1.0 \
  --wait \
  --set global.otlpEndpoint=http://{observeops-server}:4318 \
  --set global.collectorIp={observeops-server}:4318 \
  --set global.clusterName='{your-cluster}' \
  --set motadata-apm-agent.env.clusterName='{your-cluster}' \
  --set motadata-apm-agent.env.motadataServerUrl=http://{observeops-server}:4318/kubernetes/cluster \
  --set motadata-apm-agent.env.deployment=oracle
Supported Languages: Java, .NET, Node, Python, Go.
Run the following command on a node with kubectl and helm access to your GKE cluster:
helm repo add motadata-charts https://motadata2025.github.io/motadata-helm-charts/
helm repo update

helm upgrade --install motadata motadata-charts/motadata-k8s \
  --namespace motadata-operator-np \
  --create-namespace \
  --version 0.1.0 \
  --wait \
  --set global.otlpEndpoint=http://{observeops-server}:4318 \
  --set global.collectorIp={observeops-server}:4318 \
  --set global.clusterName='{your-cluster}' \
  --set motadata-apm-agent.env.clusterName='{your-cluster}' \
  --set motadata-apm-agent.env.motadataServerUrl=http://{observeops-server}:4318/kubernetes/cluster \
  --set motadata-apm-agent.env.deployment=google
Supported Languages: Java, .NET, Node, Python, Go.
Run the following command on a node with kubectl and helm access to your Rancher-managed cluster:
helm repo add motadata-charts https://motadata2025.github.io/motadata-helm-charts/
helm repo update

helm upgrade --install motadata motadata-charts/motadata-k8s \
  --namespace motadata-operator-np \
  --create-namespace \
  --version 0.1.0 \
  --wait \
  --set global.otlpEndpoint=http://{observeops-server}:4318 \
  --set global.collectorIp={observeops-server}:4318 \
  --set global.clusterName='{your-cluster}' \
  --set motadata-apm-agent.env.clusterName='{your-cluster}' \
  --set motadata-apm-agent.env.motadataServerUrl=http://{observeops-server}:4318/kubernetes/cluster \
  --set motadata-apm-agent.env.deployment=rancher
Supported Languages: Java, .NET, Node, Python, Go.
Run the following command on a node with kubectl and helm access to your AKS cluster:
helm repo add motadata-charts https://motadata2025.github.io/motadata-helm-charts/
helm repo update

helm upgrade --install motadata motadata-charts/motadata-k8s \
  --namespace motadata-operator-np \
  --create-namespace \
  --version 0.1.0 \
  --wait \
  --set global.otlpEndpoint=http://{observeops-server}:4318 \
  --set global.collectorIp={observeops-server}:4318 \
  --set global.clusterName='{your-cluster}' \
  --set motadata-apm-agent.env.clusterName='{your-cluster}' \
  --set motadata-apm-agent.env.motadataServerUrl=http://{observeops-server}:4318/kubernetes/cluster \
  --set motadata-apm-agent.env.deployment=aks
Supported Languages: Java, .NET, Node, Python, Go.
EKS on Fargate requires additional compatibility work before the chart runs cleanly on every cluster.
Run the following command on a node with kubectl and helm access to your ECS Fargate cluster:
helm repo add motadata-charts https://motadata2025.github.io/motadata-helm-charts/
helm repo update

helm upgrade --install motadata motadata-charts/motadata-k8s \
  --namespace motadata-operator-np \
  --create-namespace \
  --version 0.1.0 \
  --wait \
  --set global.otlpEndpoint=http://{observeops-server}:4318 \
  --set global.collectorIp={observeops-server}:4318 \
  --set global.clusterName='{your-cluster}' \
  --set motadata-apm-agent.env.clusterName='{your-cluster}' \
  --set motadata-apm-agent.env.motadataServerUrl=http://{observeops-server}:4318/kubernetes/cluster \
  --set motadata-apm-agent.env.deployment=fargate
After the command completes, the drawer shows the detected applications with Application Name, Language and Namespace. Select the ones you want to instrument. This will open a right-side drawer to further instrumentation steps.
Follow the instrumentation steps from the right-side drawer and click the Save button.
Before clicking Save, you can scroll to the Notify section and tick Enable trace notifications to receive a notification when a selected service stops sending traces for the configured time window.
For Go workloads, provide the Go Target Executable path (for example, /path/to/container/executable); the UI writes this value as the instrumentation.opentelemetry.io/otel-go-auto-target-exe annotation on the deployment.
eBPF instrumentation is zero-touch: workloads are instrumented at the kernel level without SDK code changes or pod restarts. The chart installs into the obi namespace.
- Kubernetes
- OpenShift
- EKS
- OKE
- GKE
- Rancher
- AKS
- ECS Fargate
Supported Languages: Java, .NET, Node, Python, C++, Go.
Run the following command on your Kubernetes main node:
helm repo add motadata-charts https://motadata2025.github.io/motadata-helm-charts/
helm repo update

helm upgrade --install motadata-ebpf motadata-charts/motadata-ebpf \
  -n obi --create-namespace \
  --set global.otlpEndpoint=http://{observeops-server}:4318 \
  --set global.clusterName='{your-cluster}' \
  --set motadata-apm-agent.env.clusterName='{your-cluster}' \
  --set motadata-apm-agent.env.motadataServerUrl=http://{observeops-server}:4318/kubernetes/cluster
Supported Languages: Java, .NET, Node, Python, Go.
Run the following command on your OpenShift main node:
helm repo add motadata-charts https://motadata2025.github.io/motadata-helm-charts/
helm repo update

helm upgrade --install motadata-ebpf motadata-charts/motadata-ebpf \
  -n obi --create-namespace \
  --set global.otlpEndpoint=http://{observeops-server}:4318 \
  --set global.clusterName='{your-cluster}' \
  --set motadata-apm-agent.env.clusterName='{your-cluster}' \
  --set motadata-apm-agent.env.motadataServerUrl=http://{observeops-server}:4318/kubernetes/cluster \
  --set motadata-apm-agent.env.deployment=openshift
Supported Languages: Java, .NET, Node, Python, Go.
Run the following command on a node with kubectl and helm access to your EKS cluster:
helm repo add motadata-charts https://motadata2025.github.io/motadata-helm-charts/
helm repo update

helm upgrade --install motadata-ebpf motadata-charts/motadata-ebpf \
  -n obi --create-namespace \
  --set global.otlpEndpoint=http://{observeops-server}:4318 \
  --set global.clusterName='{your-cluster}' \
  --set motadata-apm-agent.env.clusterName='{your-cluster}' \
  --set motadata-apm-agent.env.motadataServerUrl=http://{observeops-server}:4318/kubernetes/cluster \
  --set motadata-apm-agent.env.deployment=aws
Supported Languages: Java, .NET, Node, Python, Go.
Run the following command on a node with kubectl and helm access to your OKE cluster:
helm repo add motadata-charts https://motadata2025.github.io/motadata-helm-charts/
helm repo update

helm upgrade --install motadata-ebpf motadata-charts/motadata-ebpf \
  -n obi --create-namespace \
  --set global.otlpEndpoint=http://{observeops-server}:4318 \
  --set global.clusterName='{your-cluster}' \
  --set motadata-apm-agent.env.clusterName='{your-cluster}' \
  --set motadata-apm-agent.env.motadataServerUrl=http://{observeops-server}:4318/kubernetes/cluster \
  --set motadata-apm-agent.env.deployment=oracle
Supported Languages: Java, .NET, Node, Python, Go.
Run the following command on a node with kubectl and helm access to your GKE cluster:
helm repo add motadata-charts https://motadata2025.github.io/motadata-helm-charts/
helm repo update

helm upgrade --install motadata-ebpf motadata-charts/motadata-ebpf \
  -n obi --create-namespace \
  --set global.otlpEndpoint=http://{observeops-server}:4318 \
  --set global.clusterName='{your-cluster}' \
  --set motadata-apm-agent.env.clusterName='{your-cluster}' \
  --set motadata-apm-agent.env.motadataServerUrl=http://{observeops-server}:4318/kubernetes/cluster \
  --set motadata-apm-agent.env.deployment=google
Supported Languages: Java, .NET, Node, Python, Go.
Run the following command on a node with kubectl and helm access to your Rancher-managed cluster:
helm repo add motadata-charts https://motadata2025.github.io/motadata-helm-charts/
helm repo update

helm upgrade --install motadata-ebpf motadata-charts/motadata-ebpf \
  -n obi --create-namespace \
  --set global.otlpEndpoint=http://{observeops-server}:4318 \
  --set global.clusterName='{your-cluster}' \
  --set motadata-apm-agent.env.clusterName='{your-cluster}' \
  --set motadata-apm-agent.env.motadataServerUrl=http://{observeops-server}:4318/kubernetes/cluster \
  --set motadata-apm-agent.env.deployment=rancher
Supported Languages: Java, .NET, Node, Python, Go.
Run the following command on a node with kubectl and helm access to your AKS cluster:
helm repo add motadata-charts https://motadata2025.github.io/motadata-helm-charts/
helm repo update

helm upgrade --install motadata-ebpf motadata-charts/motadata-ebpf \
  -n obi --create-namespace \
  --set global.otlpEndpoint=http://{observeops-server}:4318 \
  --set global.clusterName='{your-cluster}' \
  --set motadata-apm-agent.env.clusterName='{your-cluster}' \
  --set motadata-apm-agent.env.motadataServerUrl=http://{observeops-server}:4318/kubernetes/cluster \
  --set motadata-apm-agent.env.deployment=aks
Supported Languages: Java, .NET, Node, Python, Go.
EKS on Fargate requires additional compatibility work before the chart runs cleanly on every cluster.
Run the following command on a node with kubectl and helm access to your ECS Fargate cluster:
helm repo add motadata-charts https://motadata2025.github.io/motadata-helm-charts/
helm repo update

helm upgrade --install motadata-ebpf motadata-charts/motadata-ebpf \
  -n obi --create-namespace \
  --set global.otlpEndpoint=http://{observeops-server}:4318 \
  --set global.clusterName='{your-cluster}' \
  --set motadata-apm-agent.env.clusterName='{your-cluster}' \
  --set motadata-apm-agent.env.motadataServerUrl=http://{observeops-server}:4318/kubernetes/cluster \
  --set motadata-apm-agent.env.deployment=fargate
After the command completes, the drawer shows the detected applications with Application Name, Language and Namespace. Select the ones you want to instrument. Before clicking Save, scroll to the Notify section and tick Enable trace notifications to receive a notification when a selected service stops sending traces for the configured time window.
Using a Private Container Registry
You can host the Motadata APM operator and agent images in your own private container registry (for example, AWS ECR, Harbor, or a self-hosted Docker registry) and install from there instead of pulling from the default public source. This is required for air-gapped clusters, for compliance that forbids pulling third-party images at run time, and for faster image pulls when the registry is in the same region as the cluster.
The private registry flow is the same across every Kubernetes deployment type (Kubernetes, OpenShift, EKS, OKE, GKE, Rancher, AKS). Select the deployment type first, then follow the four steps below.
Enable the Private Registry Option
In the Application Registration drawer on the Kubernetes tab, after selecting the Cluster Name, scroll to the Deploy Motadata Operator section and tick the Use private registry checkbox.
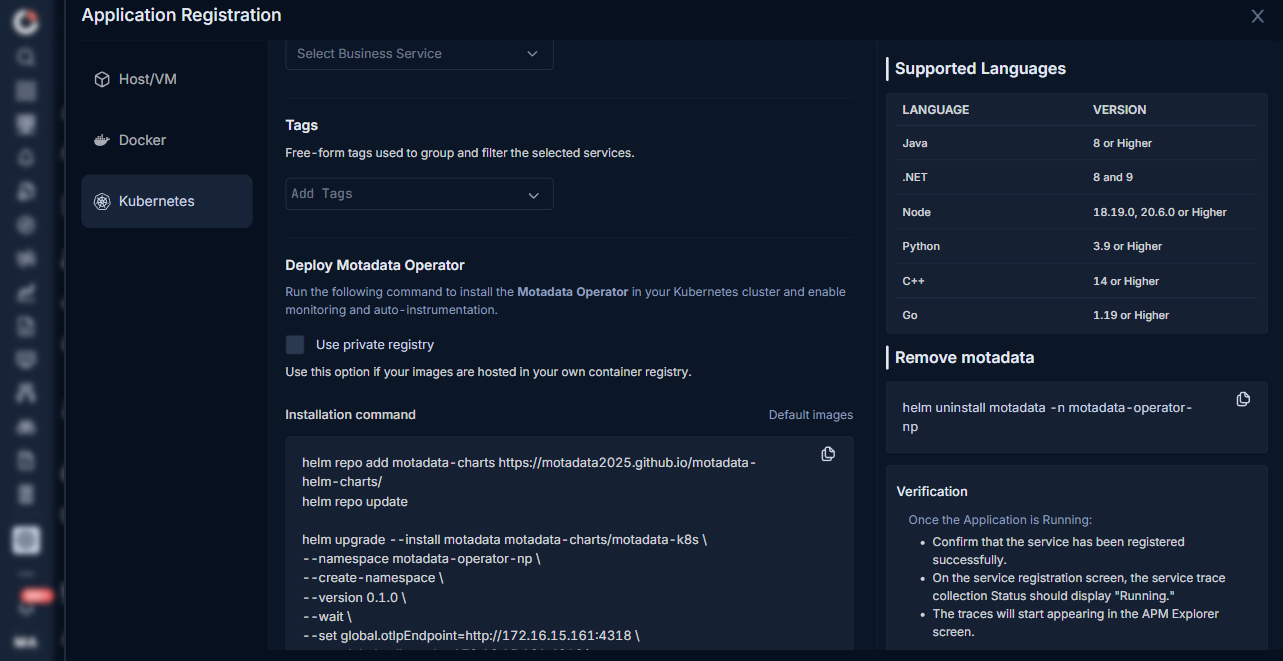
The default Installation command block collapses and four numbered steps appear in its place.
Step 1: Download Helm Chart
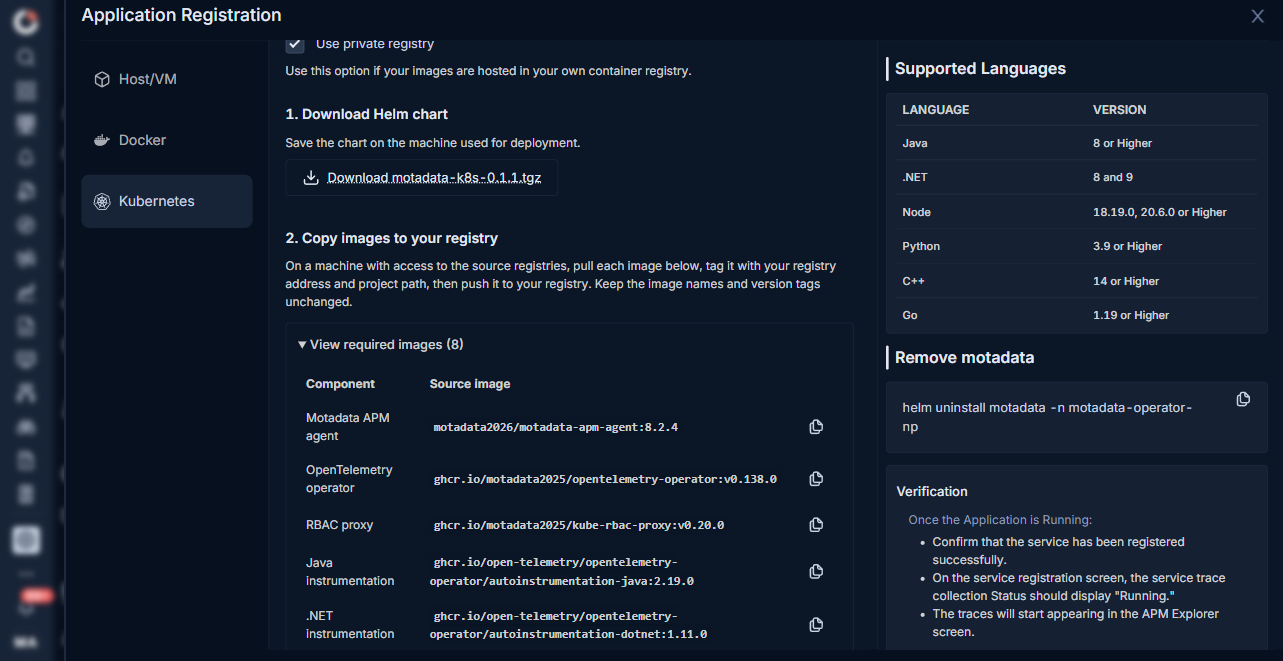
Click Download motadata-k8s-0.1.1.tgz to save the Helm chart to the machine you will use for the deployment. The private-registry install uses this local chart file instead of fetching from a public Helm repository.
Step 2: Copy Images to Your Registry
Expand View required images (8). The table lists every image the chart installs, with its exact source and tag. Pull each image to a machine that has access to the source registries, tag it with your registry address and project path, then push it to your registry. Keep the image names and version tags unchanged.
For AWS ECR, authenticate your local Docker daemon once before pushing:
aws ecr get-login-password --region <aws-region> | docker login --username AWS --password-stdin <aws-account-id>.dkr.ecr.<aws-region>.amazonaws.com
Then for each image: docker pull <source>, docker tag <source> <aws-account-id>.dkr.ecr.<aws-region>.amazonaws.com/<repo-name>:<tag>, docker push <aws-account-id>.dkr.ecr.<aws-region>.amazonaws.com/<repo-name>:<tag>.
The eight images are:
| Component | Source Image |
|---|---|
| Motadata APM agent | motadata2026/motadata-apm-agent:8.2.4 |
| OpenTelemetry operator | ghcr.io/motadata2025/opentelemetry-operator:v0.138.0 |
| RBAC proxy | ghcr.io/motadata2025/kube-rbac-proxy:v0.20.0 |
| Java instrumentation | ghcr.io/open-telemetry/opentelemetry-operator/autoinstrumentation-java:2.19.0 |
| .NET instrumentation | ghcr.io/open-telemetry/opentelemetry-operator/autoinstrumentation-dotnet:1.11.0 |
| Node.js instrumentation | ghcr.io/open-telemetry/opentelemetry-operator/autoinstrumentation-nodejs:0.62.0 |
| Python instrumentation | ghcr.io/open-telemetry/opentelemetry-operator/autoinstrumentation-python:0.59b0 |
| Go instrumentation | ghcr.io/open-telemetry/opentelemetry-go-instrumentation/autoinstrumentation-go |
The Go instrumentation image uses the latest tag when no tag is specified in the source.
Image versions shown in the UI are authoritative. The versions above reflect the current build and may change in future releases; always refer to the View required images list in your onboarding wizard.
Step 3: Configure Image Registry
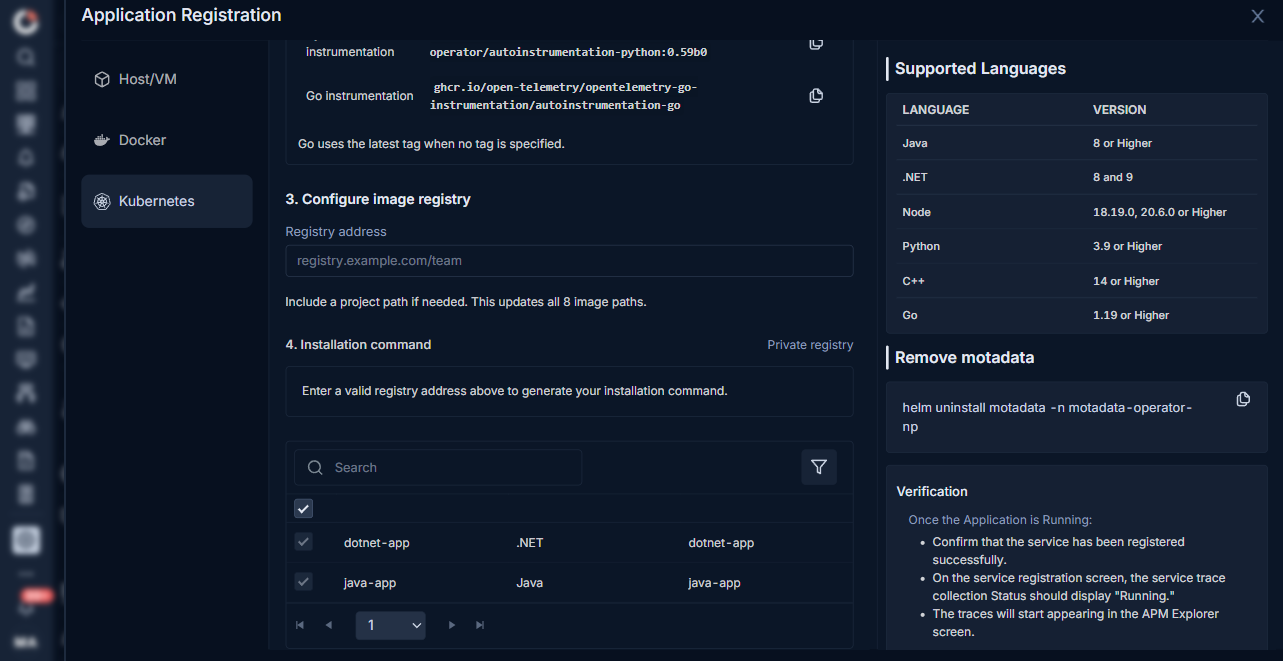
Under Configure image registry, type the Registry address of your private registry in the input field. The expected form is registry.example.com/team. Include a project path when your registry needs one. Entering an address updates all 8 image paths used by the generated command.
Step 4: Installation Command
Once a valid registry address is set, the Installation command panel at the bottom auto-generates the helm command for the Private registry install, using the local chart .tgz from step 1 and the image overrides built from step 3. Copy the command and run it on your Kubernetes main node.
Default (Public) vs Private Registry
| Default | Private registry | |
|---|---|---|
| Checkbox | Unticked | Ticked |
| Helm source | helm repo add motadata-charts https://motadata2025.github.io/motadata-helm-charts/ | Local chart motadata-k8s-0.1.1.tgz downloaded from the UI |
| Images pulled from | Public registries (motadata2026, ghcr.io/motadata2025, ghcr.io/open-telemetry/...) | Your private registry |
| Internet egress at install | Required | Not required (air-gapped) |
The rest of the flow (Business Service, Tags, application selection, Save, trace notifications) is the same for both modes.
Verification
After the installation command completes and the application is running, confirm that trace collection is working.
- The service appears as registered on the service registration screen.
- The trace collection Status shows Running.
- Traces start appearing on the APM Explorer screen.
Remove the Motadata APM Stack
Run the matching uninstall command on your cluster when the agent is no longer required, is incorrectly configured, or needs to be reinstalled with updated settings.
| Instrumentation Method | Uninstall Command |
|---|---|
| Manual | helm uninstall motadata -n motadata-operator-np |
| eBPF | helm uninstall motadata-ebpf -n obi |
To confirm removal, run helm list -A and verify the release no longer appears.
Troubleshooting
Service does not appear in the Application Mapping grid
Cause: the operator cannot see the workload because it is in a namespace the operator is not watching, or the chart has not finished rolling out.
Fix: wait up to 2 minutes after the install command completes, then reopen the drawer. If the workload still does not appear, confirm the pod is running (kubectl get pods -n <namespace>) and that the workload type is Deployment, StatefulSet or DaemonSet.
Traces do not appear in APM Explorer after Save
Cause: the exporter endpoint global.otlpEndpoint is not reachable from the cluster, or TCP 4318 is blocked.
Fix: from a pod on the cluster, run curl -v http://{observeops-server}:4318 and confirm a response. Open 4318 bidirectionally if the firewall is blocking it.