Overview
Motadata APM supports NodeJS trace ingestion using OTEL and its custom agent. NodeJS applications must run on supported versions (^18.19.0, 20.6.0 or higher), and trace ingestion is agent-based with runtime instrumentation.
Prerequisites
- The Motadata Agent must be installed and running on the Linux server where the NodeJS application is deployed.
otelcolmust also be running as part of the Motadata Agent.
Check agent status:
service motadata status
If the agent is not running:
service motadata stop
service motadata start
- NodeJS version must be ^18.19.0, 20.6.0 or higher
To verify the NodeJS version use the below command:
node -v
Navigation
Go to Menu > Settings > APM > Application Registration.
Clicking the Application Registration button, you can register a new application. From the application registration screen, select the instrumentation type Host/VM or Docker.
- Host/VM
- Docker
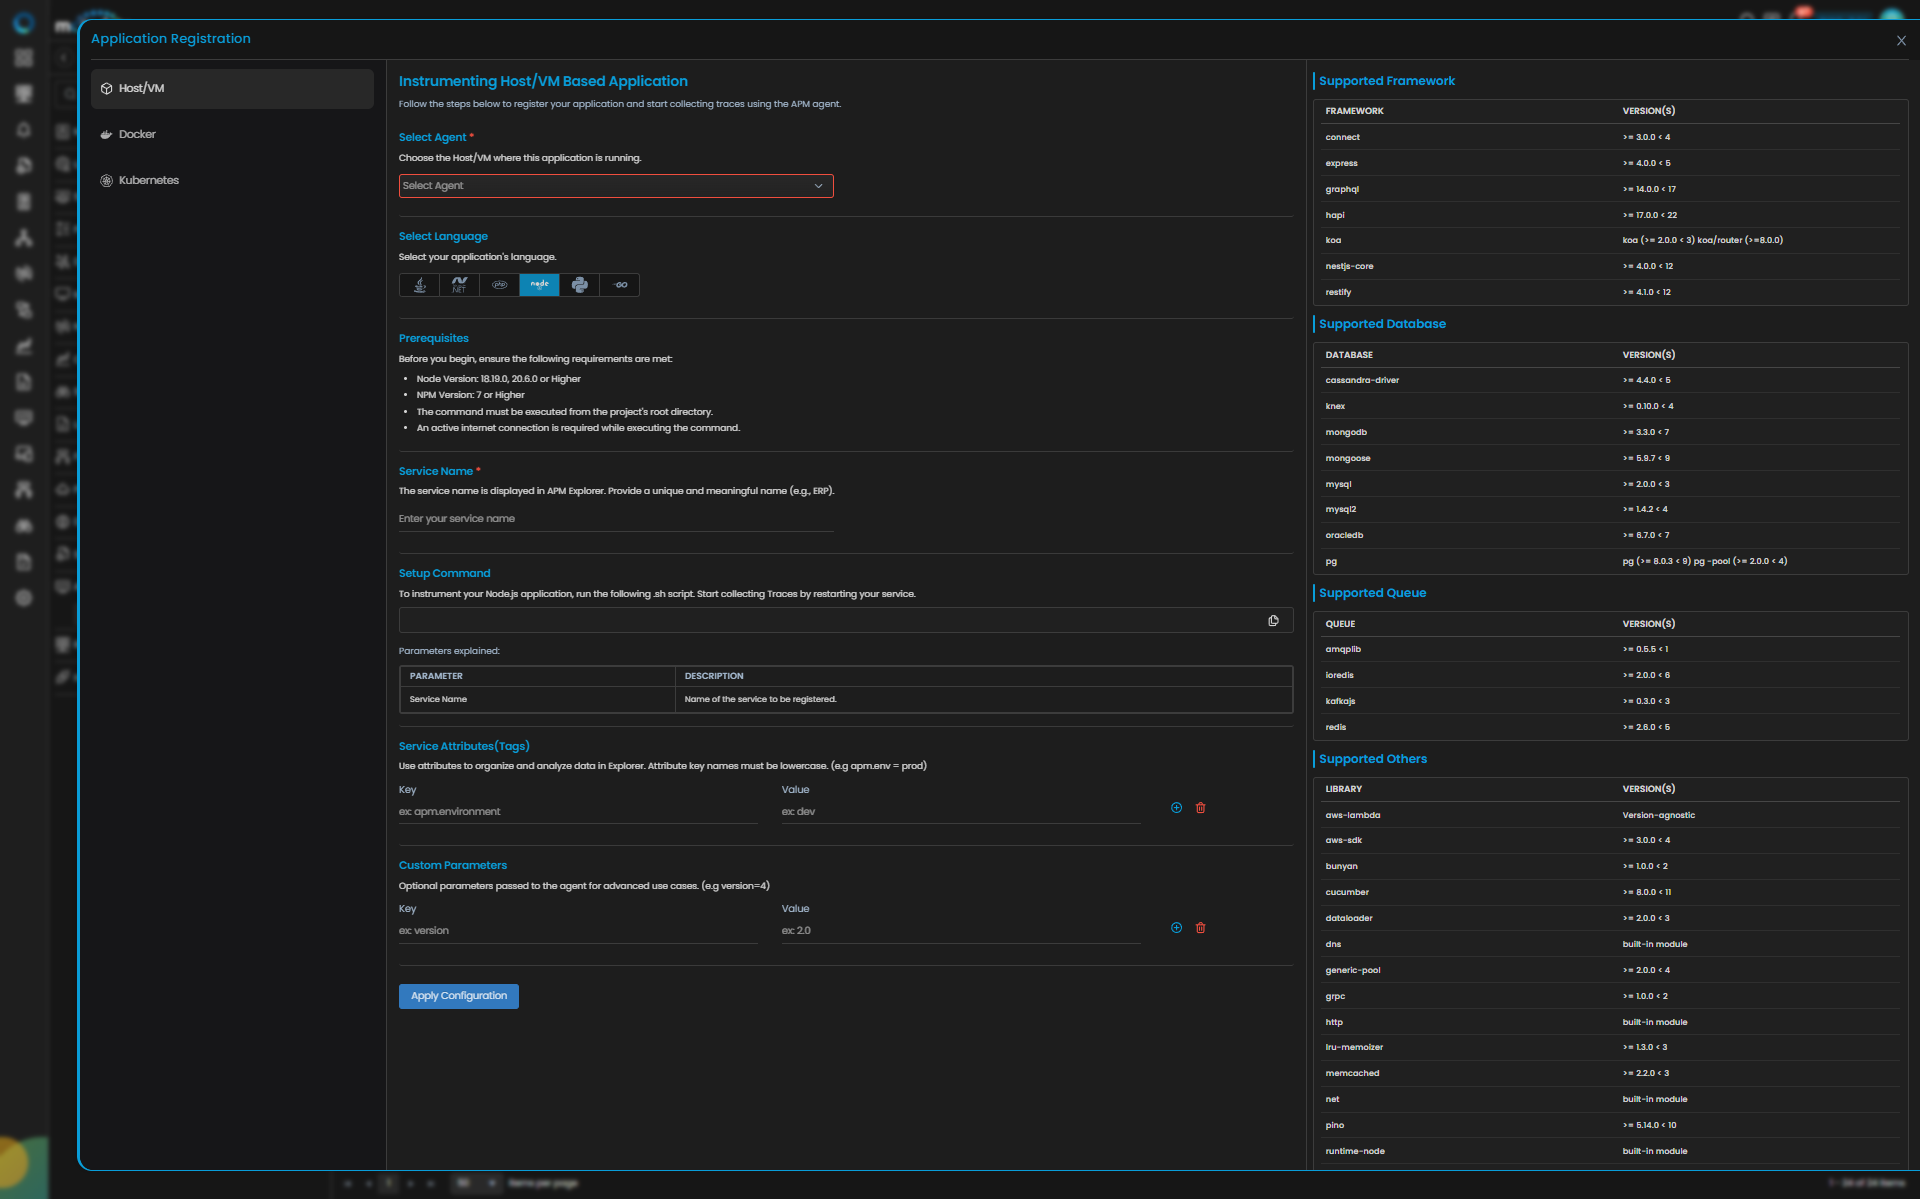
NodeJS Trace Configuration
| Field | Description |
|---|---|
| Select Agent | Select the Host/VM where this application is running. You can configure NodeJS application service for both Windows and Linux type agent. |
| Language | Select NodeJS from the language icons. |
| Business Service | The business service represents a logical grouping of related microservices under a single business application (e.g., Order Management). Adding or selecting the available service group from the drop-down will add your application service to the dedicated business service group. |
| Service Name | Provide a unique and meaningful name (e.g., payment_gateway). |
| Service Attributes (Tags) | Add key–value tags to your application for better filtering and organizing data in Explorer. Attribute key names must be lowercase (for example, apm.env = prod). To add multiple Key-Value pairs, click the add icon. |
| Add Custom Parameters | Allows you to define custom sampling or tagging parameters for advanced use cases. These optional parameters are passed to the agent (for example, version=4). |
Clicking the Apply Configuration button, the ingestion gets started.
Providing these details displays the Setup Command to instrument your NodeJS application. Run the generated script from the project’s root directory and restart the service to start collecting Traces.
You can configure Trace ingestion according to the framework used to build the application.
The below mentioned are the supported frameworks.
Supported Framework
The following frameworks are supported for instrumentation and monitoring. Ensure your application version aligns with the supported versions listed below.
| Framework | Version(s) |
|---|---|
| connect | ≥ 3.0.0 < 4 |
| express | ≥ 4.0.0 < 5 |
| graphql | ≥ 14.0.0 < 17 |
| hapi | ≥ 17.0.0 < 22 |
| koa | ≥ 2.0.0 < 3 |
| koa/router | ≥ 8.0.0 |
| nestjs-core | ≥ 4.0.0 < 12 |
| restify | ≥ 4.1.0 < 12 |
Supported Database
| Database | Version(s) |
|---|---|
| cassandra-driver | >= 4.4.0 < 5 |
| knex | >= 0.10.0 < 4 |
| mongodb | >= 3.3.0 < 7 |
| mongoose | >= 5.9.7 < 9 |
| mysql | >= 2.0.0 < 3 |
| mysql2 | >= 1.4.2 < 4 |
| oracledb | >= 6.7.0 < 7 |
| pg | pg (>= 8.0.3 < 9), pg-pool (>= 2.0.0 < 4) |
Supported Queue
| Queue | Version(s) |
|---|---|
| amqplib | >= 0.5.5 < 1 |
| ioredis | >= 2.0.0 < 6 |
| kafkajs | >= 0.3.0 < 3 |
| redis | >= 2.6.0 < 5 |
Supported Others
| Library | Version(s) |
|---|---|
| aws-lambda | Version-agnostic |
| aws-sdk | >= 3.0.0 < 4 |
| bunyan | >= 1.0.0 < 2 |
| cucumber | >= 8.0.0 < 11 |
| dataloader | >= 2.0.0 < 3 |
| dns | built-in module |
| generic-pool | >= 2.0.0 < 4 |
| grpc | >= 1.0.0 < 2 |
| http | built-in module |
| lru-memoizer | >= 1.3.0 < 3 |
| memcached | >= 2.2.0 < 3 |
| net | built-in module |
| pino | >= 5.14.0 < 10 |
| runtime-node | built-in module |
| socket.io | >= 2.0.0 < 5 |
| undici | >= 5.12.0 |
| winston | >= 1.0.0 < 4 |
Once the Application is Running, you need to verify the below points:
- Confirm that the service has been registered successfully.
- On the service registration screen, the Service Trace Collection Status should display "Running."
- The traces will start appearing in the APM Explorer screen.
- Docker Run
- Docker Compose
- Docker Swarm
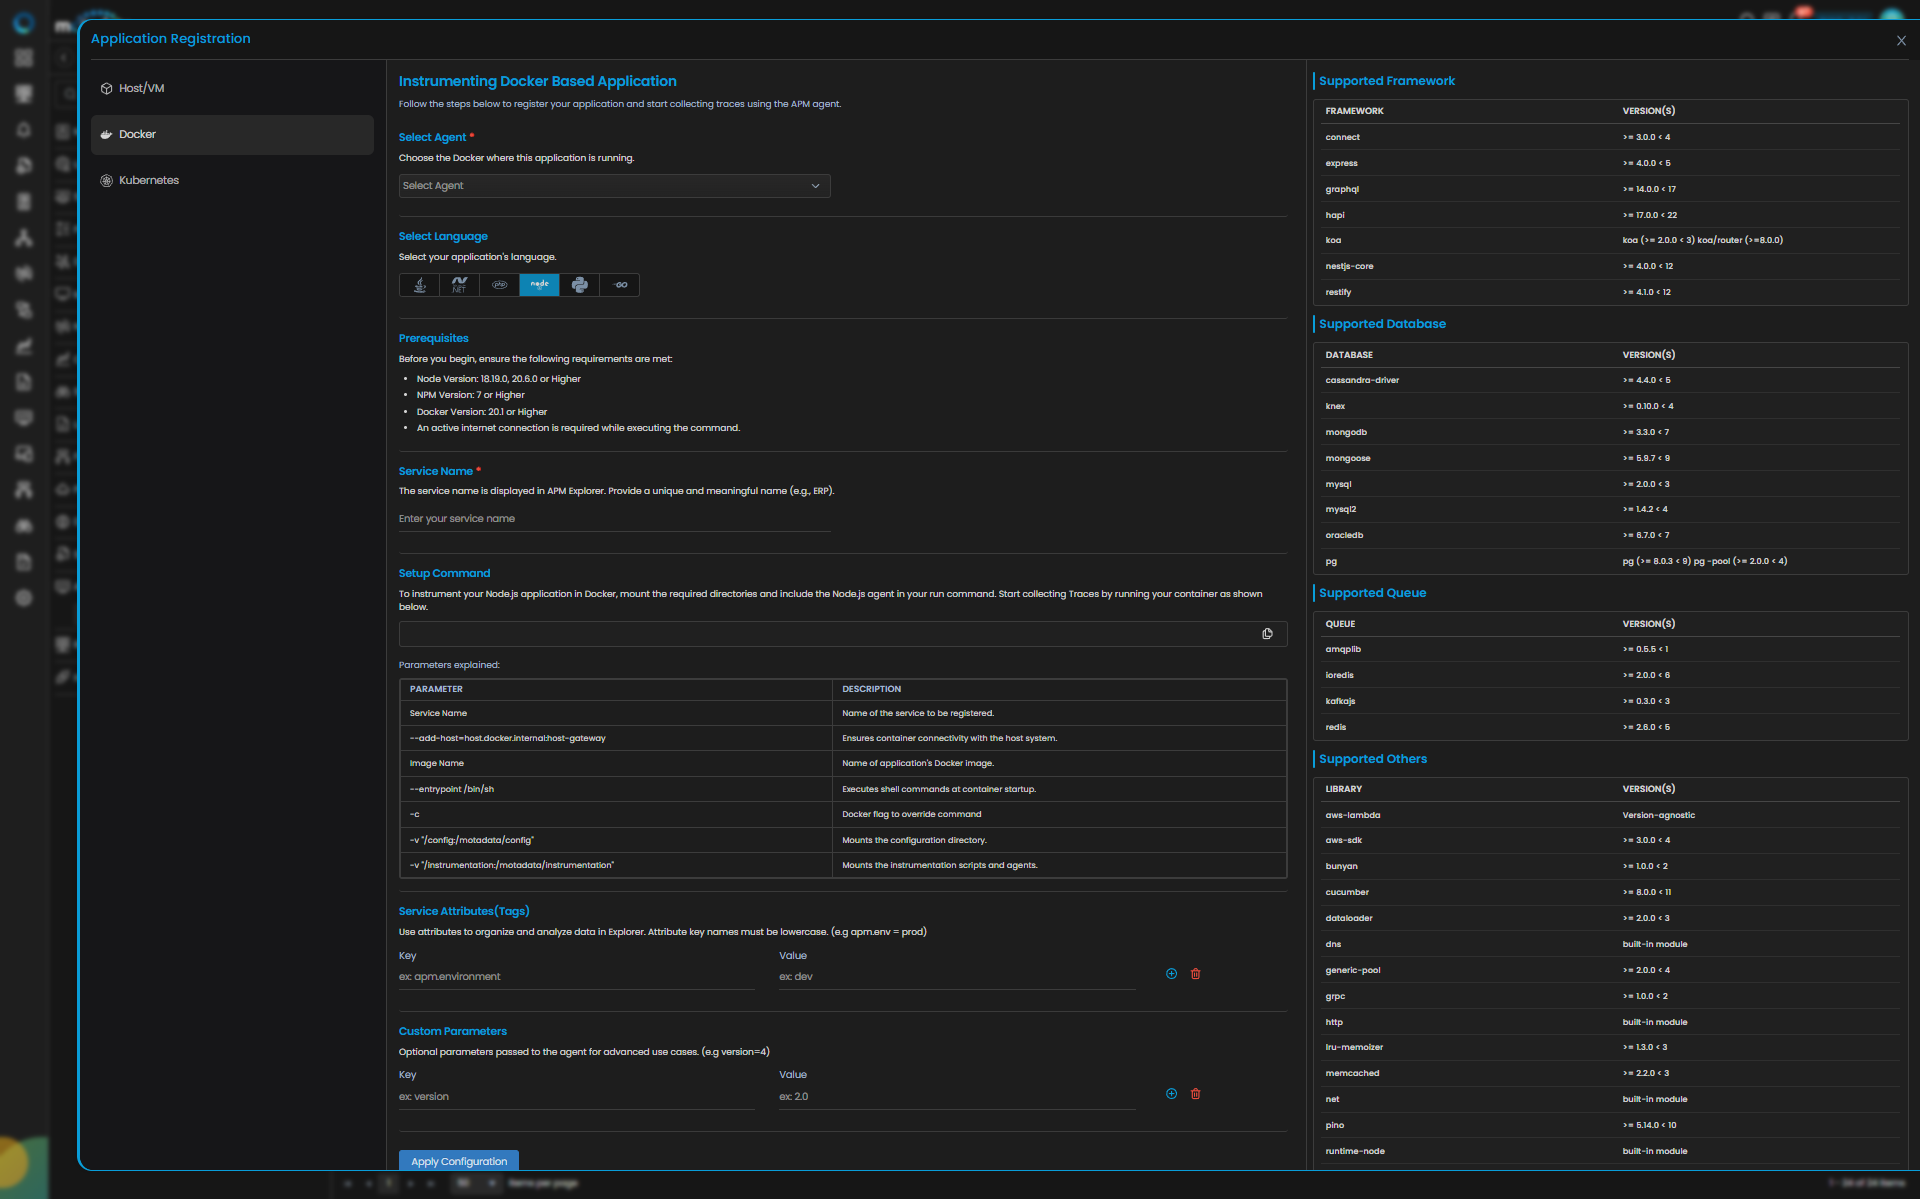
NodeJS Trace Configuration
| Field | Description |
|---|---|
| Select Agent | Select the Docker host where this application is running. You can configure NodeJS application service using Linux type agent. |
| Language | Select NodeJS from the language icons. |
| Business Service | The business service represents a logical grouping of related microservices under a single business application (e.g., Order Management). Adding or selecting the available service group from the drop-down will add your application service to the dedicated business service group. |
| Service Name | Provide a unique and meaningful name (e.g., payment_gateway). |
| Image Name | Provide the Docker image name. |
| Service Attributes (Tags) | Add key–value tags to your application for better filtering and organizing data in Explorer. Attribute key names must be lowercase (for example, apm.env = prod). To add multiple Key-Value pairs, click the add icon. |
| Add Custom Parameters | Allows you to define custom sampling or tagging parameters for advanced use cases. These optional parameters are passed to the agent (for example, version=4). |
Clicking the Apply Configuration button, the ingestion gets started.
Providing these details displays the Setup Command to instrument your NodeJS application inside Docker. Run the generated command on the Docker host and restart the container to start collecting Traces.
You can configure Trace ingestion according to the framework used to build the application.
The below mentioned are the supported frameworks.
Supported Framework
The following frameworks are supported for instrumentation and monitoring. Ensure your application version aligns with the supported versions listed below.
| Framework | Version(s) |
|---|---|
| connect | ≥ 3.0.0 < 4 |
| express | ≥ 4.0.0 < 5 |
| graphql | ≥ 14.0.0 < 17 |
| hapi | ≥ 17.0.0 < 22 |
| koa | ≥ 2.0.0 < 3 |
| koa/router | ≥ 8.0.0 |
| nestjs-core | ≥ 4.0.0 < 12 |
| restify | ≥ 4.1.0 < 12 |
Supported Database
| Database | Version(s) |
|---|---|
| cassandra-driver | >= 4.4.0 < 5 |
| knex | >= 0.10.0 < 4 |
| mongodb | >= 3.3.0 < 7 |
| mongoose | >= 5.9.7 < 9 |
| mysql | >= 2.0.0 < 3 |
| mysql2 | >= 1.4.2 < 4 |
| oracledb | >= 6.7.0 < 7 |
| pg | pg (>= 8.0.3 < 9), pg-pool (>= 2.0.0 < 4) |
Supported Queue
| Queue | Version(s) |
|---|---|
| amqplib | >= 0.5.5 < 1 |
| ioredis | >= 2.0.0 < 6 |
| kafkajs | >= 0.3.0 < 3 |
| redis | >= 2.6.0 < 5 |
Supported Others
| Library | Version(s) |
|---|---|
| aws-lambda | Version-agnostic |
| aws-sdk | >= 3.0.0 < 4 |
| bunyan | >= 1.0.0 < 2 |
| cucumber | >= 8.0.0 < 11 |
| dataloader | >= 2.0.0 < 3 |
| dns | built-in module |
| generic-pool | >= 2.0.0 < 4 |
| grpc | >= 1.0.0 < 2 |
| http | built-in module |
| lru-memoizer | >= 1.3.0 < 3 |
| memcached | >= 2.2.0 < 3 |
| net | built-in module |
| pino | >= 5.14.0 < 10 |
| runtime-node | built-in module |
| socket.io | >= 2.0.0 < 5 |
| undici | >= 5.12.0 |
| winston | >= 1.0.0 < 4 |
Once the Application is Running, you need to verify the below points:
- Confirm that the service has been registered successfully.
- On the service registration screen, the Service Trace Collection Status should display "Running."
- The traces will start appearing in the APM Explorer screen.
Prerequisites
Ensure the following are in place before proceeding:
| Requirement | Details |
|---|---|
| Docker & Docker Compose installed | docker --version and docker-compose --version |
| Application already running via Compose | docker ps shows the app container |
| Agent files available on host | Confirm agent binary and config files exist under /motadata/motadata/ |
docker-compose.yml accessible | In the application's project directory |
Understanding the Generated Instrumentation Command
Motadata generates a docker run instrumentation command when you click Apply Configuration. Do not run this command directly if the application is managed by Docker Compose. Instead, translate the volume mount flags into docker-compose.yml as described below.
Step 1 — Verify Agent Files on the Host
Confirm the agent and config files exist on the host machine:
ls /motadata/motadata/instrumentation/
ls /motadata/motadata/config/
If either file is missing, contact the Motadata team before proceeding.
Step 2 — Open docker-compose.yml
Navigate to the application's project directory:
cd /path/to/your/project
cat docker-compose.yml
Identify the app service block — this is the service running your application.
Step 3 — Add Volume Mounts
Locate the volumes: section under the app service and append the two instrumentation mounts.
Before:
    volumes:
      - ./logs:/app/logs
After:
    volumes:
      - ./logs:/app/logs
      - /motadata/motadata/instrumentation:/motadata/instrumentation
      - /motadata/motadata/config:/motadata/config
If no
volumes:section exists, add it at the same indentation level asenvironment:,ports:, etc.
Step 4 — Validate the YAML
docker-compose config
This prints the resolved configuration. If there are errors, fix them before proceeding.
Step 5 — Restart the Application
docker-compose down
docker-compose up -d --build
Step 6 — Verify Containers Are Running
docker ps
Both the app and any dependent services should show status Up.
Step 7 — Confirm Agent Loaded Successfully
Check the container logs to confirm the agent initialized correctly:
docker logs <container_name>
Prerequisites
Ensure the following are in place before proceeding with instrumentation.
| Prerequisite | Requirement / Details |
|---|---|
| Docker & Docker Swarm enabled | Docker 20.10 or higher; run docker swarm init on the manager node |
| Docker image available | The service image must be accessible (local registry or Docker Hub) |
| Agent files available on host | Confirm agent binary and config files exist under /motadata/motadata/ |
docker-compose.yml accessible | In the application's project directory |
All worker nodes must be joined to the swarm before deploying instrumented services.
Understanding the Generated Instrumentation Command
Motadata generates a docker run instrumentation command when you click Apply Configuration. Do not run this command directly if the application is managed by Docker Swarm. Instead, translate the volume mount flags into docker-compose.yml as described below.
Step 1 — Verify Agent Files on the Host
Confirm the agent and config files exist on the host machine:
ls /motadata/motadata/instrumentation/
ls /motadata/motadata/config/
If either file is missing, contact the Motadata team before proceeding.
Step 2 — Open docker-compose.yml
Navigate to the application's project directory:
cd /path/to/your/project
cat docker-compose.yml
Identify the app service block — this is the service running your application.
Step 3 — Add extra_hosts
Add the host gateway mapping so the agent inside the container can reach the APM collector on the host:
Before:
    ports:
      - "8080:8080"
After:
    ports:
      - "8080:8080"

    extra_hosts:
      - "host.docker.internal:host-gateway"
Step 4 — Add Volume Mounts
Append the two instrumentation mounts to the volumes: section under the app service:
Before:
    volumes:
      - ./logs:/app/logs
After:
    volumes:
      - ./logs:/app/logs
      - /motadata/motadata/instrumentation:/motadata/instrumentation
      - /motadata/motadata/config:/motadata/config
If no
volumes:section exists, add it at the same indentation level asenvironment:,ports:, etc.
Step 5 — Validate the YAML
docker-compose config
This prints the resolved configuration. If there are errors, fix them before proceeding.
Step 6 — Deploy the Stack
docker stack deploy -c docker-compose.yml <stack_name>
To update an already-running stack:
docker stack deploy -c docker-compose.yml <stack_name> --with-registry-auth
Step 7 — Verify Services Are Running
docker service ls
The instrumented service should show the expected number of replicas in the REPLICAS column (e.g. 2/2).
Step 8 — Confirm Agent Loaded Successfully
Check the container logs to confirm the agent initialized correctly:
docker service ps <stack_name>_<service_name>
docker logs <container_id>