Topology in ObserveOps — Network, Cloud, SDN, HCI, and Custom Views
The Topology section in ObserveOps gives you a live visual map of your entire IT infrastructure. Instead of reading through device lists or alert tables, you see how your devices connect, what their health status is right now, and where a fault is spreading. The map updates automatically as your infrastructure changes, so you never work from a stale picture.
Prerequisites
- Devices must be discovered and configured as monitors in ObserveOps before they appear in any topology tab.
- For Network topology: devices must run at least one supported L2 or L3 discovery protocol.
- For Cloud, Virtualization, SDN, and HCI topology: polling must be active for the relevant monitors.
- For Custom View: you must hold the Admin or Operator role to create or edit views.
How Topology Works
ObserveOps builds topology maps from two different sources depending on the infrastructure type.
Network topology is built by a Topology Scanner that you schedule. The scanner starts from a seed device you choose, queries that device for its neighbors using L2 or L3 protocols, and walks the network recursively until the full map is built. The sidebar tree reflects the seed devices and the groups they are organized under.
Cloud, Virtualization, SDN, and HCI topology is built automatically from polling data. No scan scheduler is needed. ObserveOps reads the relationships between your cloud accounts, regions, hosts, and virtual machines from the data already collected by the monitoring engine. The map appears as soon as polling data is available.
The Six Topology Tabs
Go to Topology from the main navigation menu. Six tabs appear across the top of the page.
| Tab | What It Shows | How the Map Is Built |
|---|---|---|
| Network | Physical network devices — switches, routers, firewalls — and the Layer 2 and Layer 3 links between them | Topology Scanner (scheduled or on-demand) |
| SDN | Software-defined network components, specifically Cisco SD-WAN fabrics including WAN Edge devices and Manager nodes | Auto-generated from polling data |
| Cloud | Cloud provider accounts and their regions — AWS and Azure infrastructure as connected resource groups | Auto-generated from polling data |
| Virtualization | Hypervisor hosts and the virtual machines running on them — VMware ESXi, vCenter, Proxmox VE, KVM, Citrix Xen, Hyper-V | Auto-generated from polling data |
| HCI | Hyper-converged infrastructure clusters and their components — Nutanix clusters with AHV hosts and virtual machines | Auto-generated from polling data |
| Custom | Personalized topology layouts you design and save — combine nodes from any monitoring domain into a single canvas | Manual, user-created |
Node Health Colors
Every node on a topology canvas shows a color that reflects its current health state. The same color coding applies across all tabs.
| Color | Health State | What It Means |
|---|---|---|
| Green | Clear | The monitor is healthy and all checks are passing |
| Red | Critical | One or more critical monitors have failed or the device is unreachable |
| Orange | Warning | At least one monitor is in a warning state |
| Purple / Gray with X | Unknown | The device is monitored but no status data is available |
Sidebar Navigation
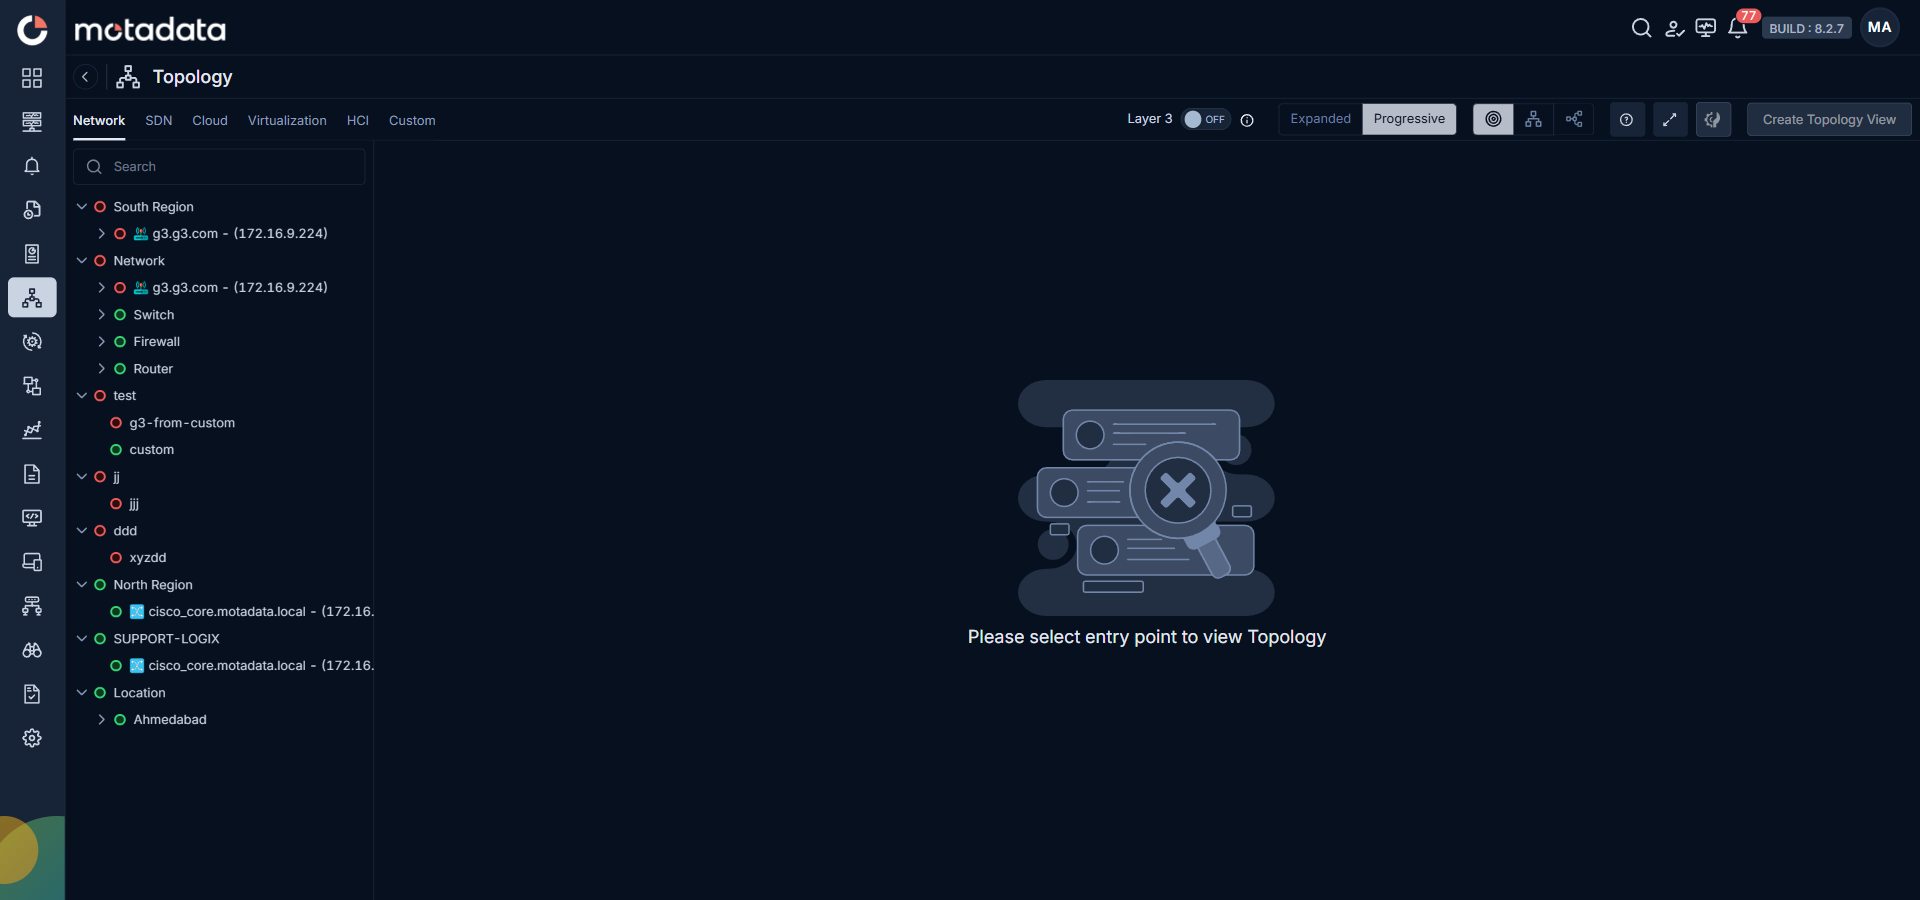
Each tab shows a sidebar tree on the left. The tree organizes topology entry points into groups based on how your infrastructure is structured — for example, by region, vendor, or a custom group you defined when creating a topology view.
Click any entry in the tree to load that device's topology map on the canvas. The canvas shows the selected entry point as the central node and draws all connected nodes around it. Click any node on the canvas to open its detail panel with live metrics and alert history.