Network Topology in ObserveOps
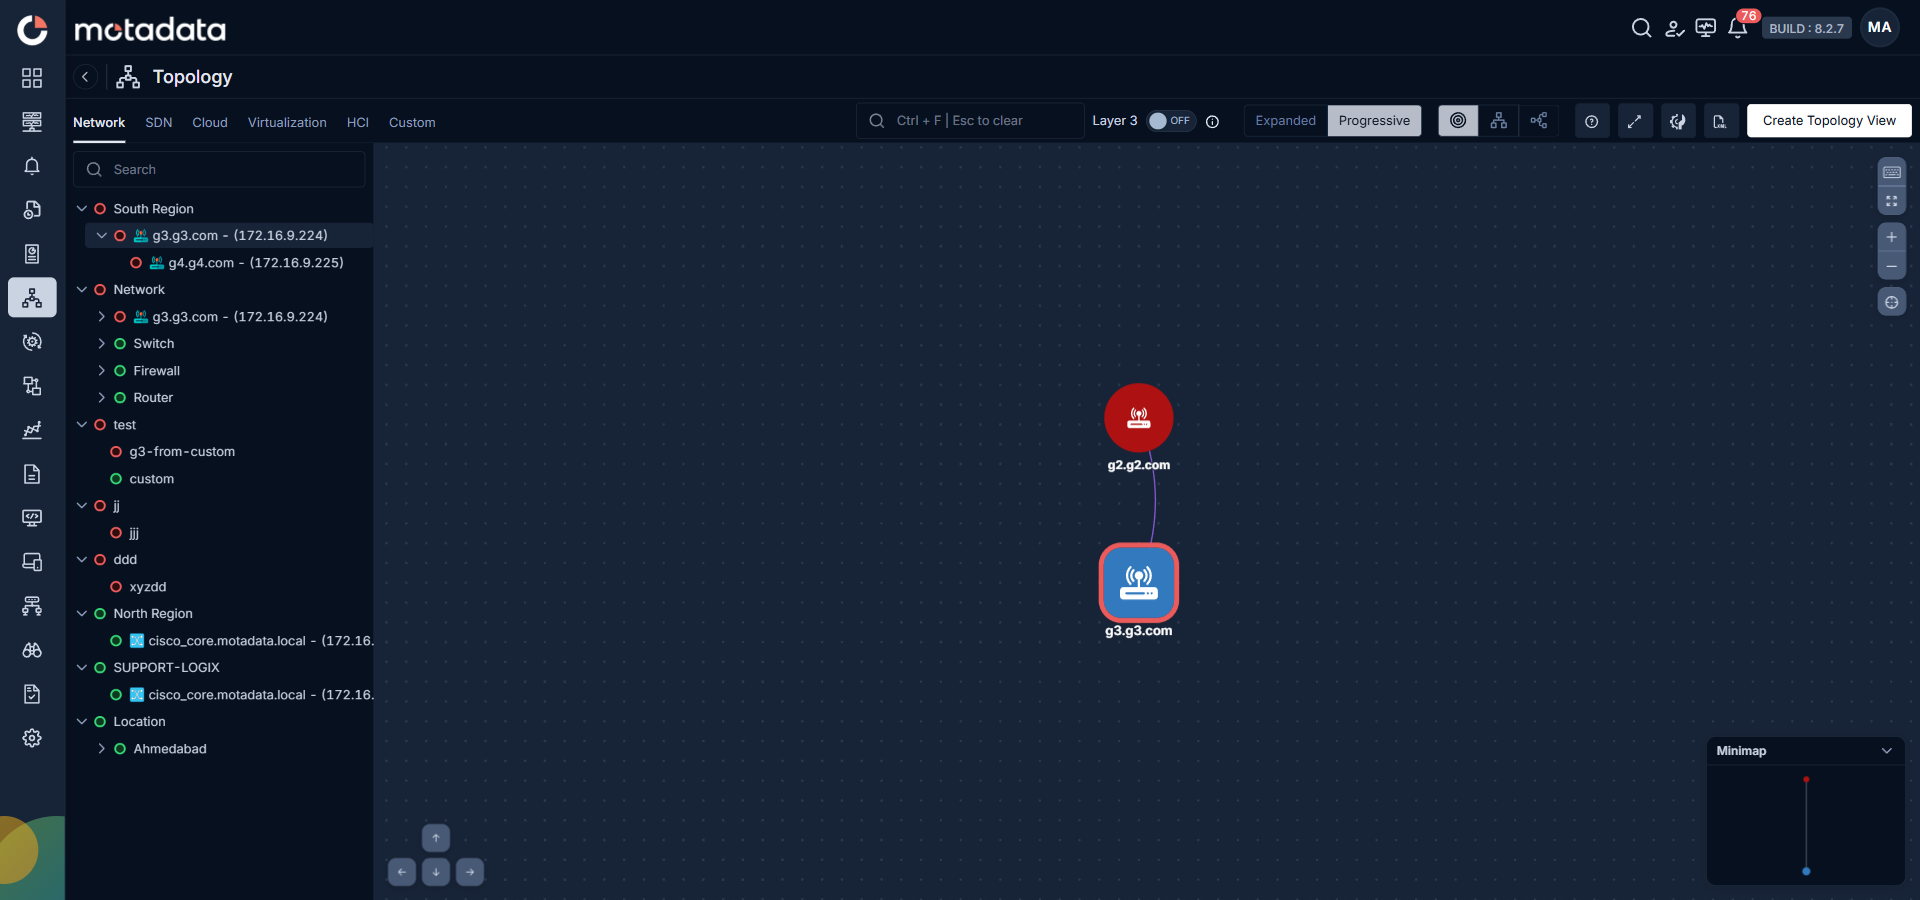
The Network tab in ObserveOps shows a visual map of your physical network infrastructure — switches, routers, firewalls, and the Layer 2 and Layer 3 links between them. The map is built by a Topology Scanner that you schedule. Once the scan runs, the sidebar tree shows all discovered seed devices and you can click any entry to load its topology map on the canvas.
Prerequisites
- Each device must be discovered and configured as a monitor in ObserveOps.
- Each device must have at least one supported Layer 2 or Layer 3 discovery protocol enabled and reachable from the ObserveOps server.
Supported Protocols
ObserveOps uses these protocols to discover the connections between network devices:
Layer 2 protocols:
| Protocol | Full Name |
|---|---|
| CDP | Cisco Discovery Protocol |
| LLDP | Link Layer Discovery Protocol |
| SPM | Switch Port Mapping |
Layer 3 protocols:
| Protocol | Full Name |
|---|---|
| OSPF | Open Shortest Path First |
| BGP | Border Gateway Protocol |
| ISIS | Intermediate System to Intermediate System |
How Network Topology Is Built
The Topology Scanner starts from a seed device that you specify. It queries that device using the configured L2 or L3 protocol to find the neighboring devices it connects to. For each neighbor found, the scanner records the link, identifies the interfaces at each end, and then queries the neighbor for its own neighbors. This process repeats recursively until no new neighbors are found.
The result is a map that starts at your chosen seed device and expands outward to every device reachable through the discovery protocols. Each seed device you scan appears as a separate entry in the Network sidebar tree.
Configure the Topology Scanner
Go to Settings. Select Monitor Settings, then select Topology Scanner.
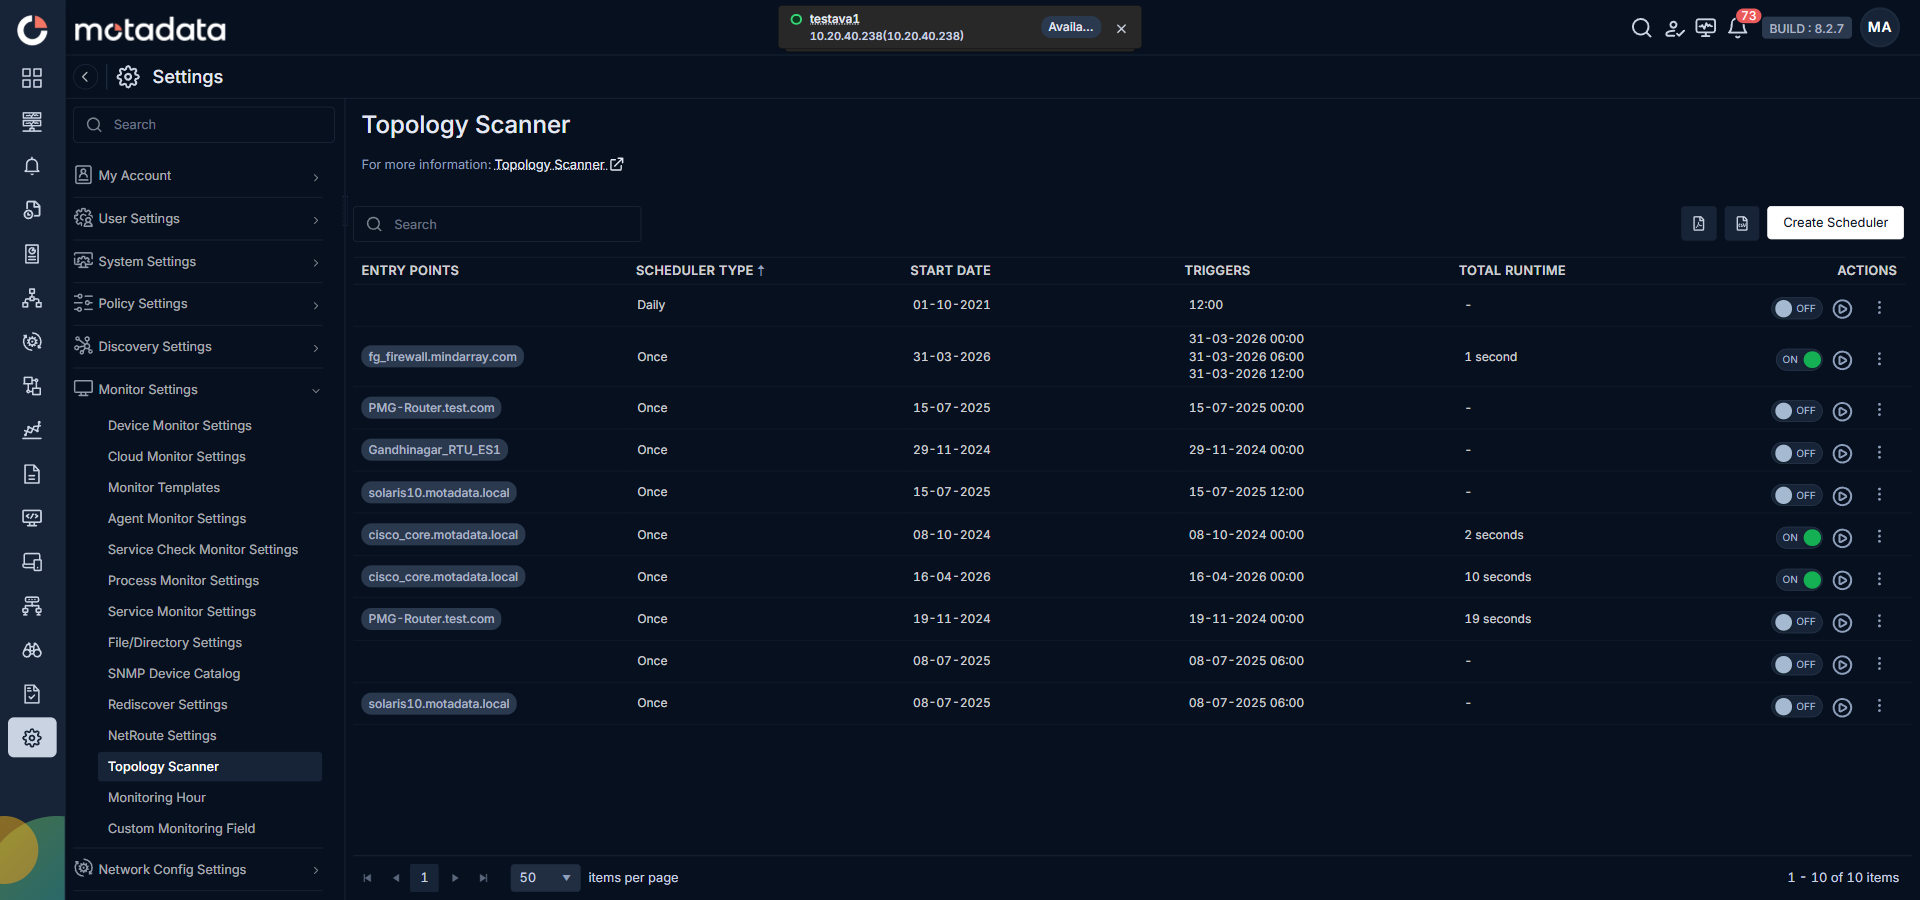
Click Create Scheduler to add a new scan.
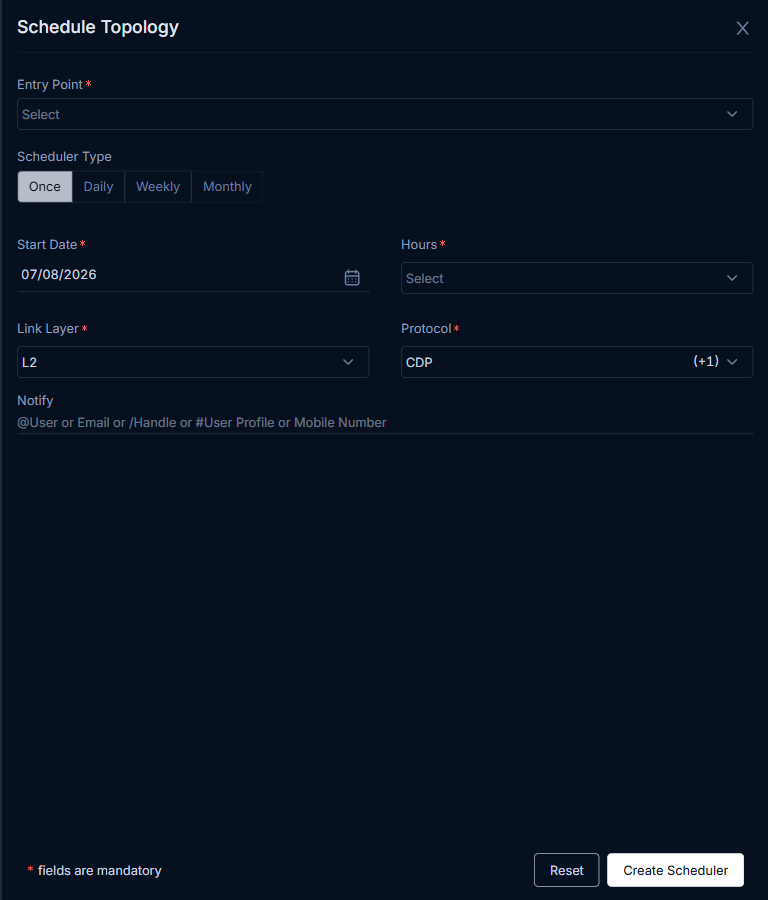
Fill in the scheduler details:
| Field | Description |
|---|---|
| Entry Point | The seed device where the scan starts. ObserveOps queries this device first and discovers all neighbors from it outward. Choose a core or distribution-layer device for the widest map coverage. |
| Scheduler Type | How often the scan runs. Select Once, Daily, Weekly, or Monthly based on how frequently your network topology changes. |
| Start Date | The date the scheduler becomes active and runs for the first time. |
| Hours | The time of day the scan starts. Schedule scans during low-traffic periods to minimize protocol query load on devices. |
| Days | The days of the week the scan runs. Available only when Scheduler Type is Weekly. |
| Months | The months the scan runs. Available only when Scheduler Type is Monthly. |
| Dates | The specific dates within a month the scan runs. Available only when Scheduler Type is Monthly. |
| Link Layer | Select L2, L3, or both. L2 maps switch-level connections. L3 maps routed connections between subnets. Select both for a complete picture of your network. |
| Protocol | Auto-selected based on your Link Layer choice. You can deselect individual protocols if certain devices do not support them. |
| Notify Teams | Email addresses or user handles that receive a notification when the scan completes. |
Click Create Scheduler to save. To run a scan immediately without waiting for the schedule, click the run icon next to the scheduler in the list.
View the Network Topology Map
Go to Topology from the main navigation menu. Select the Network tab.
The sidebar tree on the left shows all topology entry points organized into groups. Groups appear based on the Topology View Group name you set when creating a topology view, or as default seed-device entries if no group was assigned.
Click any entry in the tree to load the topology map for that device on the canvas. The selected device appears as the central node. All devices connected to it through the discovery protocols appear as surrounding nodes, connected by lines that represent the actual links.
Sidebar Tree Structure
| Element | What It Represents |
|---|---|
| Top-level group | A named group you created using Create Topology View, or a default category such as "Network" |
| Seed device | The entry point device for a scan — click it to load its topology map |
| Sub-groups | Nested categories within a group, organized by switch type, location, or any label you assigned |
Use the Search box above the tree to filter entries by device name or IP address when your sidebar has many entries.
Expanded vs Progressive View
The toolbar above the canvas has two layout options:
| Option | What It Does |
|---|---|
| Expanded | Loads the entire topology map at once — all discovered nodes appear on the canvas simultaneously |
| Progressive | Loads the topology level by level, starting from the seed node and expanding outward — useful for very large maps where loading everything at once makes the canvas hard to read |
Layer 3 Toggle
The Layer 3 switch in the toolbar controls whether Layer 3 routing devices appear on the Network topology canvas. Toggle it ON to include routers and inter-subnet paths in the map. Toggle it OFF to show only Layer 2 switching paths. Use this when you want to separate your switching topology from your routing topology for clarity.
Create Topology View
After loading a topology map, click Create Topology View in the toolbar to save a named, filtered version of that topology in the sidebar.
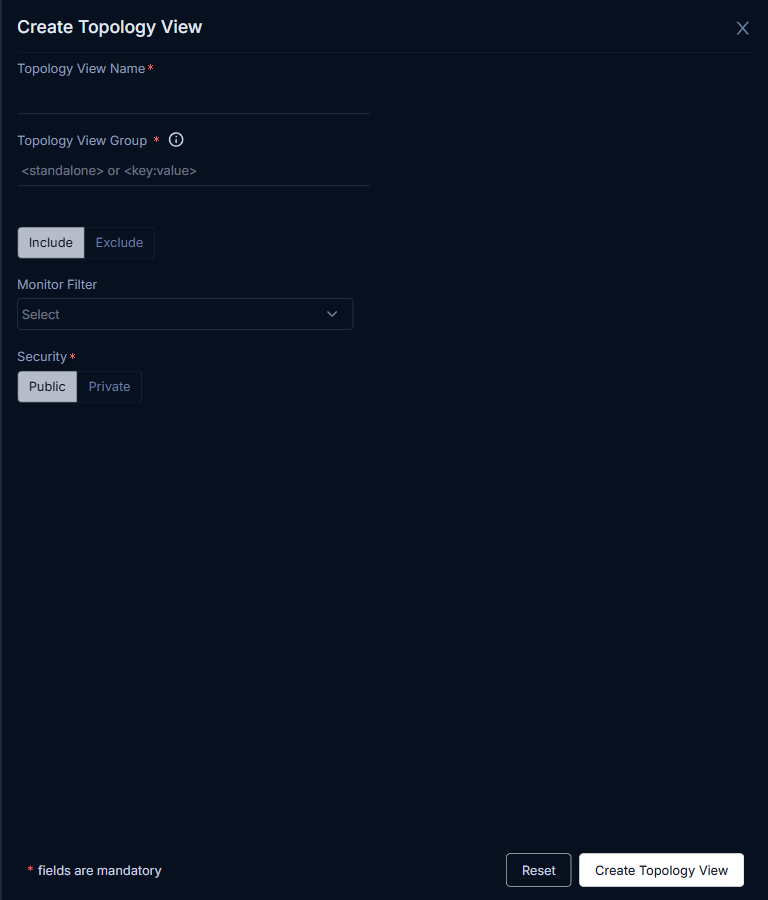
| Field | Description |
|---|---|
| Topology Name | The display name for this view in the sidebar tree. Use a name that identifies the scope, such as "Core Switches" or "Data Center North." |
| Topology View Group | The group label under which this view appears in the sidebar. Use groups to organize views by location, tier, or team. |
| Include / Exclude | Controls whether the Monitor Filter you set below adds or removes devices from the view. |
| Monitor Filter | Filters the devices shown in this view. Select Tag, Group, IP, or IP Range and then specify the values. Only devices matching the filter appear in the saved view. |
| Security | Set to Public so all users can see this view, or Private to limit it to your own account. |
Click Create Topology View to save. The view appears in the sidebar tree under the group name you specified.
Troubleshooting
The sidebar is empty after the scan completes
Cause: The seed device may not have returned any neighbor information from the configured protocol. This usually means the protocol is not enabled on the device, or the ObserveOps server cannot reach the device on the required port.
Fix: Confirm the discovery protocol is enabled on the seed device. Check that no firewall or ACL is blocking the protocol traffic between the ObserveOps server and the device. Then run the scanner again.
Devices are missing from the topology map
Cause: A device is connected to the network but was not discovered because it does not support the configured protocol, or because SNMP credentials on the device differ from what ObserveOps has stored.
Fix: Verify that the missing device supports at least one of the protocols configured in the scanner. Check the device's SNMP community string or SNMPv3 credentials in the monitor settings. Re-run the scan after updating credentials.
The topology map looks correct in the scanner but stale in the UI
Cause: The scanner ran and built the map, but the UI is showing cached data from a previous run.
Fix: Refresh the Topology page. If the map still looks stale, run the scanner again manually from the Topology Scanner screen and wait for it to complete before refreshing.