Default Dashboard
Whenever you log into the Technician Portal the Default Dashboard greets you. In the system, there are multiple Dashboards supported: Predefined Dashboard and Custom Dashboards; and any one of them can be made the Default Dashboard.
Predefined Dashboards are available to the users as per the license applied. Custom Dashboards are profile specific, meaning you can see your own (created) Dashboard plus the Dashboards that others have shared with you.
Accessing the Dashboard Page
Here, you can view all your Dashboards.
- Log in to the Technician Portal. The default Dashboard will greet you.
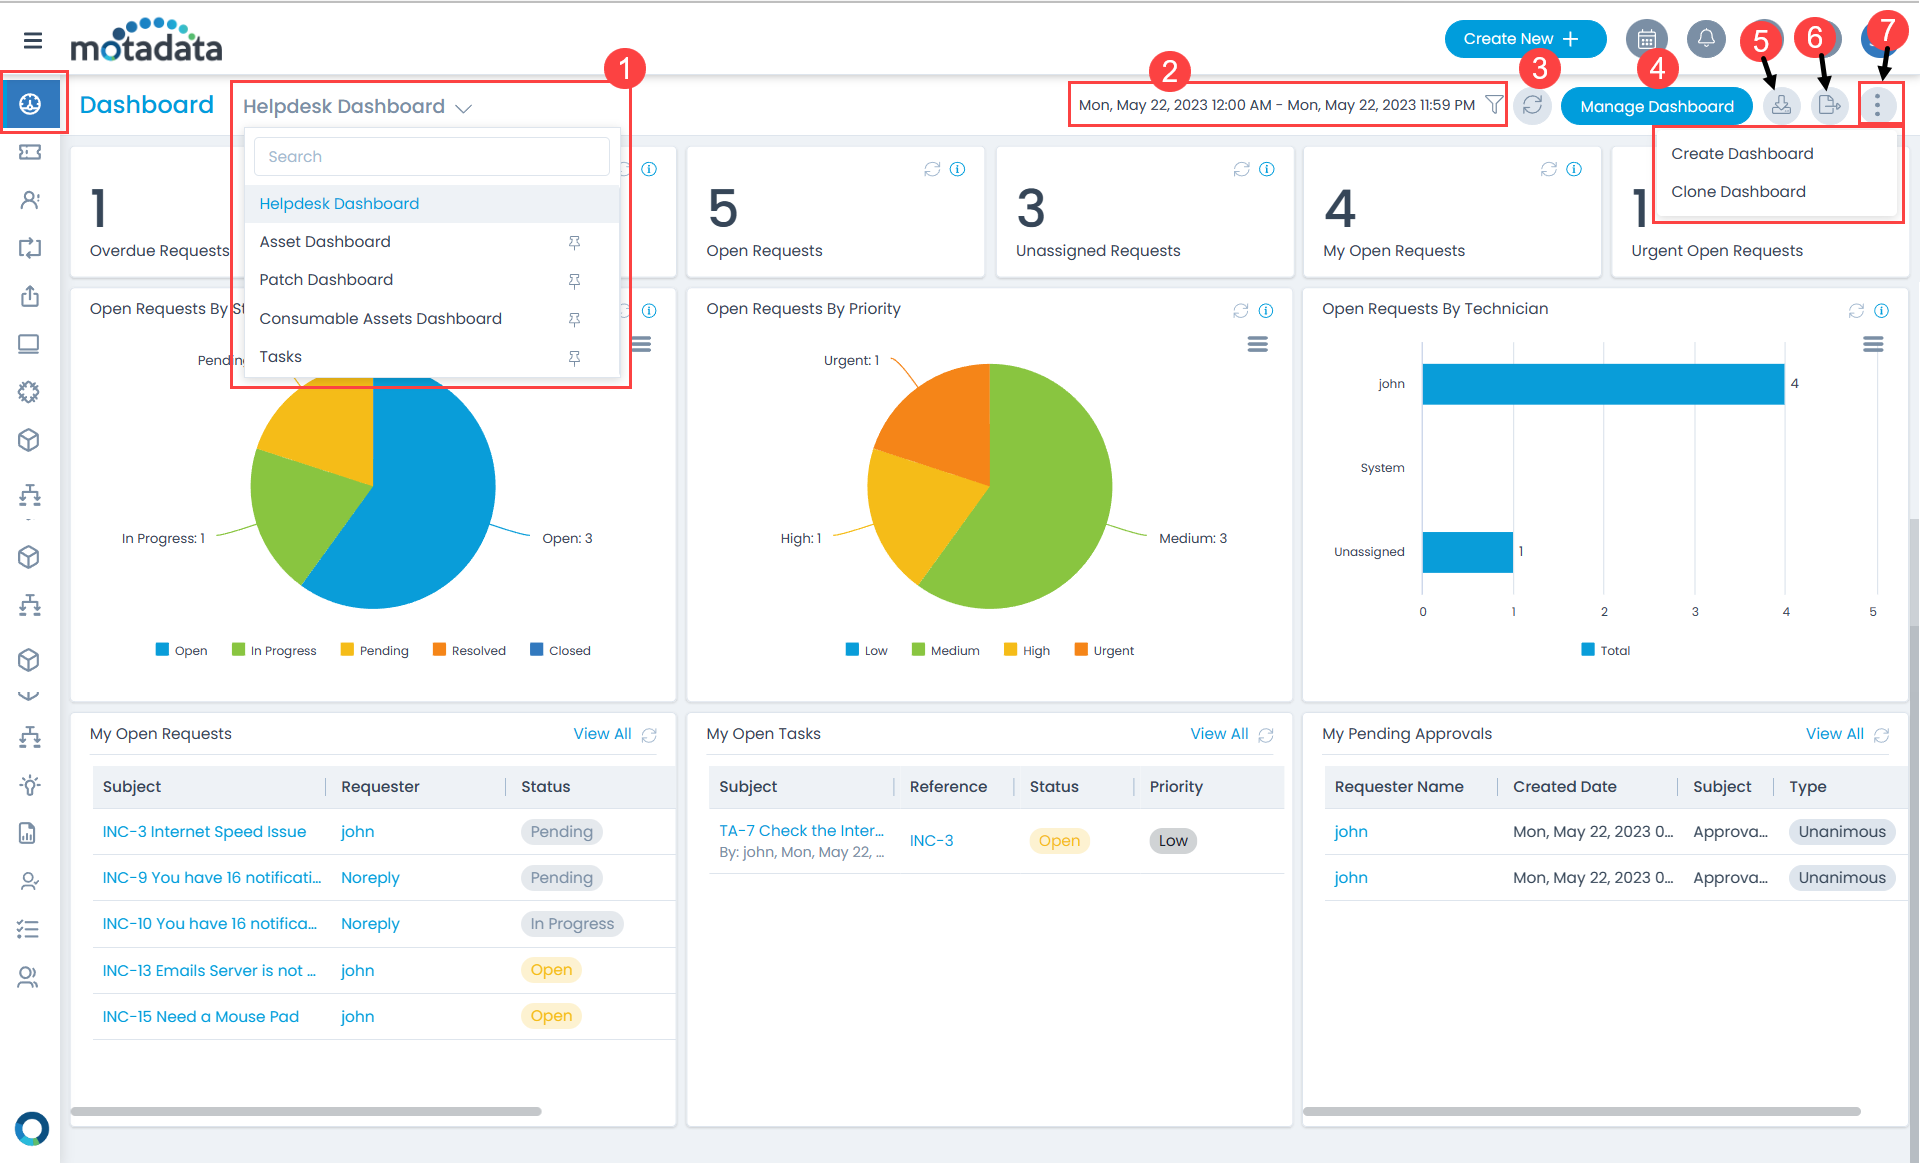
Here, you can do the following:
- Predefined Dashboards: You can select the dashboard that you want to view. The options are: Helpdesk Dashboard, Asset Dashboard, and Patch Dashboard. You can neither customize nor delete the predefined Dashboards.
- Filters: You can select the date range based on which you want to view the data.
- Refresh: You can refresh the entire dashboard page.
- Manage Dashboard: You can manage the dashboard by enabling or disabling any of them.
- Download: You can download the dashboard in PNG or PDF format.
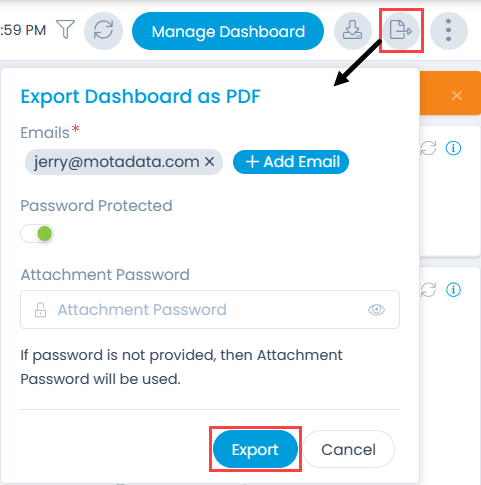
- Export: You can export the dashboard details in PDF format and share it via Email. It captures the details that are visible on the screen. You can also protect the attachment by enabling the Password Protected option and entering the Attachment Password. If not entered, the common password set from Edit User Profile will be used.
- More Options: You can create or clone a dashboard using the More Options icon (3 dots). To clone, select the required dashboard, click clone, make the required changes in the widgets or KPIs, and Update it. All the access level data will get copied. For more details on widgets and KPIs, refer to the Create Dashboard page.
Filters
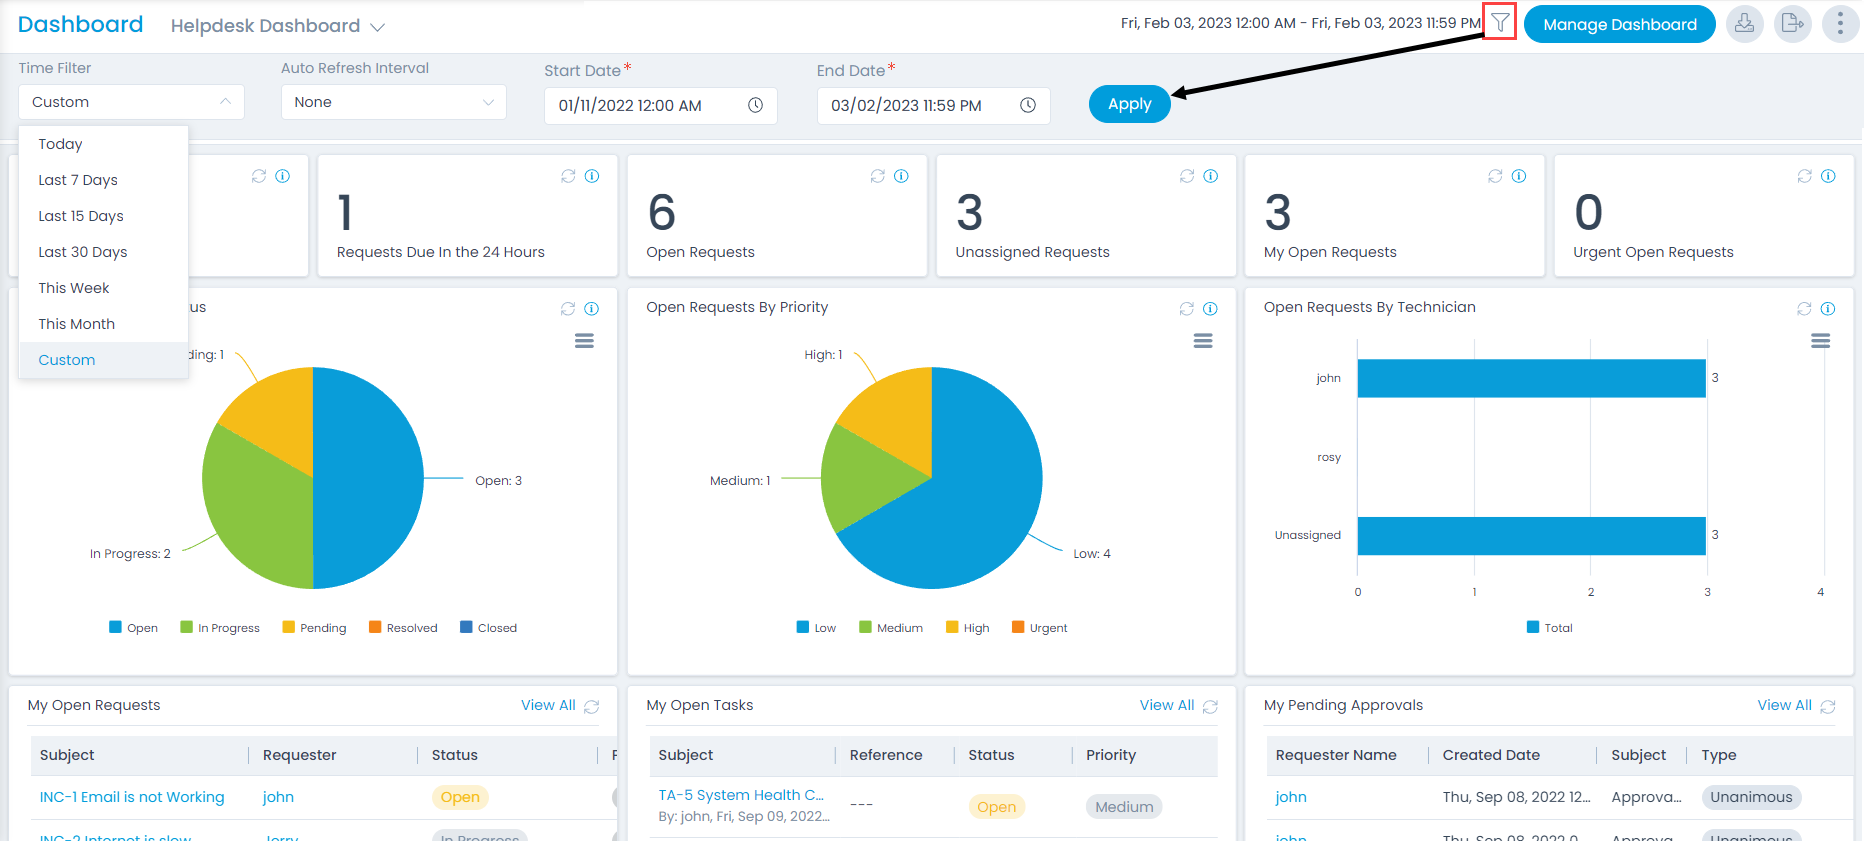
You can filter the data based on the following criteria:
- Time Filter: You can select a specific time interval based on which details can be viewed. The options are: Today, Last 7 Days, Last 15 Days, Last 30 Days, This Week, and This Month. You can also create a custom filter using which you can select a date range (Start and End Date) based on which details can be fetched.
- Auto Refresh Interval: You can set the interval within which the details will get refreshed and viewed automatically. The options are: 5, 10, 15, 20, 30 minutes.
Once the filter is selected, click Apply and the data will be fetched accordingly.
Manage Dashboard
To manage the dashboards, click the Manage Dashboard button on the top, and the below page appears.
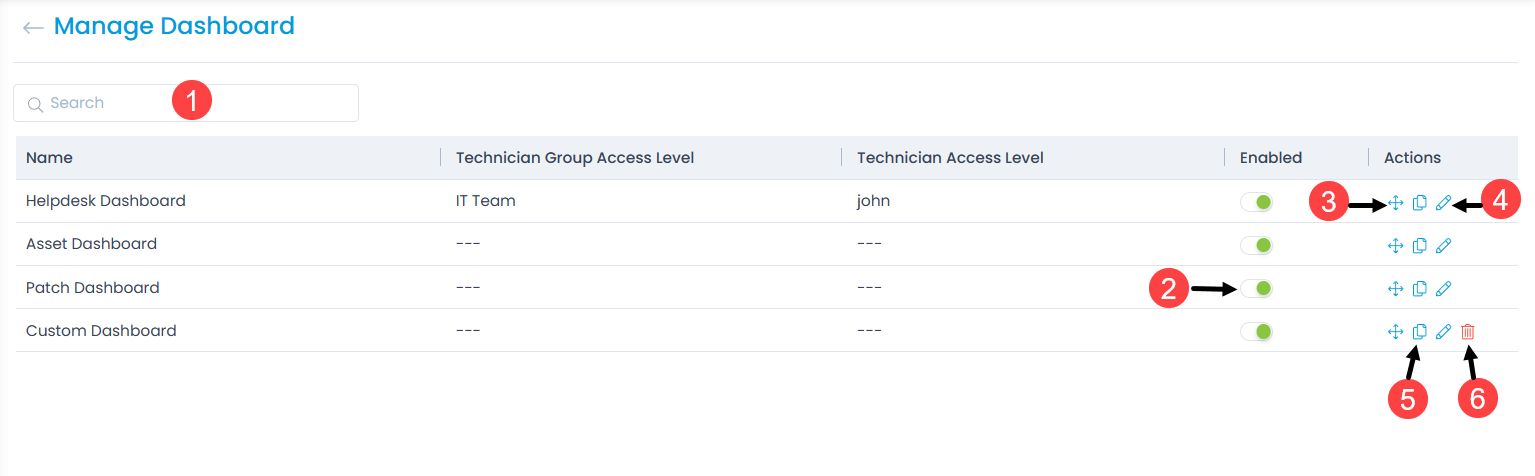
Here, you can do the following:
- Search: You can search for the required dashboard based on keywords.
- Enable/Disable: You can enable or disable a dashboard. If required you can also disable all the dashboards.
- Re-Order: You can change the order of the dashboards appearing in the list using drag and drop.
- Edit Dashboard: You can edit the Dashboard name and define the access level.
- Duplicate: You can create a duplicate copy of the dashboard if required.
- Delete: You can delete the dashboard if required. A confirmation message appears. Click Yes to continue or Cancel to stop the process. You can delete only the custom dashboards and not the default.