Create Dashboard
To create a dashboard,
Click the More Options (3 dots) icon on the top-right corner and select the Create Dashboard option. A popup appears.
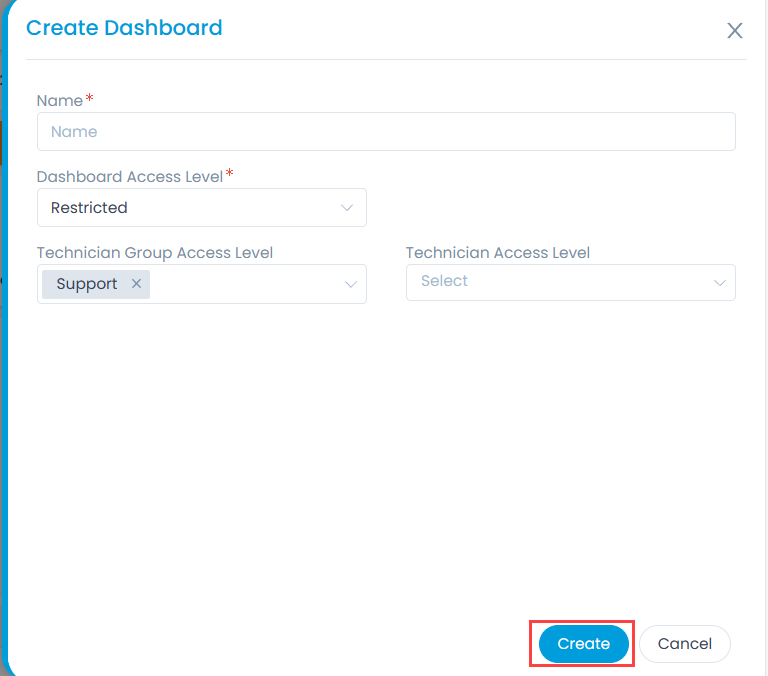
Enter the following details:
- Name: Enter the name of the dashboard.
- Dashboard Access Level: Select the Dashboard Access Level for sharing the Dashboard while creating, customizing, and editing it. The access level options are:
- Public: If selected, the Dashboard will be shared with all the Technicians with view-only rights.
- Private: If selected, the Dashboard will be available only to the creator of the Dashboard.
- Restricted: If selected, the Dashboard can be shared with the Technicians and Technician Groups. The fields Technician Group Access Level and Technician Access Level will be configurable.
- If the access level fields are kept blank, the dashboard will be accessible only to the creator of the dashboard and the Super Admin.
- The Customize button on the main page is available only to the creator of the Dashboard and Super Admin.
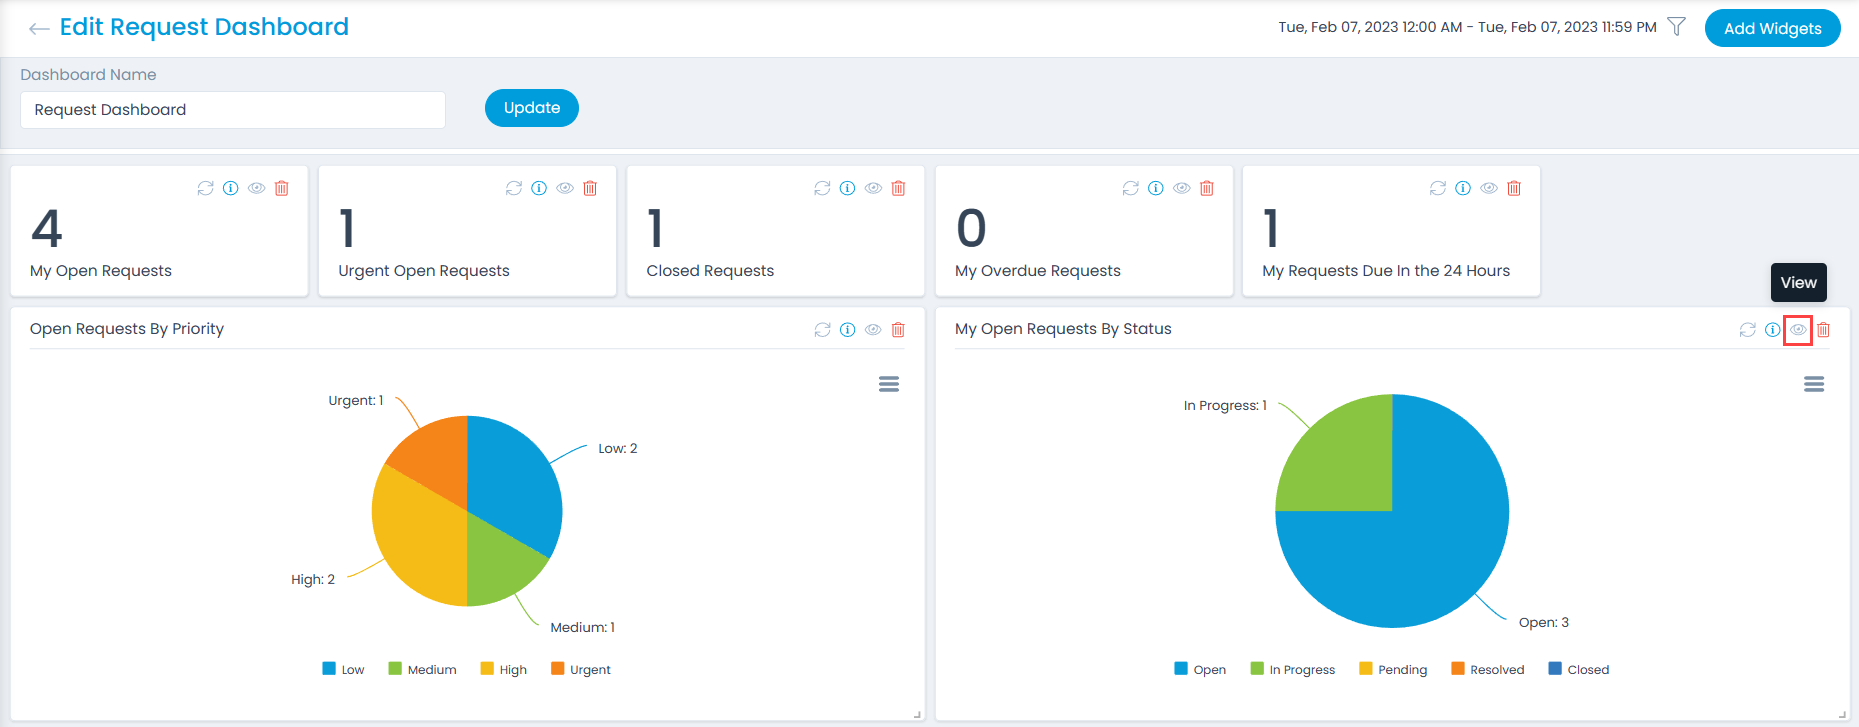
Once done, click Create. The Edit Dashboard screen appears as shown below.
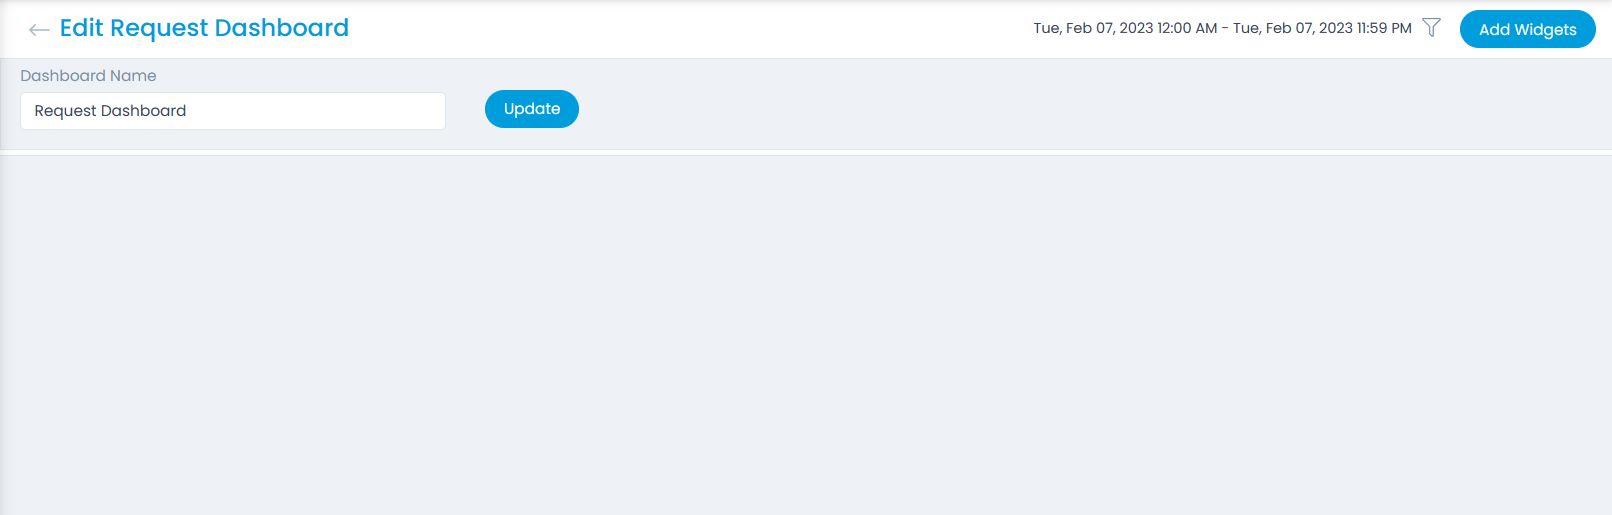
Here, you can update the dashboard name, select the duration within which you want to view the data, and Add Widgets to the Dashboard.
Adding Widgets
Click Add Widgets and a popup appears. It displays three tabs namely:
- Geolocation is supported for Windows Laptop, Windows Desktop, Windows Server, and Hyper V assets only.
- While creataing KPI/Widget in the Dashboard, Geolocation related conditions will appear only for those assets in which the Geolocation feature is supported. For example, if the Asset Type is selected as Windows Laptop, then Geolocation related conditions will be available.
- KPI: The abbreviation stands for Key Performance Indicator which is a counter of occurrences satisfying a preset condition. For example, there could be a KPI that shows the number of Request tickets having reopen count greater than 0.

- Widget: A widget shows data points graphically across X and Y coordinates or as proportions. For example, count of Problem tickets can be shown across priorities using a Bar Chart.
- Shortcut: It is a predefined box that shows specific system data. For example, there is a Shortcut box called My Open Requests that shows recent open requests assigned to you.

A user can perform the following operations with widgets:
- View widgets, along with their parameters.
- Create custom widgets (not possible with Shortcuts).
- Edit existing widgets (not possible with Shortcuts).
- Create duplicate of a widget (not possible with Shortcuts).
- Delete a custom widget (not possible with Shortcuts and predefined widgets).
Creating a KPI
- In the Add Widgets popup, select the KPIs tab. It displays the default KPIs and also the option to create a custom one. To create a custom KPI, click the Create KPI button.

- A dialog box opens. Enter the following details:

| Parameter | Description |
|---|---|
| Name | Name of the KPI. |
| Module | Name of the module of which the KPI belongs (either Request, Service Catalog, Problem, Change, Release, Asset (Hardware, Software, Non-IT, and Consumable), Patch, Task, Software License, Contract, Purchase, Deployment, and Project). |
| Technician Access Level | Select the Technicians to whom you want give access to the KPI. |
| Technician Group Access Level | Select the technician group to whom you want to give access to the KPI. |
| Date Filter | Select the date filter based on which the data should be displayed. It allows you to filter data using time. The options are: - Created Date: This option is valid for all modules. A Dashboard has a time filter using which the KPI displays only those data points whose create date falls within the selected time period. For example: If the time period is selected as Last 7 days, the KPI will display only those assets whose create date falls within the selected time period. - Resolved Date: This option is valid for all modules. Instead of the Create date, the system uses the resolved date for filtering the data. - Closed Date: The closed date of a ticket or item is considered to check whether it falls within a specified period. - Last Updated Date: The Last updated date of a ticket or item is considered to check whether it falls within a specified period. |
| Description | Description of the KPI. |
| Conditions | A KPI is a counter that shows the number of times a condition(s) is satisfied. A condition is created using parameters. For example: Priority Equals to Low for a Request module will show the count of Requests with Priority Low for a specific time period. |
| Highlights | Highlight the KPI with various colors based on the Threshold value (KPI Count). Once the threshold value exceeds the color of the KPI will change accordingly. Also, you can set the Label for each threshold. You can set multiple highlights for different threshold values. They will appear in descending order. |
Once done, click on Create, the KPI will appear in the list, select it, and click Add to Dashboard. The KPI will appear on the Dashboard.
Creating a Widget
- In the Add Widgets popup, select the Widgets tab.

- Click on Create Widget on the top-right corner.
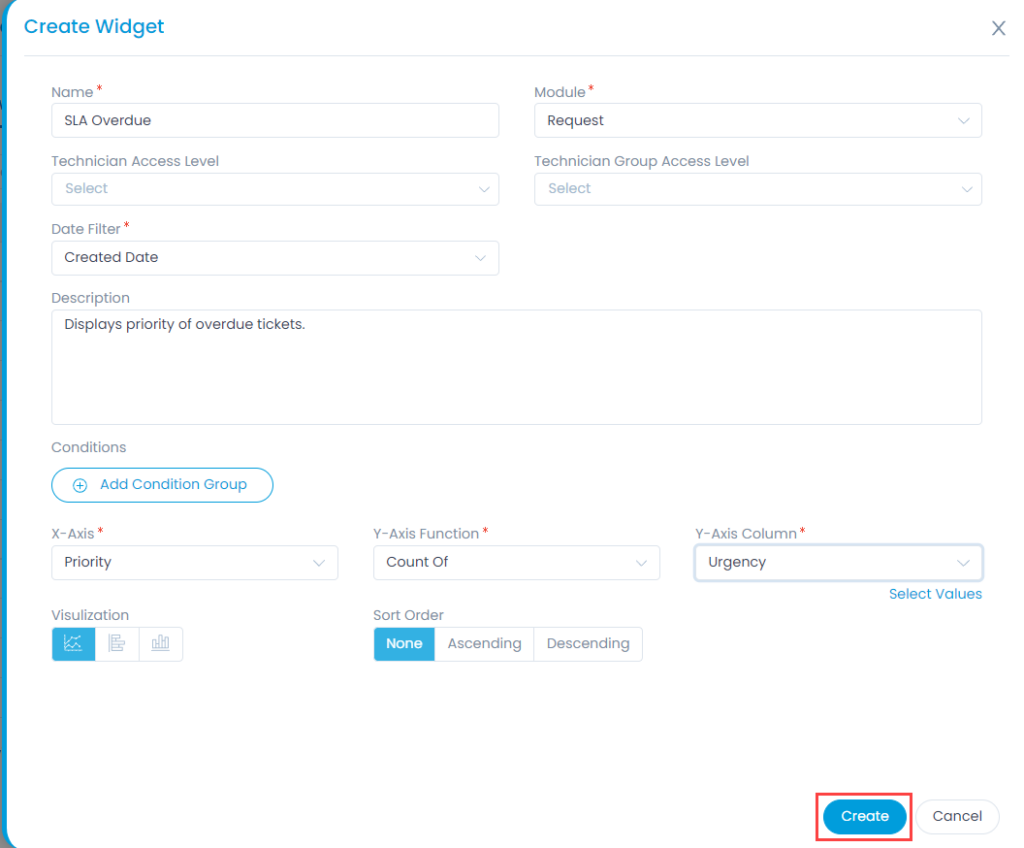
- A dialog box opens. Enter the following details:
| Parameter | Description |
|---|---|
| Name | Enter name of the widget. |
| Module | Select the module based on which the data should be displayed. |
| Technician Access Level | Select the technician name to whom you want to give the access of the widget. |
| Technician Group Access Level | Select the technician group to whom you want to give the access of the widget. |
| Date Filter | Select the date filter based on which the data should be displayed. It allows you to filter data using time. The options are: - Created Date: This option is valid for all modules. A Dashboard has a time filter using which the widget displays only those data points whose create date falls within the selected time period. For example, a Widget that shows the number of Assets added in a time period will consider the create date of each Asset. - Resolved Date: This option is valid for all modules. Instead of Create date, the system uses the resolved date for filtering the data. - Closed Date: The closed date of a ticket or item is considered to check whether it falls within a specified period. - Last Updated Date: The Last updated date of a ticket or item is considered to check whether it falls within a specified period. |
| Description | Enter the details of the widget. |
| Conditions | A widget graphically shows the count or average of data points categorically as a chart. Here, you can decide what data to use, using a condition(s) (filters). A condition is created using parameters. For example; SLA Violation Equals to True for Request module will show tickets that have violated the SLA resolution time for a specific time period. Filters can be made using multiple conditions all connected by logical operators: AND and OR. Conditions can be grouped together as well. |
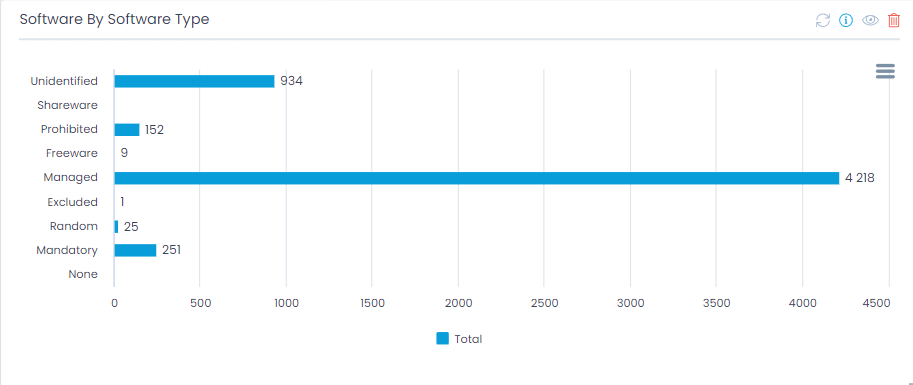
| Charting Options | Here, you can decide how to represent the filtered data. - The filter data will have parameters. You can choose any one to show on the X-axis. In the above diagram, the Priority parameter is selected to be represented on the X-axis. - The Y- axis holds functions. Here, the Count function to count Request tickets across priorities is used. The value Low for the parameter Priority is disabled. - Select the Visualization (Chart type). The options are: Bar Chart, Line Chart, and Column Chart. - Select the Sort Order from: Ascending: X-axis will be sorted (based on count) in ascending order. Descending: X-axis will be sorted (based on count) in descending order. |
Once done, click on Create, the Widget will appear in the list, select it, and click Add to Dashboard. The Widget will appear on the Dashboard.
You can now view the Dashboard on the screen by selecting it from the Dashboard list.
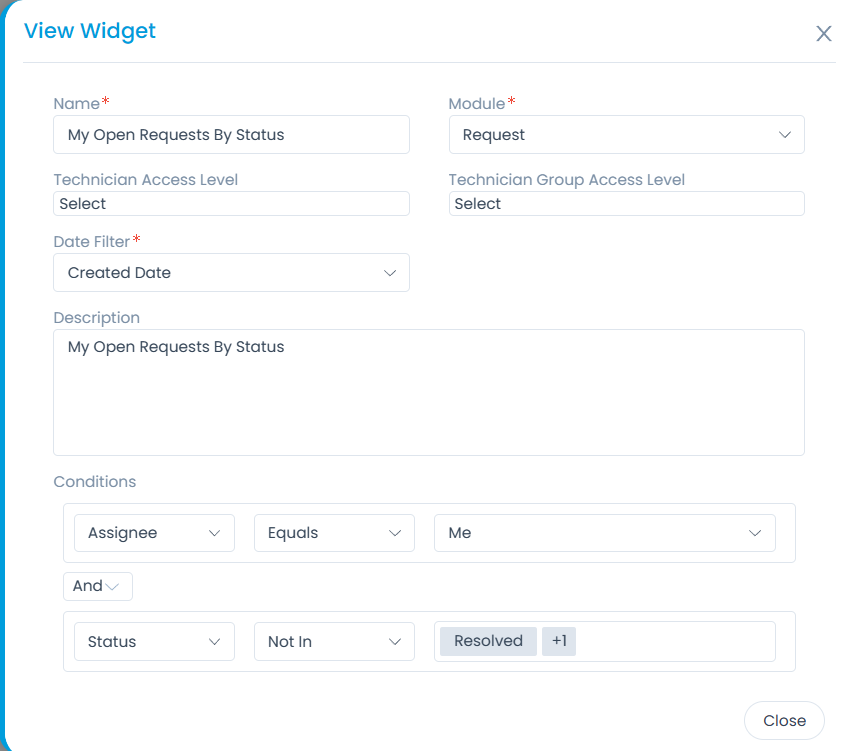
Viewing Widget
Only the Super Admin user can edit the predefined widgets (barring Shortcuts).
The user can view the definition of a KPI and Widget. But only an owner of a widget (KPI or Widget) can edit its definition.
Select the Dashboard from the list.
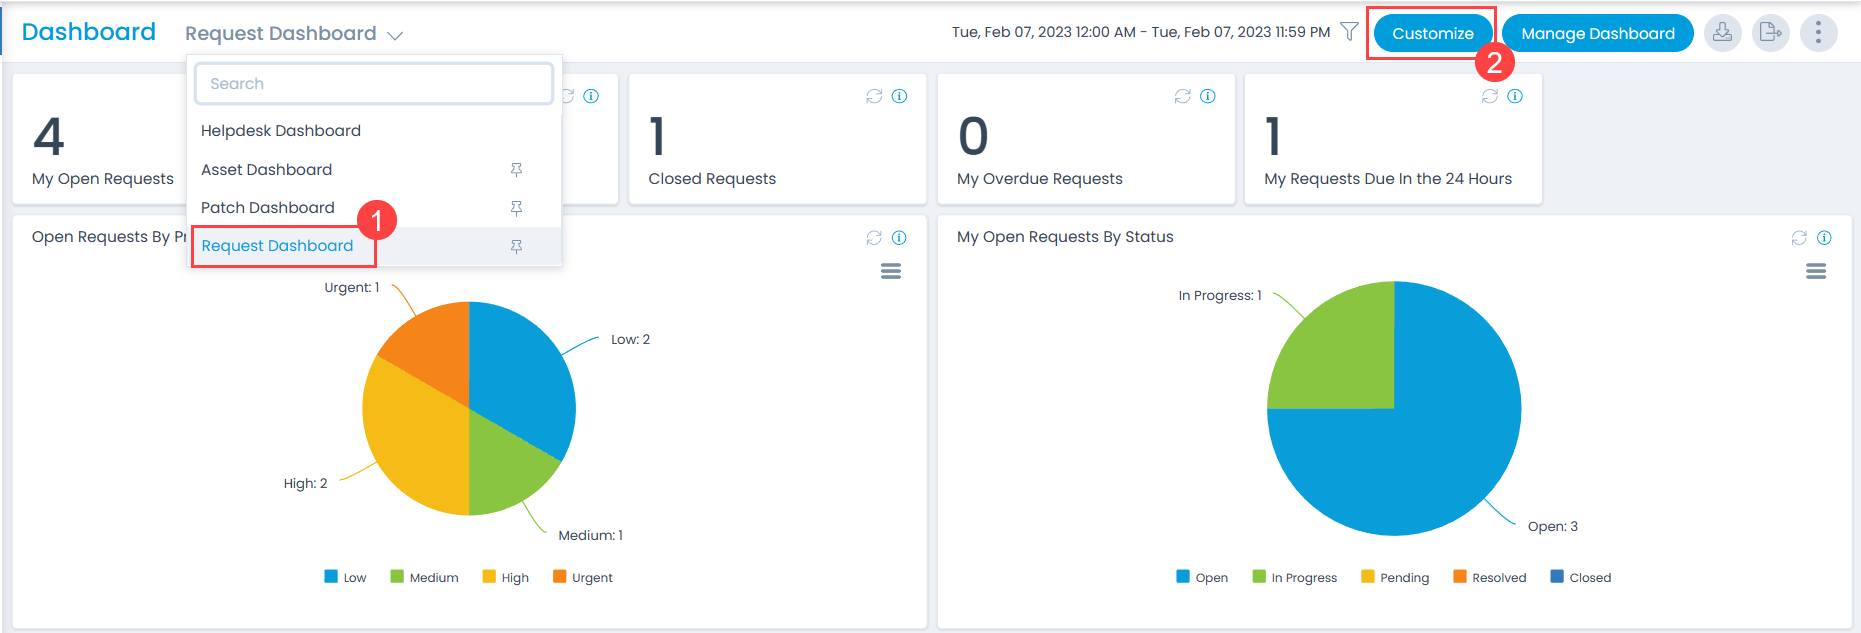
Click Customize and the below screen appears. Here, you can do the following:
- Edit the Dashboard name
- Change the duration
- Add more widgets
- Refresh the statistics data
- View the definition details of a KPI or widget
- Delete a KPI or widget
The Customize button is available only when the custom dashboard is selected.
- To view the definition of a KPI and Widget, click the View Icon (eye), and the popup appears.
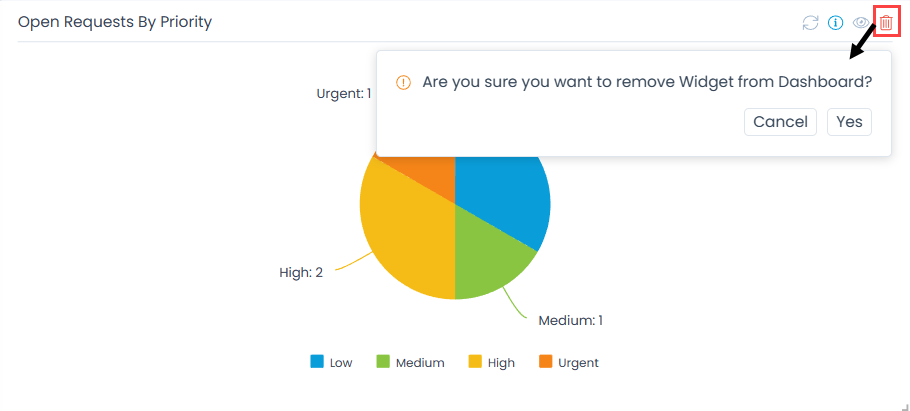
Deleting Widget
The predefined widgets cannot be deleted.
The owner of a custom widget (KPI or Widget) can delete it using the Delete Icon.
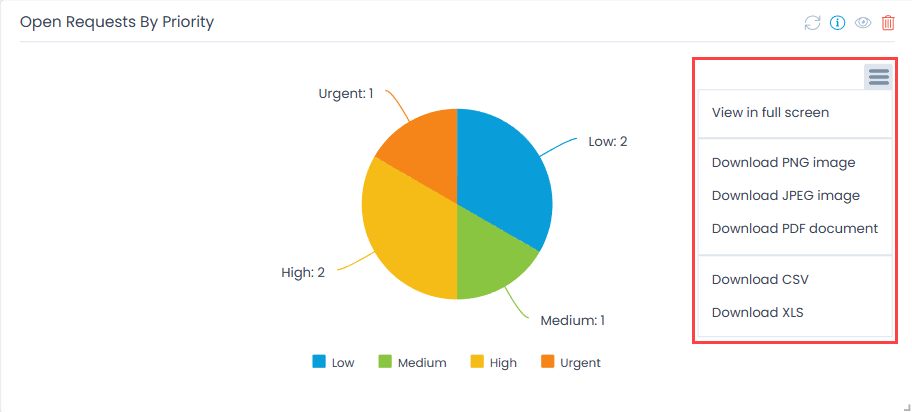
Other Options for Widget
You can view the particular widget in Full Screen as well as download the Widget in .png and .jpeg format. If you wish to view it in the form of a document you can export the widget to PDF, CSV, and XLS format as shown below: