Monitoring Your Infrastructure
ObserveOps gives you a real-time view of every IT infrastructure component in your environment. Monitors are how ObserveOps tracks and measures your infrastructure, from servers and networks to cloud resources, services, and containers. Grouping monitors by infrastructure type gives you a structured, organized view so you can find and act on the right data quickly.
Navigation
Go to the Main Menu. Select  . The screen to view the monitor details is displayed.
Monitor Screen
The Monitors screen organizes your infrastructure by category, gives you predefined templates for each device type, and lets you drill down into real-time metrics for any monitor.
Monitors Categorization Based on Infrastructure
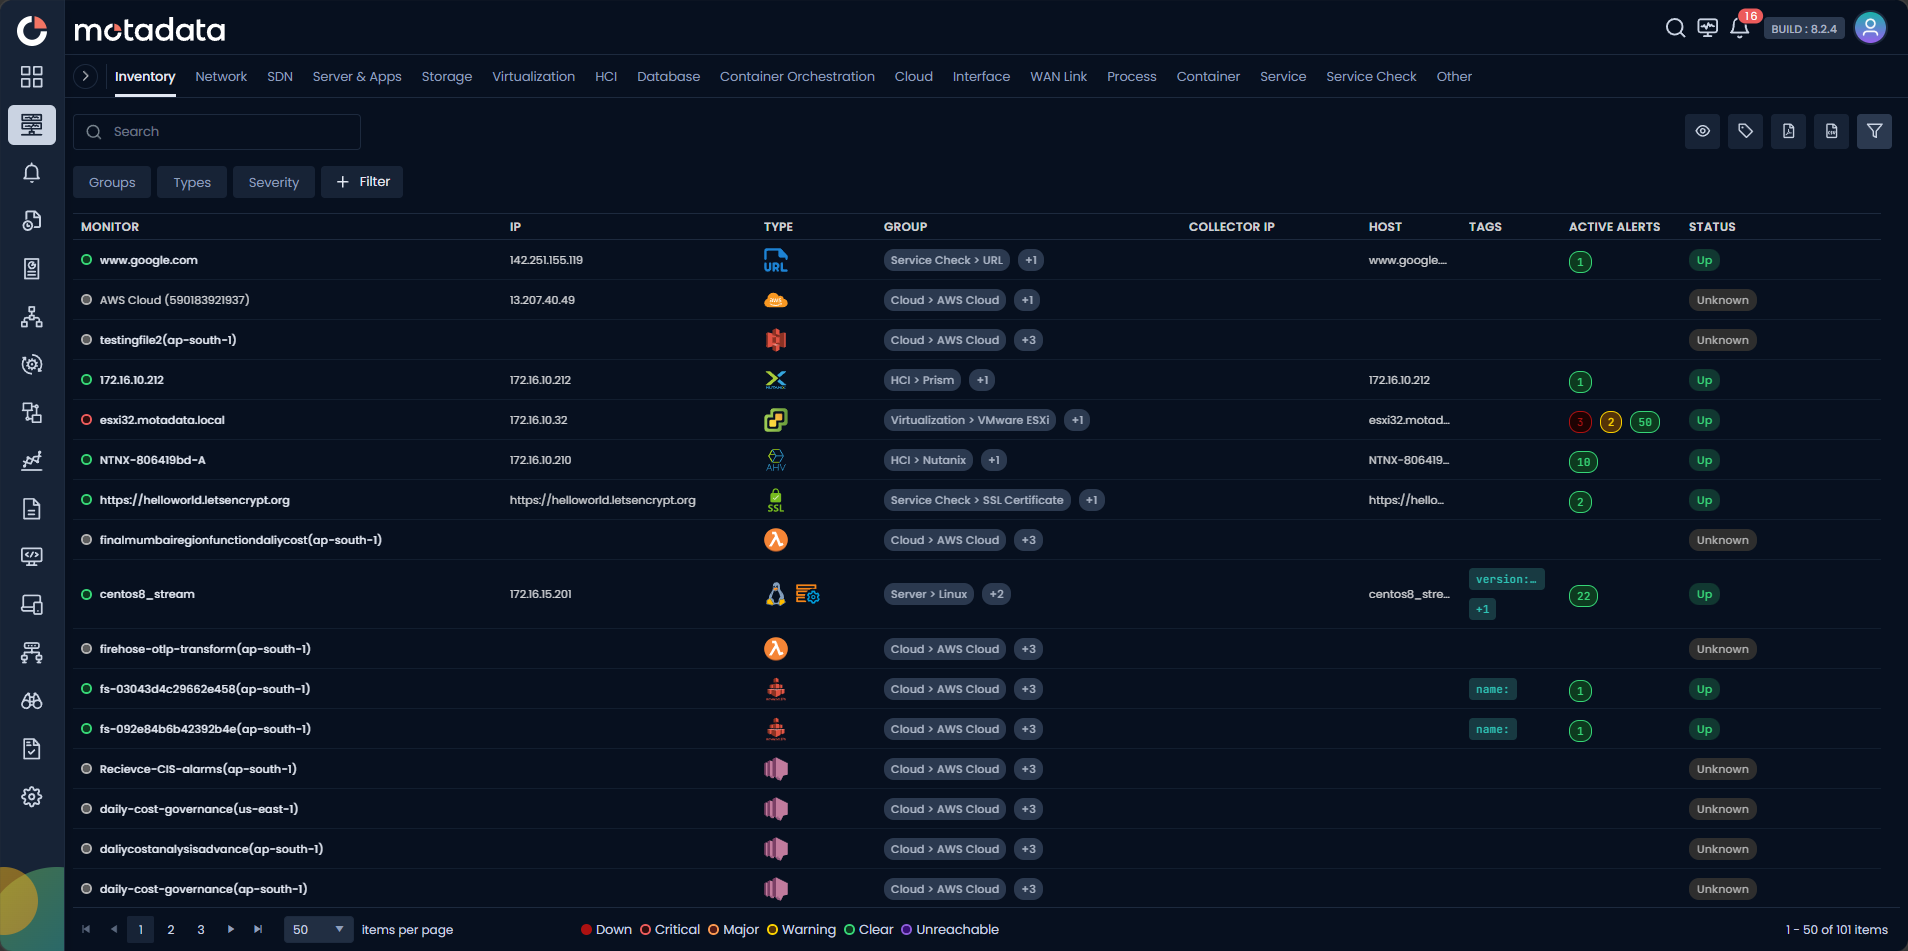
In ObserveOps, effective monitoring begins with a clear and organized view of your IT infrastructure. The Monitors Categorization Based on Infrastructure allows you to categorize and manage monitors according to different types of infrastructure. This categorization simplifies the process of monitoring and provides quick access to the monitor you need.
| Infrastructure Category | Description |
|---|---|
| Inventory | The default view showing all monitors across all infrastructure types. This is the landing tab when you open the Monitors screen. |
| Server & Apps | Monitors for your servers and applications. |
| Network | Monitors for network devices. |
| SDN | Monitors for Software-Defined Networking infrastructure. |
| Cloud | Monitors for cloud infrastructure. |
| Service Check | Monitors for service availability checks. |
| Virtualization | Monitors for virtualized environments. |
| HCI | Monitors for Hyper-Converged Infrastructure setups. |
| Storage | Monitors for storage devices and systems. |
| Database | Monitors for database instances and performance. |
| Container Orchestration | Monitors for container orchestration platforms. |
| Service | Monitors for individual services. |
| Process | Monitors for processes running on your devices. |
| Container | Monitors for individual containers running on systems. |
| Interface | Monitors for network interfaces. |
| WAN Link | Monitors for wide area network link performance. |
| Other | Monitors that do not fit into the above categories. |
Actions available on the Monitors Screen
For each infrastructure category, you'll find a list of monitors available for monitoring. On each of these screens, you can perform the following actions:
| Action | Description |
|---|---|
| Export as CSV | Export the monitor list as a CSV file for use in spreadsheets or external tools. |
| Export as PDF | Export the monitor list as a PDF file for sharing or reporting. |
| Filter | Easily filter the list of monitors based on details such as alert severity and monitor type. |
| Set Tag as a Column | Select this option to add key:value based tags as a column to the monitor list. The tag key becomes the column name and the tag value appears against each monitor in that column. |
Reset Column Preference
To reset column preferences and unhide all hidden columns on the Monitor screen, select the eye icon and choose the Reset Column Preference option.
Predefined Templates to View Monitor Details
ObserveOps offers a range of predefined templates tailored to each infrastructure category and device type. These templates provide you with an instant overview of essential monitoring details. The goal is to simplify monitoring, ensuring that you have the right information at your fingertips.
When you drill down on a specific monitor, you can view more details related to that monitor.
The following tabs are available on the drill-down screen:
Overview: See key performance metrics for the monitor based on the predefined template for that infrastructure type, such as CPU, Memory, Disk, IOPS, Network, and Response Time.
Active Process: Shows all processes currently running on the monitor. Use this tab to check which processes are active and consuming resources at any point in time. This tab appears for agent-monitored devices.
Services: Shows the services running on the monitor and their current state. Use this tab to confirm whether a service is running, stopped, or in an unknown state.
Installed Software: Lists all software packages installed on the monitor. Use this tab when auditing what is installed on a device or verifying software versions.
Active Alerts: Shows all alerts currently firing for the monitor. The columns are POLICY NAME, TYPE, METRIC, INSTANCE, VALUE, INCIDENT DETAILS, LAST SEEN, DURATION, and NOTE. Use this tab to see at a glance what is wrong with the monitor without leaving the monitor detail screen. You can filter by Severity, Policy, or Metric.
Metric Explorer: Analyze the monitor's metrics in detail using the Metric Explorer tab.
Configured Policy: See which policies are configured for the selected monitor.


Actions available for individual monitors
When you drill down on a specific monitor, the following actions are available in the toolbar:
Poll Now: Instantly poll metrics related to the monitor.
Terminal: Select this option to open an SSH terminal for the monitor. This feature allows you to establish a secure SSH connection to the device directly from the monitor screen, enabling real-time command-line interactions.
Execute Runbook: Select this option to execute a Runbook assigned to the selected monitor. The list of all runbooks assigned to the monitor appears. Select the one you want to run.
Export: Export the predefined template as an image in PNG format.
View More: Access additional details about the monitor such as the Summary, Polling Info, Triggered Policies, and Action History, tailored to its infrastructure type.
Dashboard Overview for Each Infrastructure Category
Select the  icon to view the dashboard overview screen related to that infrastructure.
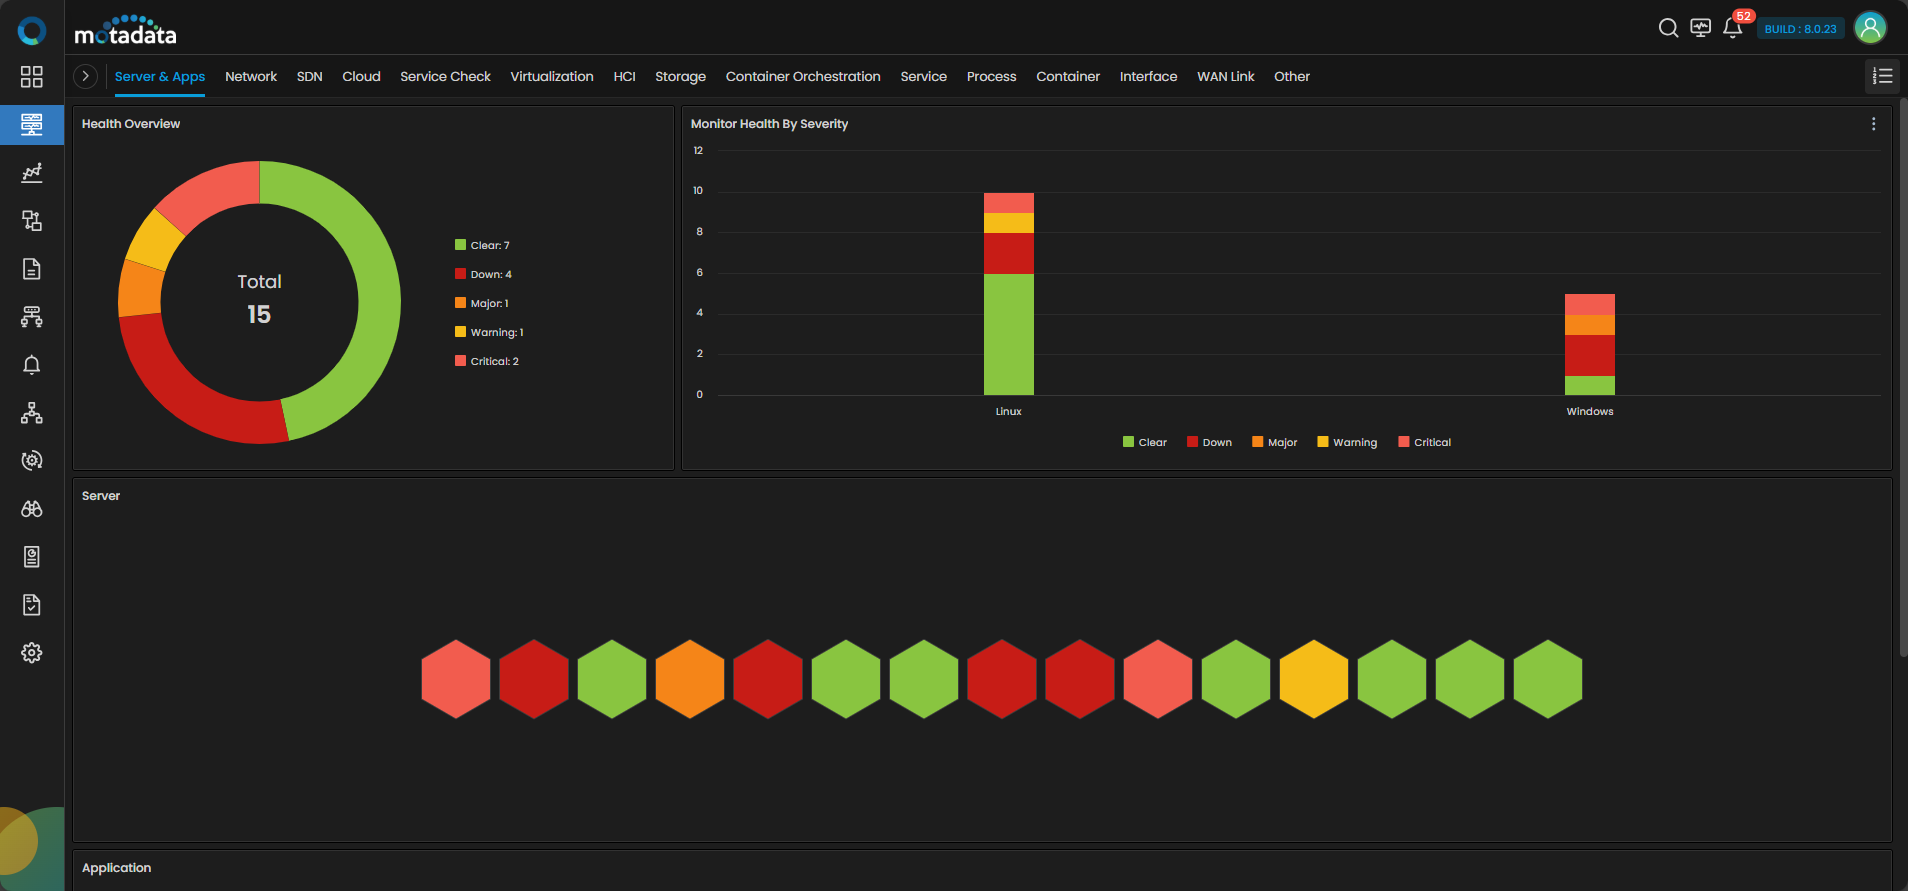
The Dashboard overview provides a comprehensive view of each infrastructure category. You can monitor and manage your infrastructure effectively with the following insights available on the dashboard screen:
Total Monitor Count: See the total number of monitors present in each infrastructure category on the 'Health Overview' widget.
Alert Severity: Check the number of monitors in each alert severity category for each monitor group.
Highest Severity Alerts: Drill down on the heat map to view details about the highest severity alerts raised for each monitor.
With monitors categorized by infrastructure type, ObserveOps makes it straightforward to find the right monitor, spot issues, and take action.