Global Inventory Settings
Global Inventory is the single screen that lists every asset ObserveOps knows about and shows exactly which telemetry signals each asset is producing.
You can use Global Inventory to answer four questions from one place:
- Which assets exist in my tenant?
- Which telemetry signals is each asset currently sending, and which are missing?
- How much of my licensed capacity for each signal is used, and how much remains?
- Which sources are already sending data but are not being monitored?
Navigation
Go to Menu. Select Settings. Select Monitor Settings. Select Global Inventory.
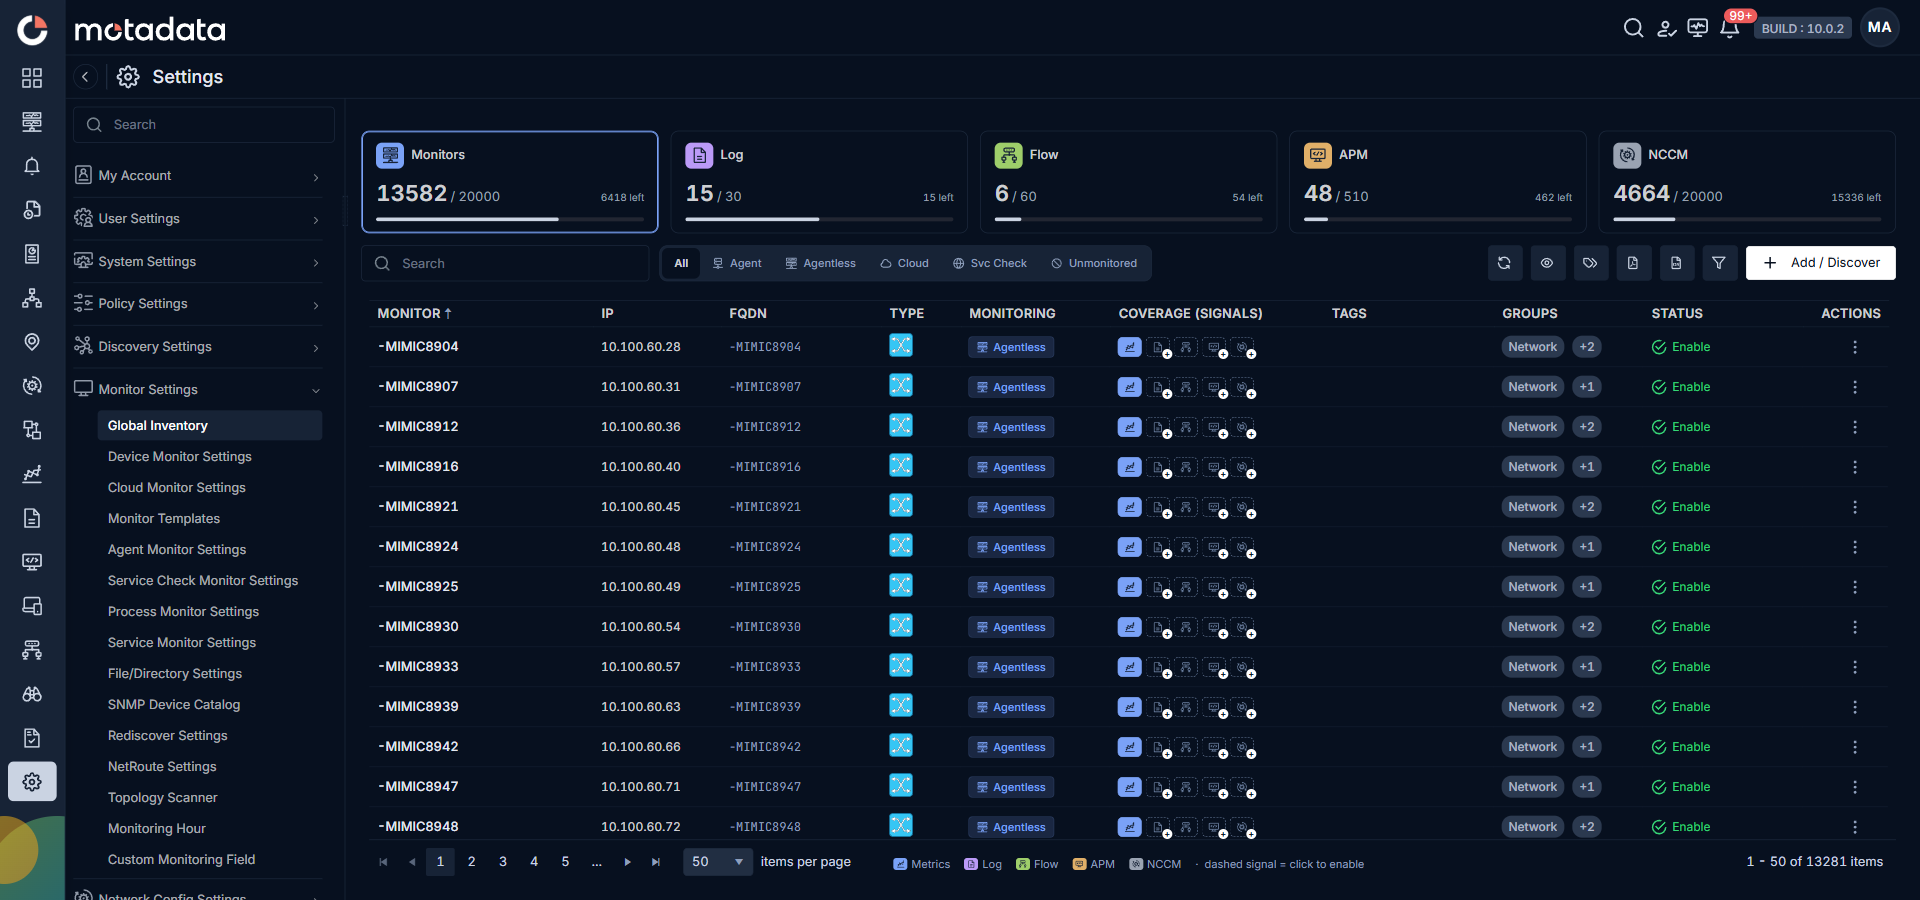
The screen opens with various license usage boxes across the top, a row of monitoring-method facet tabs, the actions toolbar, and the inventory grid.
License Usage Boxes
The boxes across the top of the screen show live license accounting for each supported signal type. Every box shows the used count, the licensed capacity, and the remaining capacity.
| Box | What It Counts | Example |
|---|---|---|
| Monitors | Assets consuming a monitor licence across any monitoring method. | 13582 / 20000, 6418 left |
| Log | Assets consuming a log-collection licence. | 15 / 30, 15 left |
| Flow | Assets consuming a flow licence. | 6 / 60, 54 left |
| APM | Applications consuming an APM licence. | 48 / 510, 462 left |
| NCCM | Devices consuming an NCCM licence. | 4664 / 20000, 15336 left |
Each box has a fill meter that reflects the ratio of used capacity to licensed capacity. When a signal reaches its licensed capacity, the box switches to an at-limit state and the remaining count reads zero.
Clicking a usage box filters the inventory grid to only the assets that consume that signal type. Clicking the same box again clears the filter.
When a signal is at its licensed capacity, existing coverage for that signal keeps working. Enabling that signal on a new asset from any drill-down or onboarding flow is blocked until the licensed capacity is raised.
Monitoring-Method Facets
The facet tabs sit below the usage boxes and filter the grid by monitoring method. Each facet updates the grid, the visible columns, and the row-level actions available.
| Facet | What It Shows | Column Set |
|---|---|---|
| All | Every asset in the tenant across all monitoring methods. | Monitor, IP, FQDN, Type, Monitoring, Coverage (Signals), Tags, Groups, Status, Actions |
| Agent | Assets monitored through the ObserveOps agent. | Agent-specialized columns replace the default set. |
| Agentless | Assets monitored through agentless protocols such as SNMP, WMI, or SSH (the former Device Monitor Settings). | Agentless-specialized columns. |
| Cloud | Assets discovered through cloud integrations such as AWS, Azure, or Office 365 (the former Cloud Monitor Settings). | Cloud-specialized columns including account and region. |
| Svc Check | Service checks such as Ping, Port, URL, or SSL Certificate (the former Service Check Monitor Settings). | Service-check-specialized columns. |
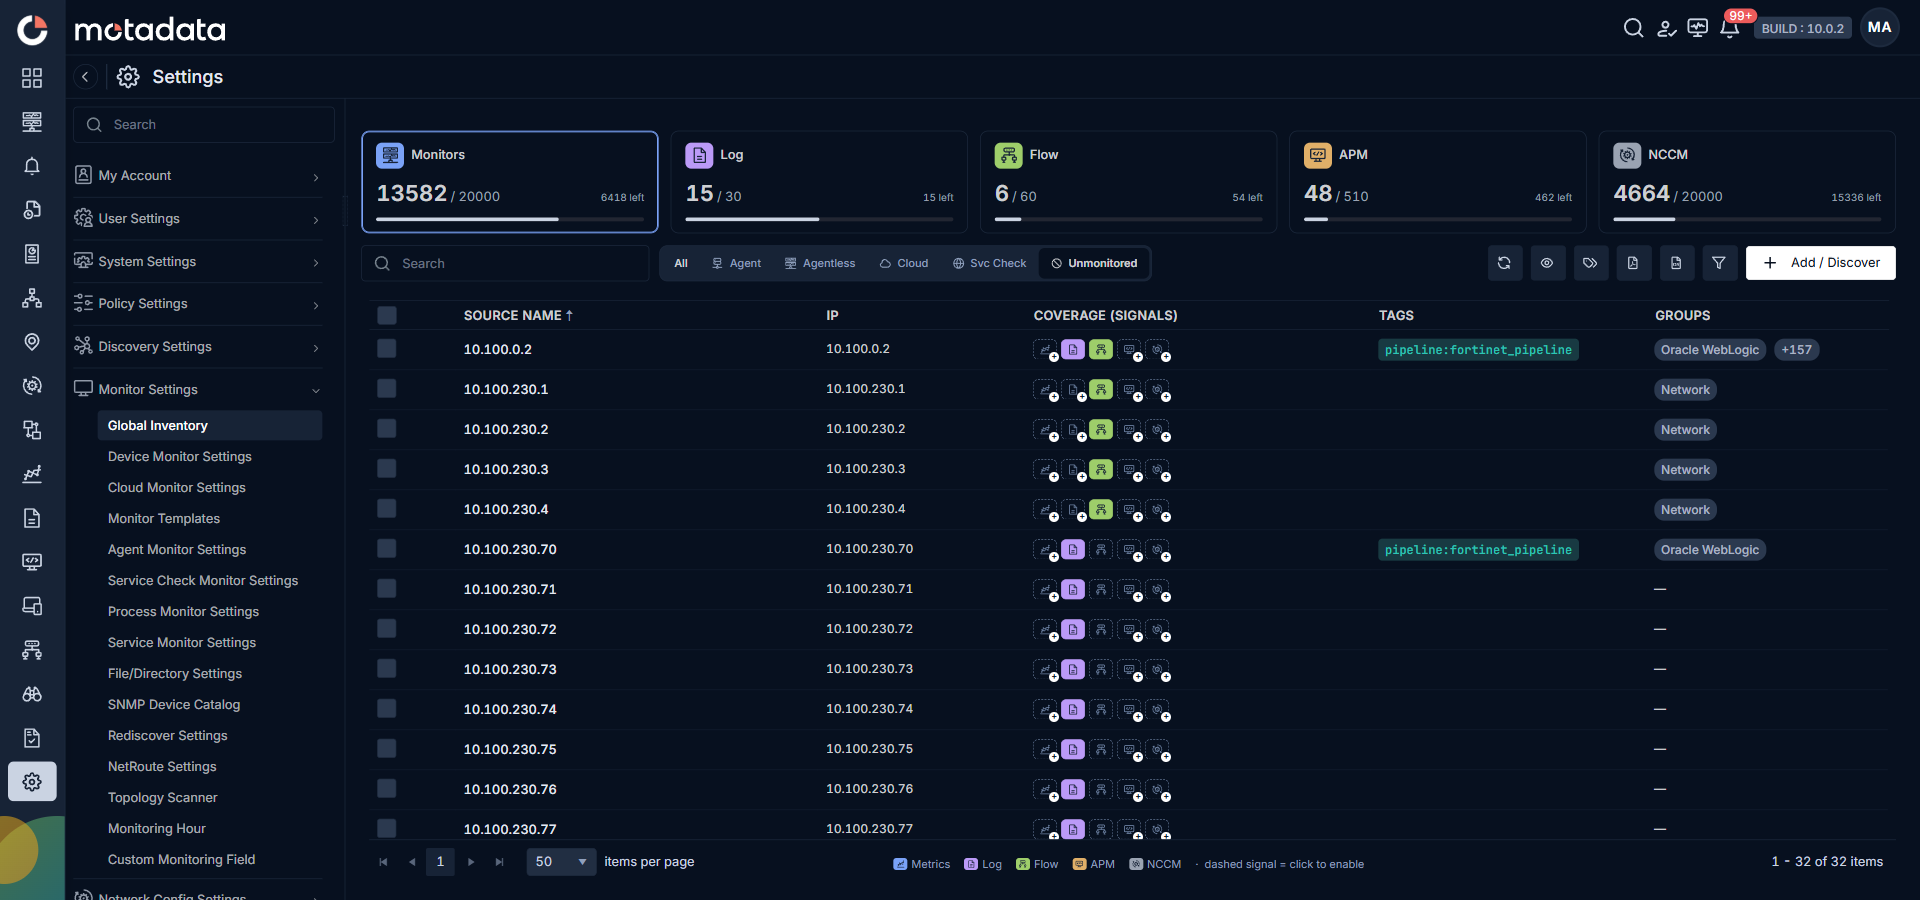
| Unmonitored | Sources that are not provisioned as monitors, but are already sending Log, Flow, or Trap signals. | Source Name, IP, Coverage (Signals), Tags, Groups |
You can enable or disable columns from the column selector for the current facet. Column choices persist per facet.
The Unmonitored facet uses a leaner column set focused on the incoming source rather than a provisioned monitor.
Actions Toolbar
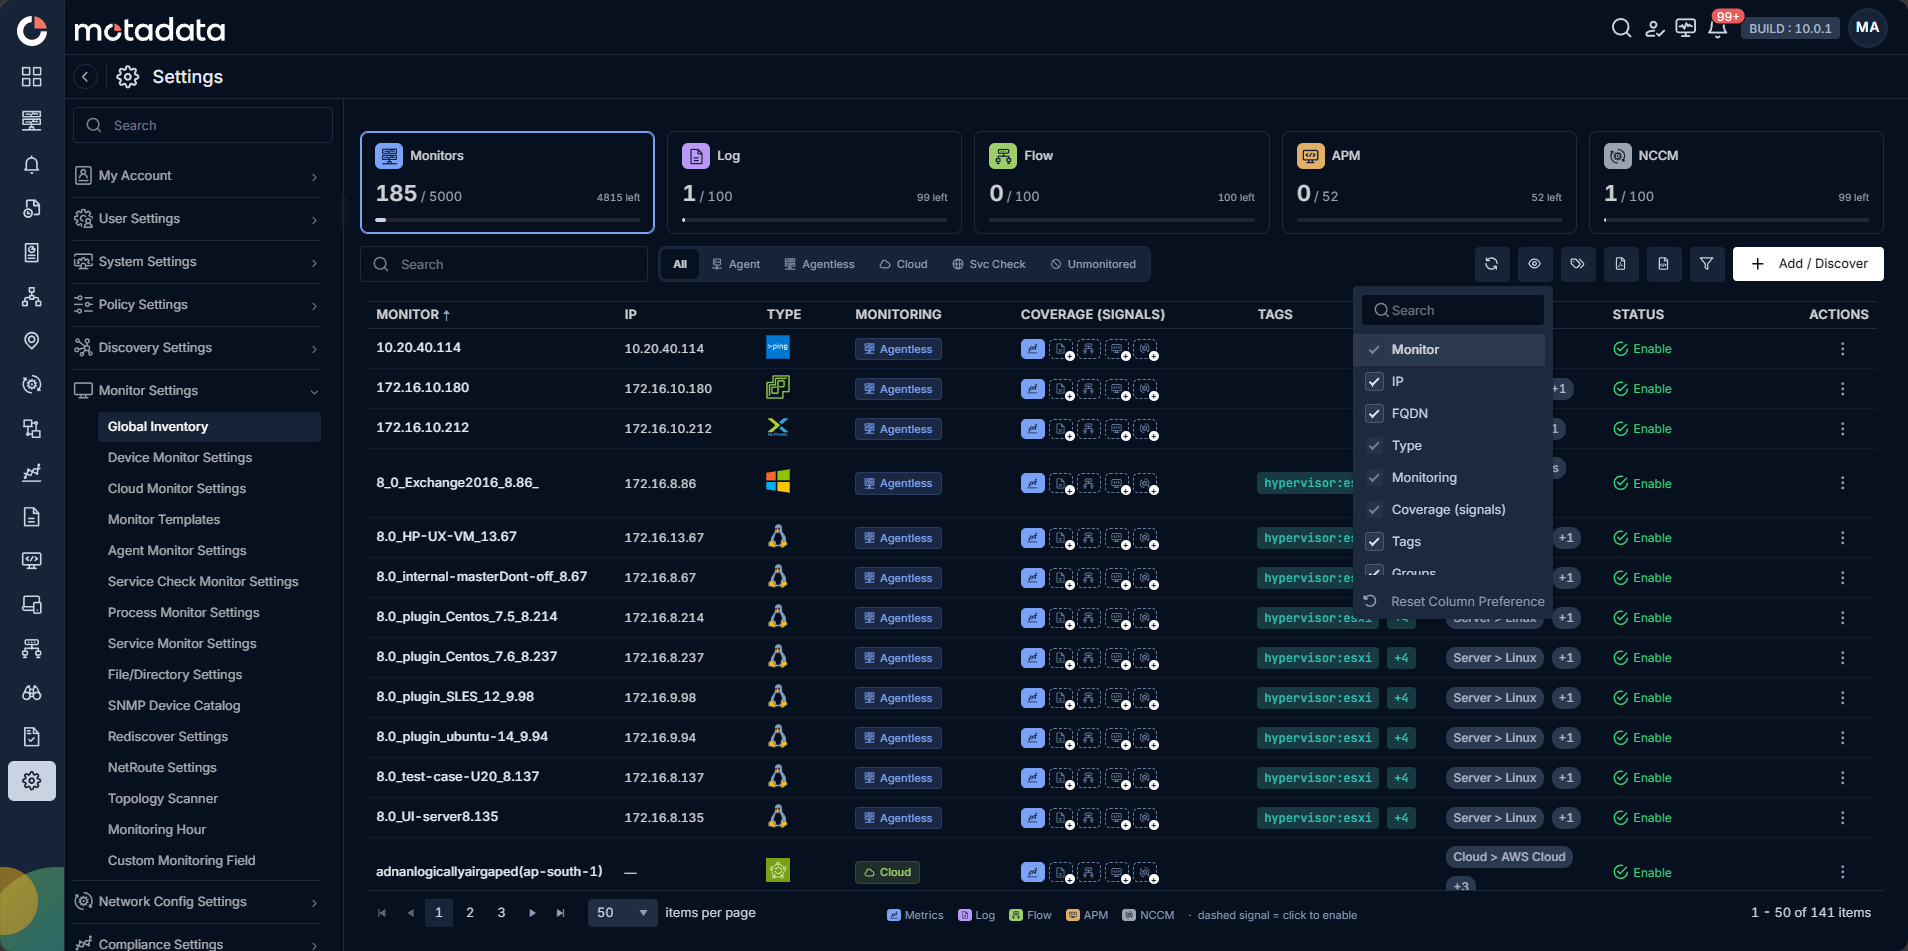
The toolbar sits above the grid on the right.
| Action | What It Does |
|---|---|
| Search | Filter the grid by monitor name, IP, or FQDN. |
| Refresh | Reload the grid with the latest state. |
| Column selector (icon) | Show or hide columns for the current facet. |
| Tags | Apply or remove tags on the selected rows. |
| Export as PDF | Export the current grid to a PDF file. |
| Export as CSV | Export the current grid to a CSV file. |
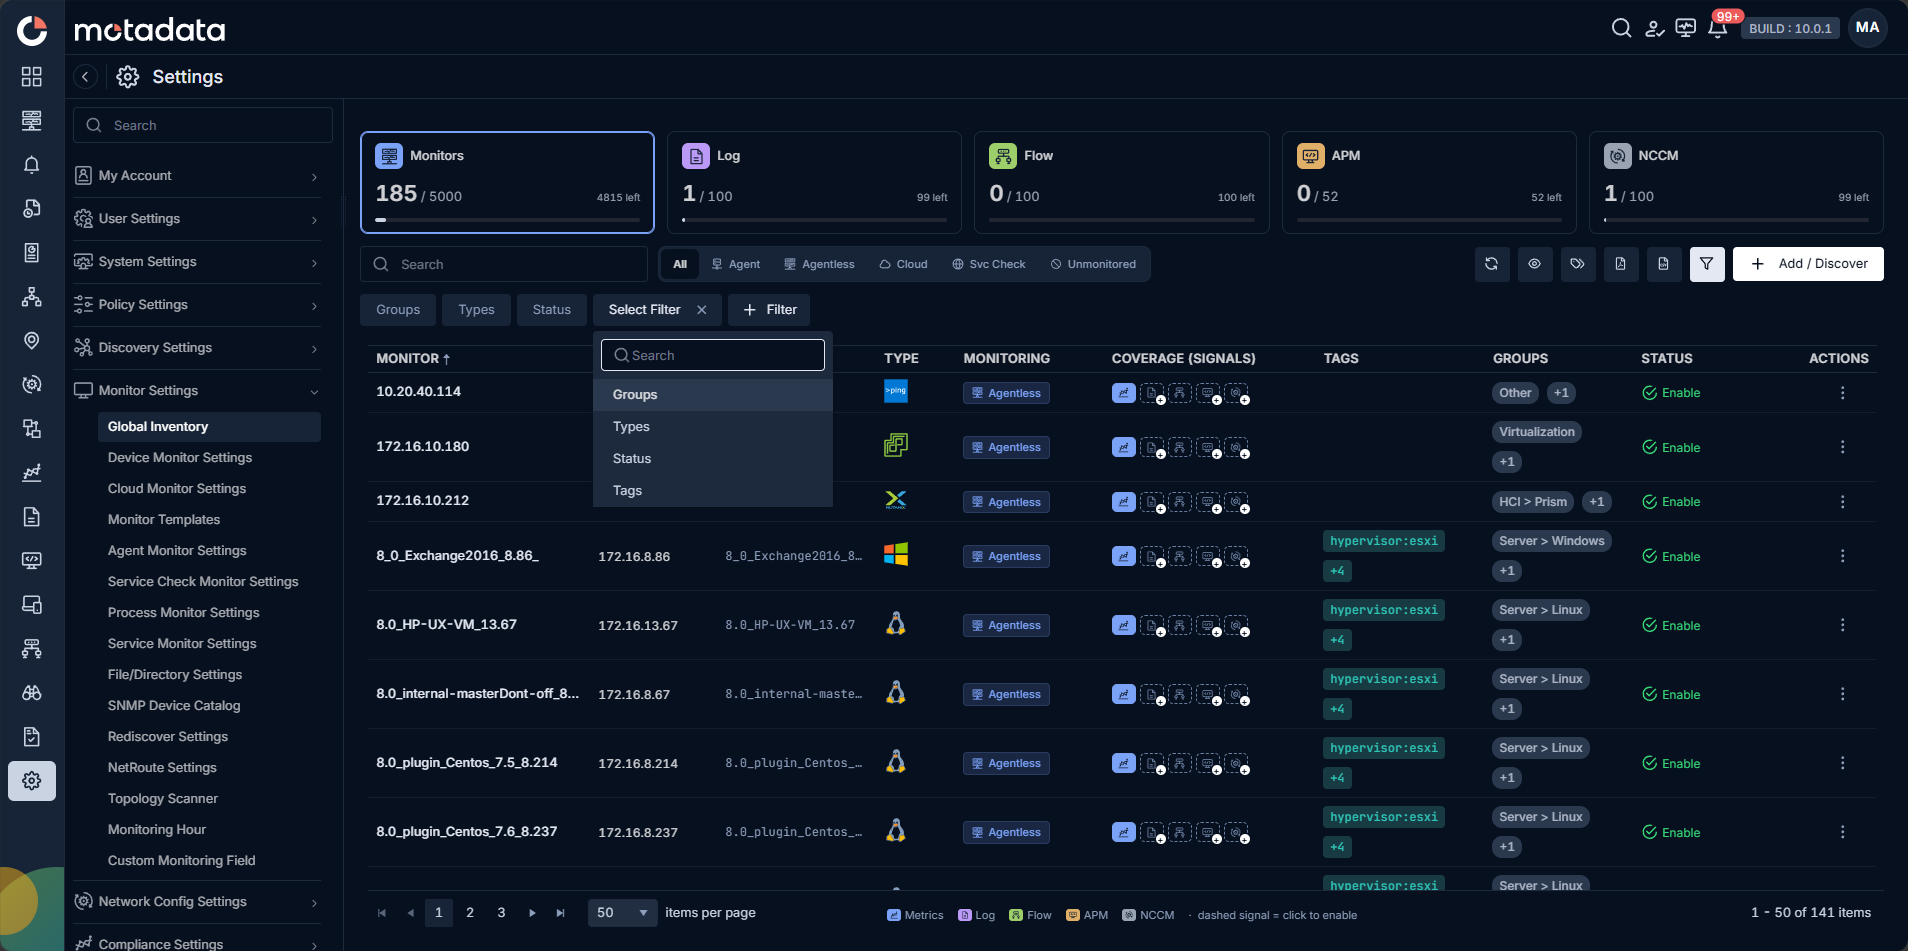
| Filter inventory | Open the filter panel for group, type, status, and enabled-signals filters. |
| Add / Discover | Open the Create Discovery Profile screen in a new tab so you can onboard a new asset. |
The column selector opens as a dropdown with a per-column checkbox and a Reset Column Preference link at the bottom.
Filters
The Filter inventory panel adds a new Enabled Signals filter on top of the existing group, type, and status filters carried over from the per-module inventories.
- Groups: filter by one or more monitor groups.
- Types: filter by device or asset type.
- Status: filter by health status (Up, Down, Critical, Major, Warning, Clear, Unreachable).
- Enabled Signals: filter by which signals are currently enabled on the asset (Metrics, Log, Flow, APM, NCCM).
When no asset matches the applied filters, the grid shows a no-match state with a link to clear the filters.
Signal Coverage Column
The Coverage (Signals) column is the core of Global Inventory. For every row it shows a set of small indicators, one per supported signal type (Metrics, Log, Flow, APM, NCCM). Each indicator shows whether that signal is currently arriving for the asset:
- Coloured / filled indicator: the signal is arriving. The asset is contributing to the used count in the matching usage box.
- Dimmed / empty indicator: the signal is not arriving. The asset is a coverage gap for that signal.
Clicking any indicator opens asset ingestion configuration page pre-filtered by the asset's IP. Toggle Enable on the matching row, or select Add Source to define a new ingestion rule.
Clicking any monitor name from the grid opens the asset's drill-down panel.
Asset Drill-Down
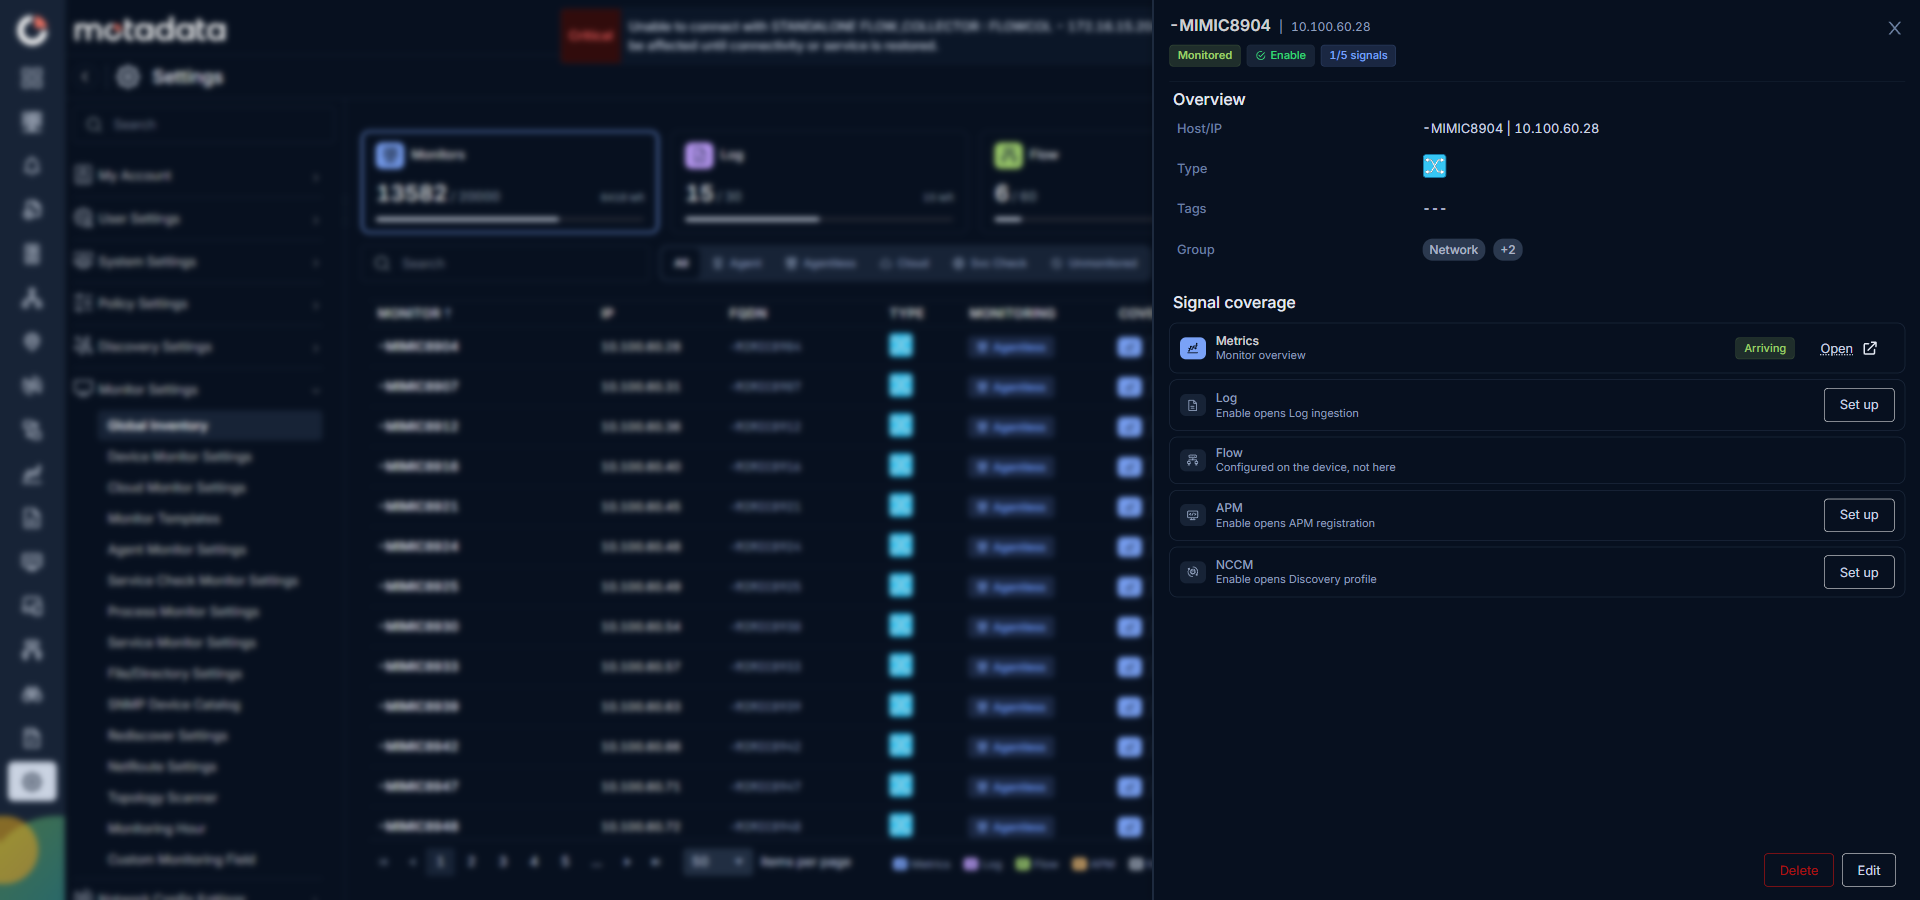
Selecting an asset name from the grid opens the drill-down panel on the right side of the screen. The panel has three sections: the header, an Overview block, and a Signal coverage block.
Header
The header shows the monitor name, the IP address, the monitored status, and a 1/5 signals style summary of how many of the five supported signals are currently arriving. A Close icon on the right dismisses the panel.
Overview
The Overview block lists the asset's static properties.
| Field | What It Shows |
|---|---|
| Host/IP | The asset's hostname or IP address. |
| Type | The asset type (for example Switch, Router, Server, Windows, Linux). |
| Tags | The tags assigned to the asset, or --- if none are set. |
| Group | The full group hierarchy the asset belongs to. |
Signal Coverage
The Signal coverage block lists all five supported signals for the asset. Each signal row has a label, a short hint about what happens when you act on it, a status pill when data is arriving, and an action button.
| Signal | When Data Is Arriving | When Data Is Missing |
|---|---|---|
| Metrics | Status pill Arriving. Button Open navigates to the monitor's live overview screen. | Button Set up opens the Create Discovery Profile screen so the asset can be discovered and provisioned. |
| Log | Status pill Arriving. Button Open navigates to the Log Ingestion page pre-filtered by the asset's IP. | Button Set up opens the Log Ingestion page so a log ingestion rule can be created for the asset. |
| Flow | Status pill Arriving. Button Open navigates to the flow view for the asset. | No inline enable is possible. The hint Configured on the device, not here indicates that flow export must be enabled on the source device itself (for example NetFlow or sFlow on a switch). |
| APM | Status pill Arriving. Button Open navigates to the APM view for the application. | Button Set up opens the APM Application Registration page pre-filtered by the asset's IP so a new application can be registered on that host. |
| NCCM | Status pill Arriving. Button Open navigates to the NCCM device inventory entry. | Button Set up opens the Create Discovery Profile screen so the device can be added to NCCM. |
Every Set up button opens the target screen in a new browser tab, pre-filtered by the asset's IP where the target screen supports it, so the Global Inventory context is preserved.
Log Set up Destination
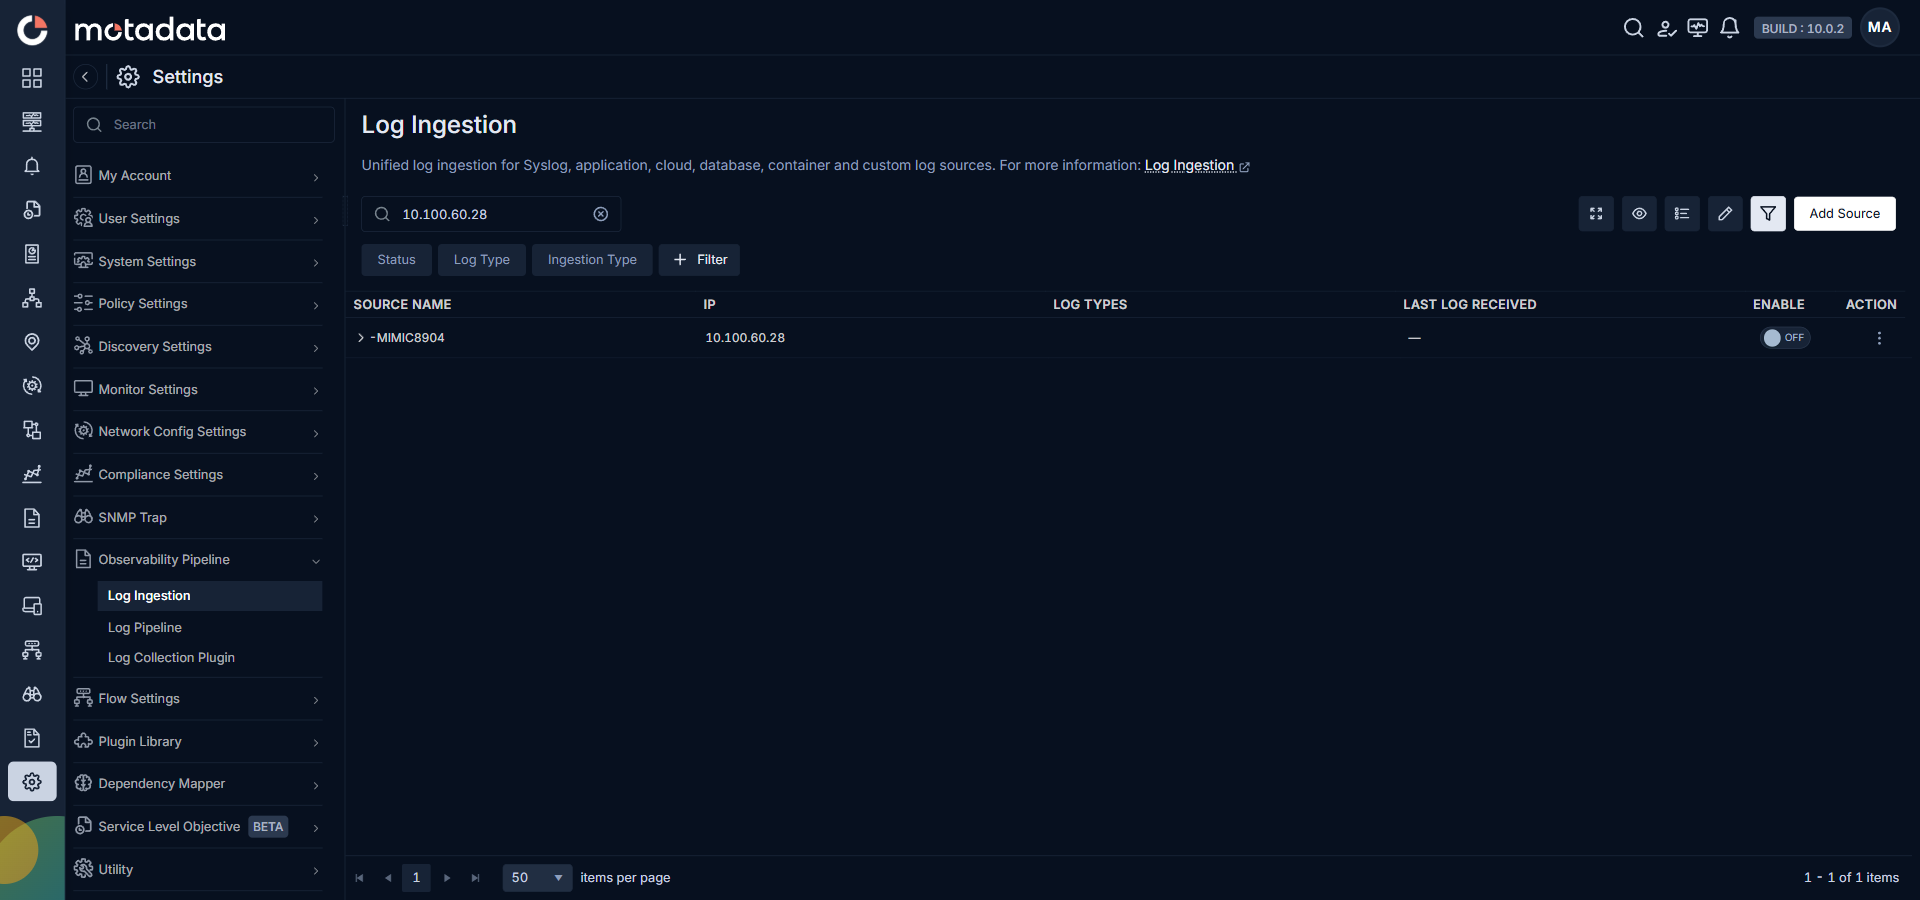
The Log Set up button opens the Log Ingestion screen at Settings → Observability Pipeline → Log Ingestion, pre-filtered by the asset's IP. Toggle Enable on the matching row, or select Add Source to define a new ingestion rule.
APM Set up Destination
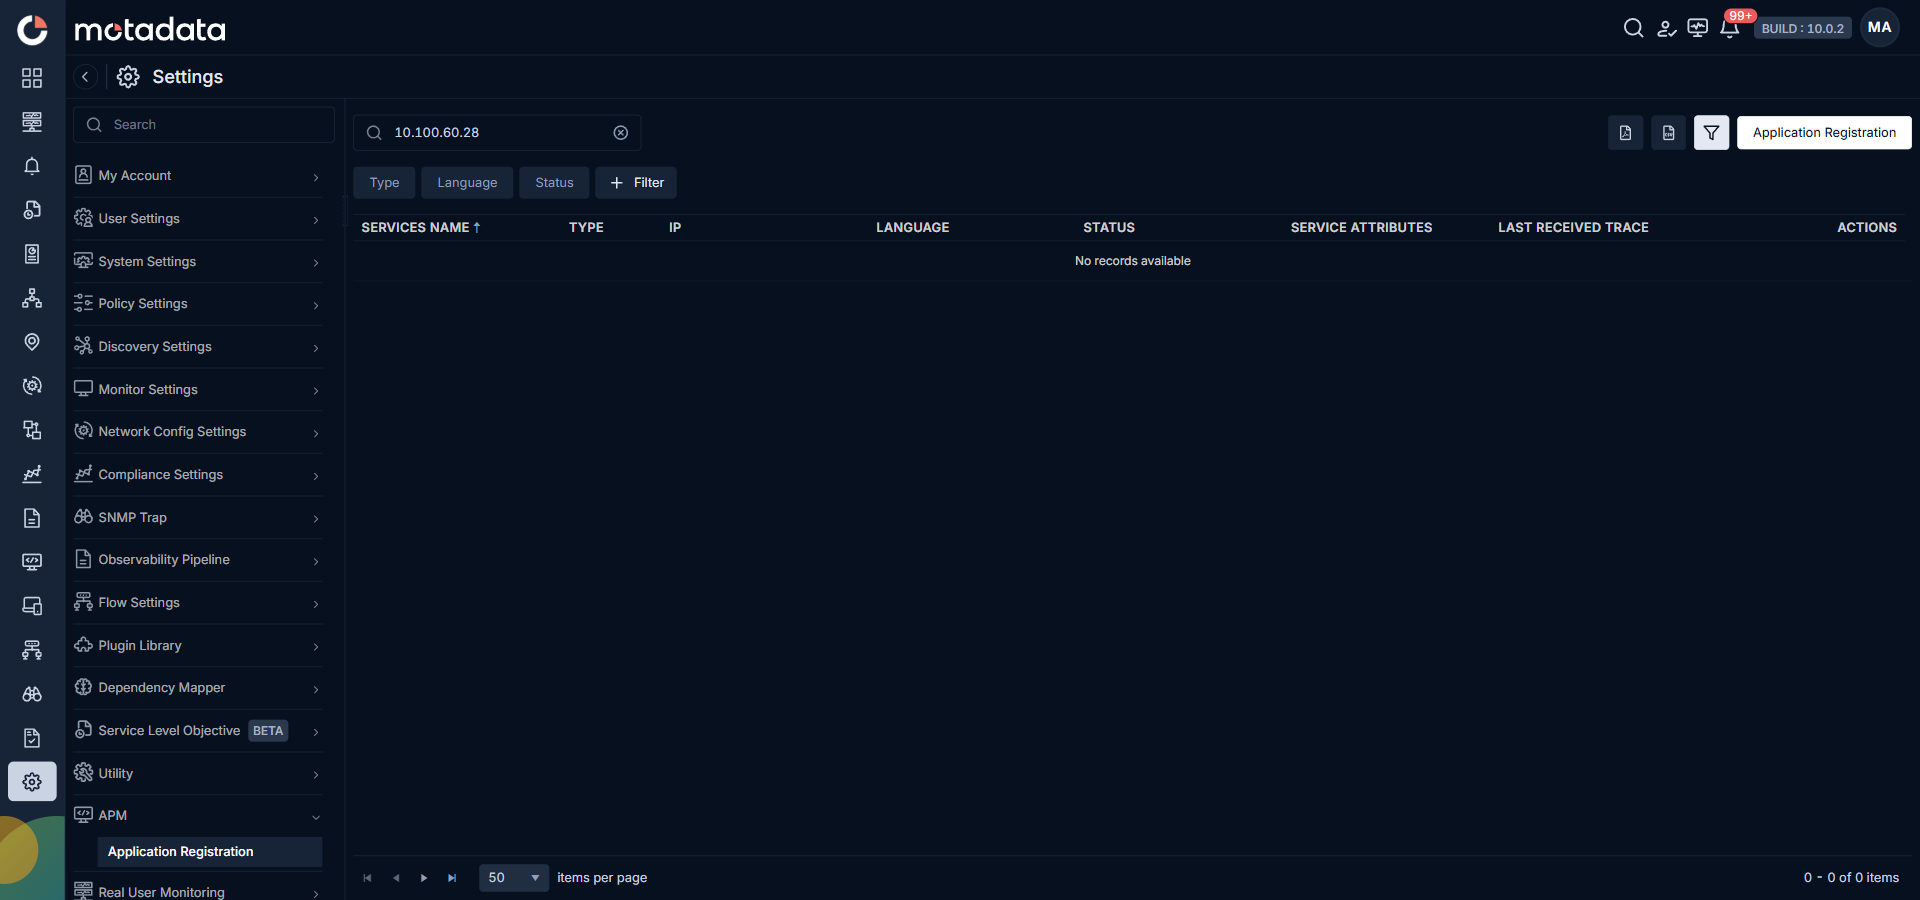
The APM Set up button opens the Application Registration screen at Settings → APM → Application Registration, pre-filtered by the asset's IP. Select Application Registration to register a new application on that host.
NCCM Set up Destination and Add / Discover
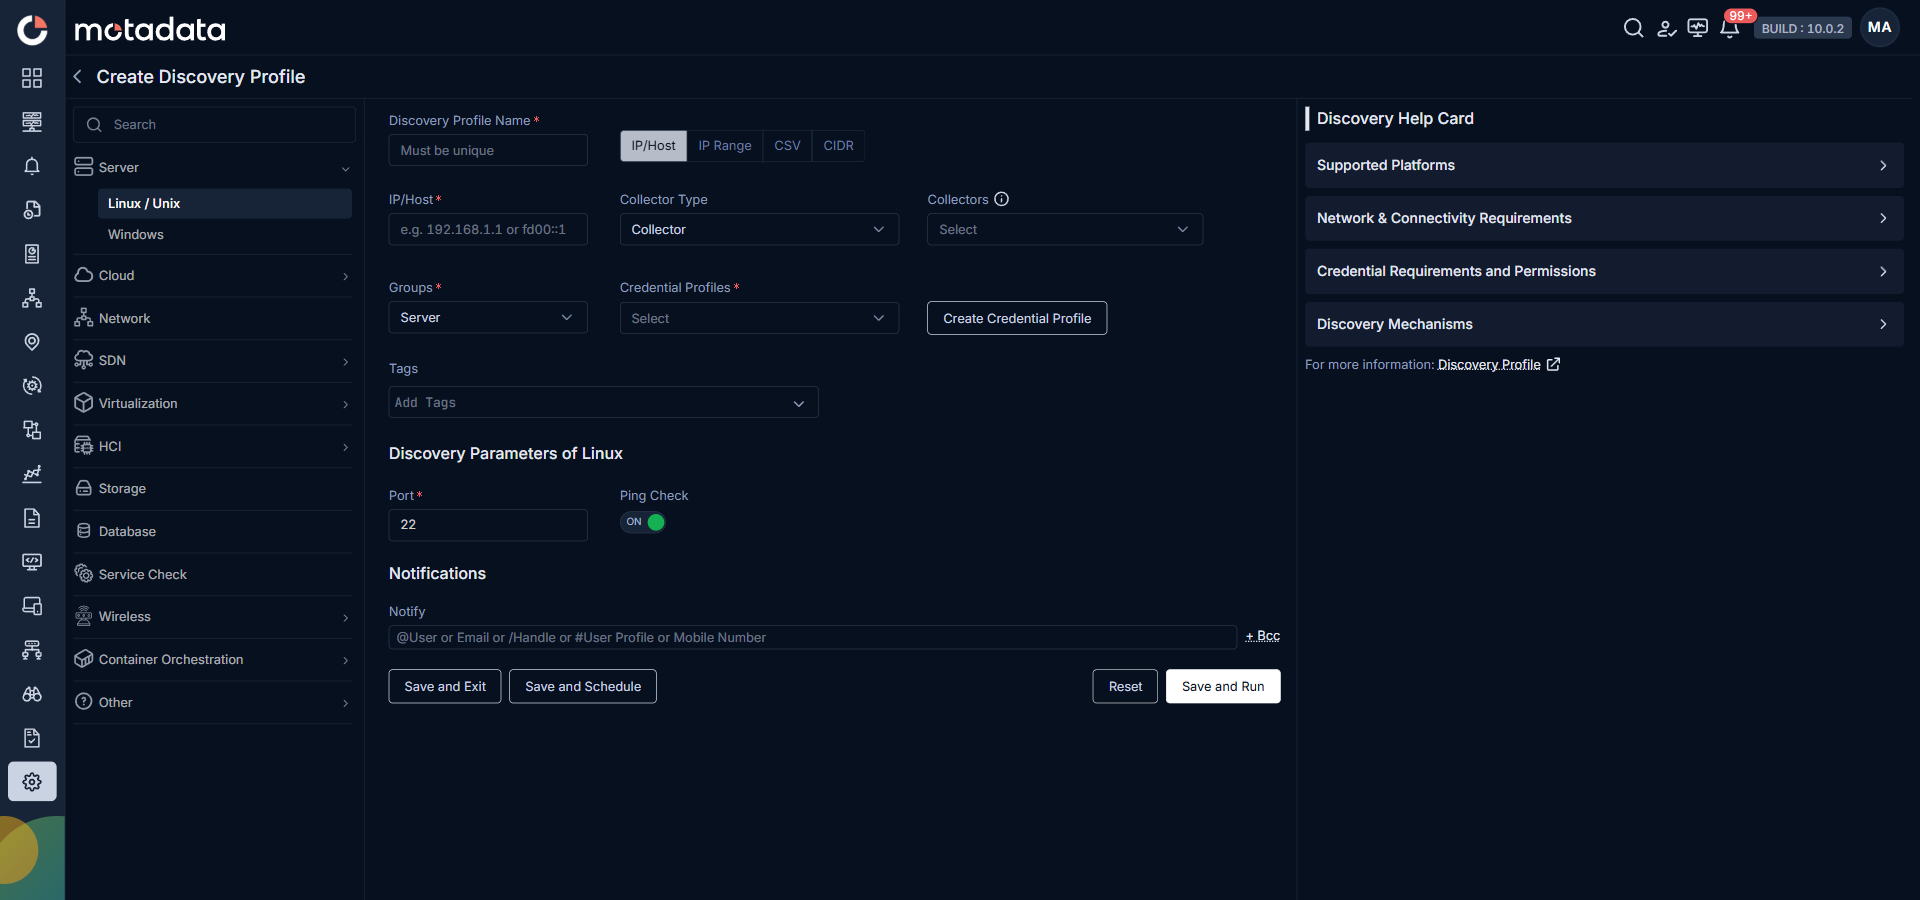
The NCCM Set up button and the toolbar's Add / Discover button both open the Create Discovery Profile screen at Settings → Discovery Settings → Discovery Profile → Create Discovery Profile. Pick the target category from the left rail (Server, Cloud, Network, SDN, Virtualization, HCI, Storage, Database, Service Check, Wireless, Container Orchestration, Other), then complete the discovery form.
Footer Actions
The drill-down footer of a monitored asset shows two buttons.
| Button | What It Does |
|---|---|
| Delete | Remove the monitor from ObserveOps. Requires the existing Monitoring Delete permission. |
| Edit | Open the monitor's edit form so its properties can be changed. |
Blind-Spot Drill-Down
The Unmonitored facet lists sources that are not provisioned as monitors, but are already sending Log, Flow, or Trap data. Selecting an unmonitored source opens a slightly different drill-down.
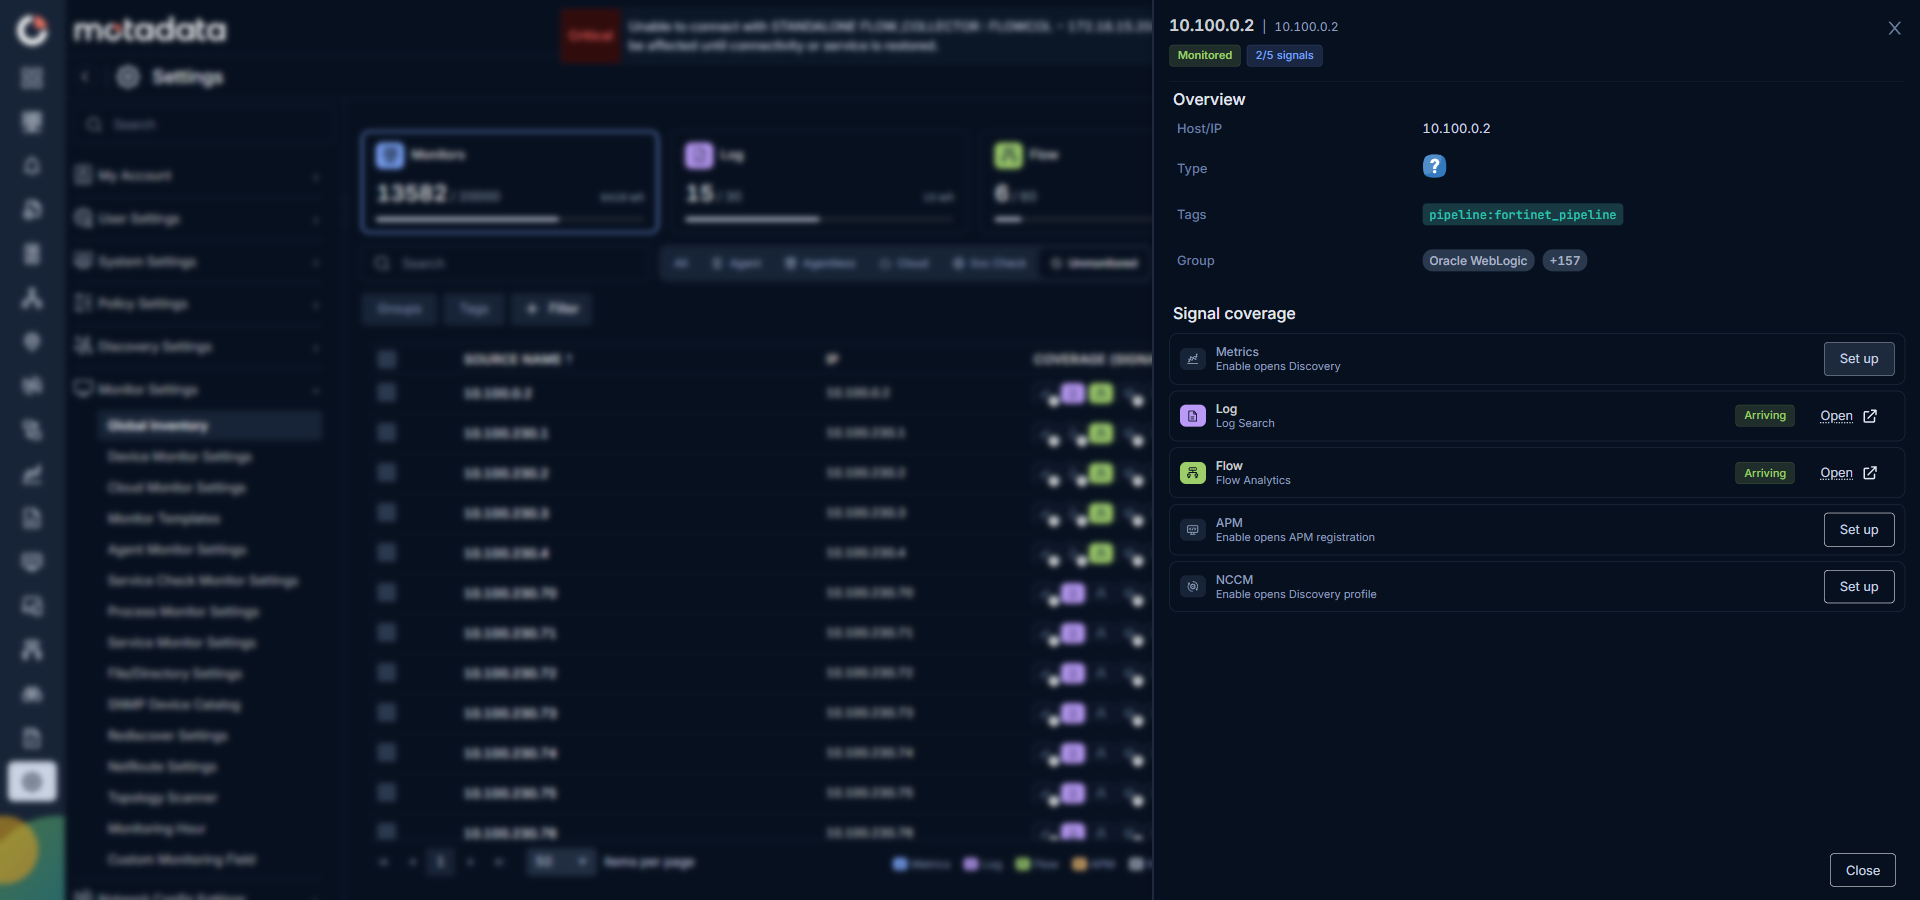
The Overview block shows the source's IP and any tags carried by the incoming pipeline (for example pipeline:fortinet_pipeline). The Signal coverage block reflects the source's true state: signals that are already flowing show Arriving with an Open button; signals that are missing show a Set up button that opens the same onboarding pages listed above.
Because the source is not provisioned, the footer shows a single Close button. No Delete or Edit is available until the source is turned into a monitor through Set up on the Metrics signal.
Blind-spot rows are read from live telemetry, not from a stored inventory. When a source stops sending Log, Flow, or Trap data, it drops out of the Unmonitored facet automatically. Provisioning a blind-spot source as a monitor moves it out of the Unmonitored facet and into the corresponding monitoring-method facet.
Row-Level Actions
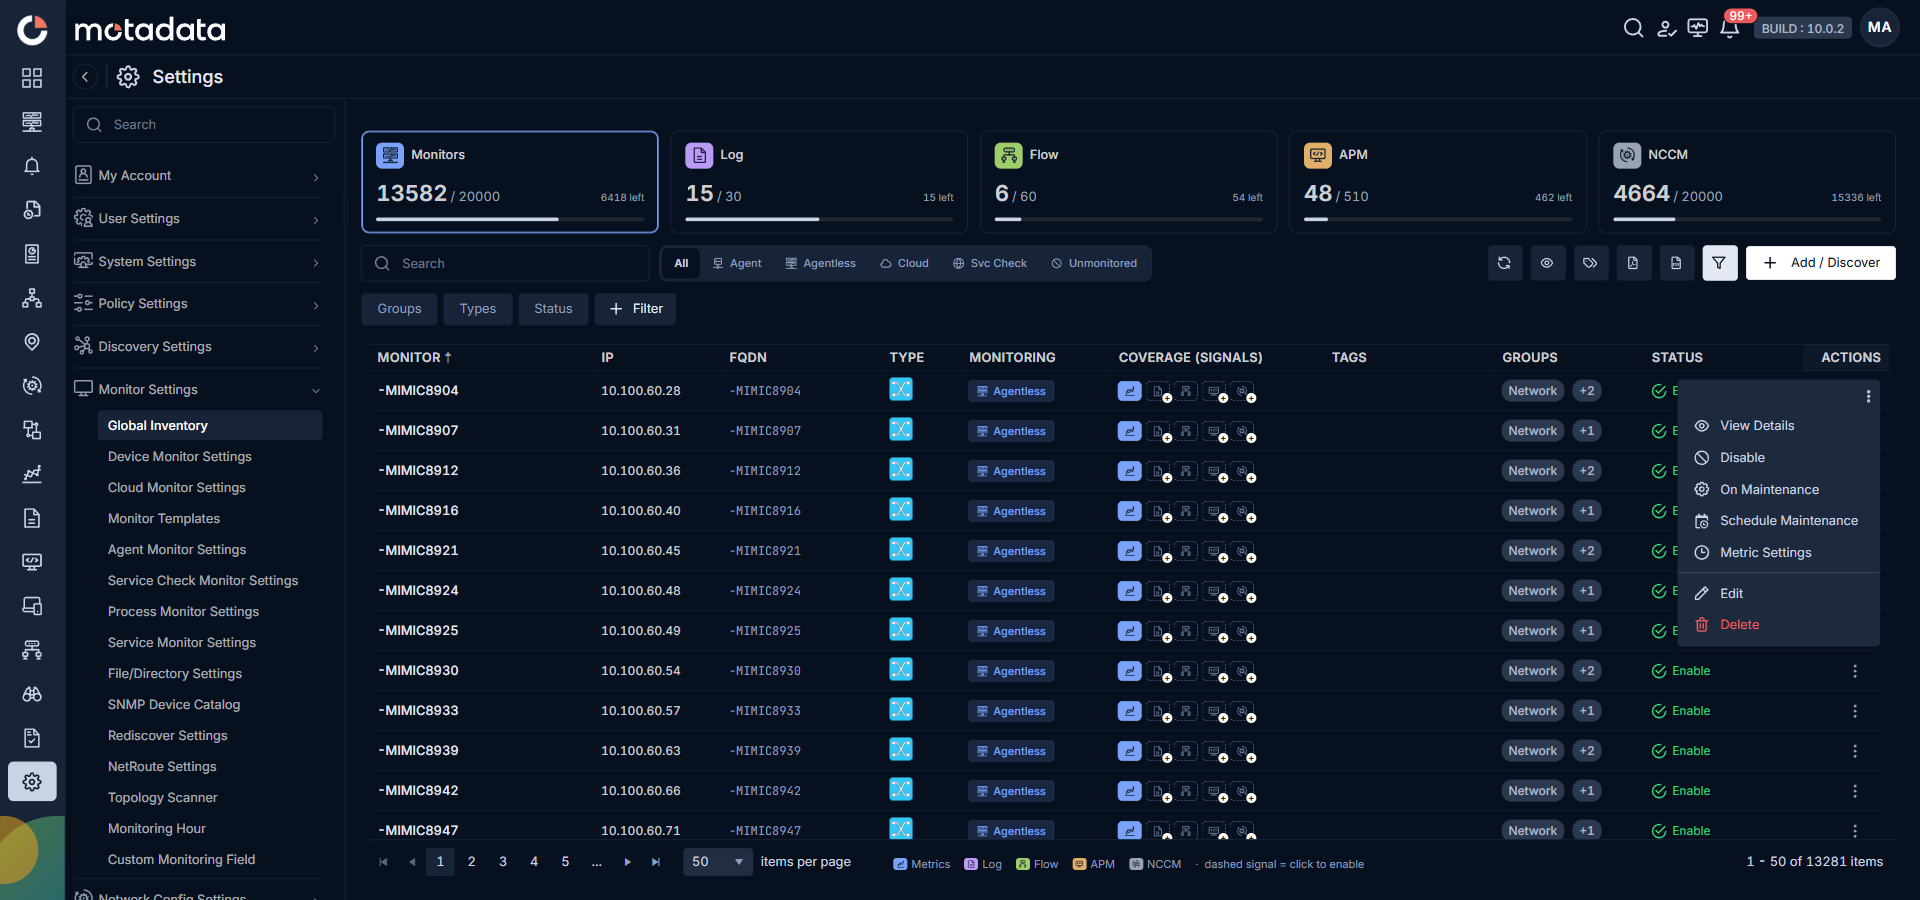
Every row in the grid has an ellipsis (⋮) icon in the Actions column. Selecting it opens a menu with the following options.
| Action | What It Does |
|---|---|
| View Details | Open the same drill-down panel that clicking the asset name opens. |
| Disable | Pause data collection for the asset. The asset remains in the inventory but does not consume any signal capacity while disabled. |
| On Maintenance | Put the asset into a maintenance window so alerts are suppressed. |
| Exclude from Maintenance | Remove the asset from an active maintenance window. |
| Metric Settings | Open the metric-level configuration for the asset. |
| Edit | Open the asset's edit form. |
| Delete | Remove the asset from ObserveOps. Requires the existing Monitoring Delete permission. |
Selecting one or more rows using the row checkboxes surfaces the same actions in a bulk actions bar. Bulk behavior matches the earlier per-module Monitor Settings screens.
Group Sync Between Monitors and Event Sources
Because Global Inventory bridges provisioned monitors and unmonitored event sources, the group assignments on the two sides stay in sync automatically.
- When an unprovisioned source is receiving Log or Flow signals and has a group assigned on the source side, and the same source is later provisioned as a monitor with a different set of groups on the monitor object, ObserveOps merges the groups from both sides and updates both entities.
- When a monitor is already provisioned, changing the groups on either the source or the monitor side updates the other side so the group assignments always match.
Related Topics
- Monitor Settings: configure polling intervals, thresholds, and alert notifications for each monitor.
- What Is a Monitor: learn how ObserveOps represents each monitored asset.
- Discovery Profile Overview: create the discovery profile that a Metrics or NCCM Set up button opens.
- Log Management Overview: understand how log ingestion rules provision the Log signal for an asset.
- APM Ingestion: register an application for APM tracing after selecting Set up on the APM signal.