Log Ingestion in ObserveOps
Log Ingestion is your centralized gateway for bringing logs from servers, applications, databases, network devices, cloud platforms, and event-based integrations into ObserveOps for monitoring and analysis.
The Log Ingestion Screen
Go to Settings > Observability Pipeline > Log Ingestion.
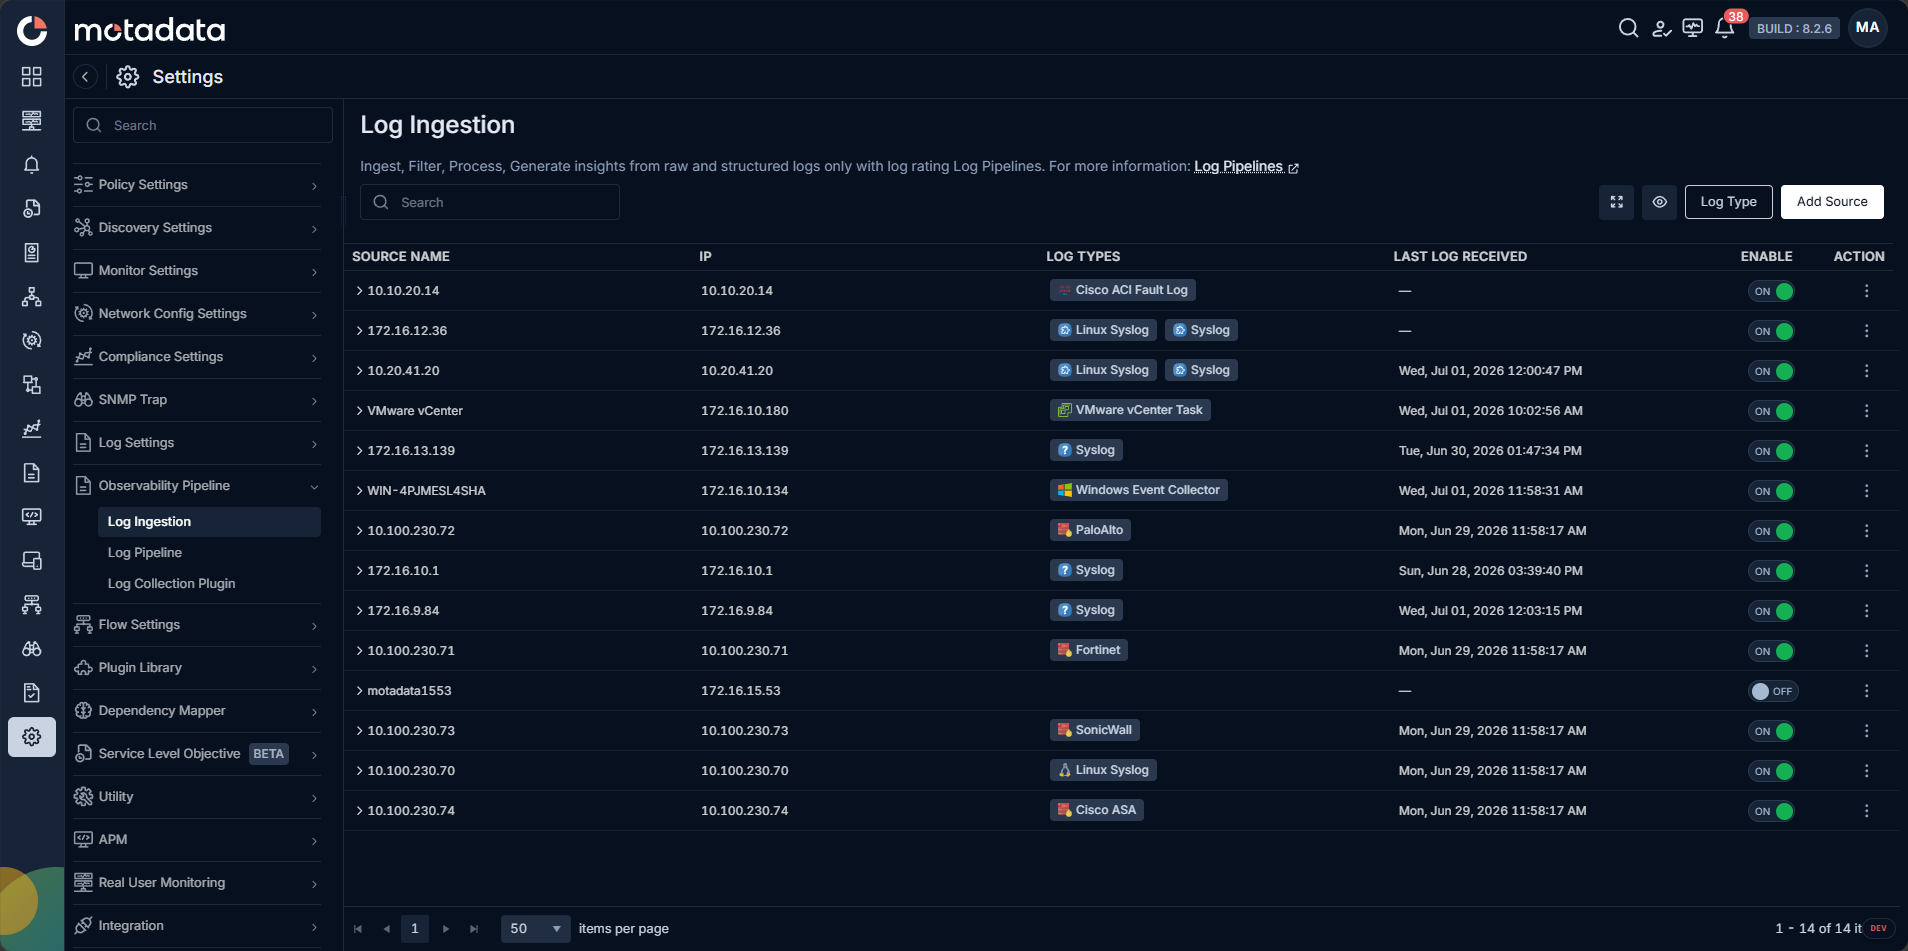
The grid displays all configured log sources and the monitors provisioned in the system that can act as potential log sources until they are configured:
| Column | Description |
|---|---|
| SOURCE NAME | The name of the source. |
| IP | The IP address of the log source. |
| LOG TYPES | The log types being assigned to various logs from this source. |
| LAST LOG RECEIVED | The timestamp of the most recent log received from this source. |
| ENABLE | Toggle to enable or disable logs from this source. |
| ACTION | Edit the log source. |
Click Add Log Source to connect a new source.
Add a Log Source
Click Add Log Source. A panel opens on the right with six source categories on the left:
| Category | How Logs Arrive |
|---|---|
| Application | Via MotaAgent installed on the source server. |
| Syslogs | By remotely enabling r-syslog-forwarding for Linux devices via Log Collection Plugin. |
| Database | Via MotaAgent installed on the database server. |
| Cloud | Pulled from cloud provider APIs via Log Collection Plugins. |
| TCP/UDP | Directly over TCP or UDP network connections. |
| Events | Via MotaAgent (agent-based) or (agentless-based) from Windows, vCenter, Cisco, and others. |
Select a category, fill in the form, and click Add Source.
- Application
- Syslogs
- Database
- Cloud
- TCP/UDP
- Events
Application logs arrive through MotaAgent installed on the source server.
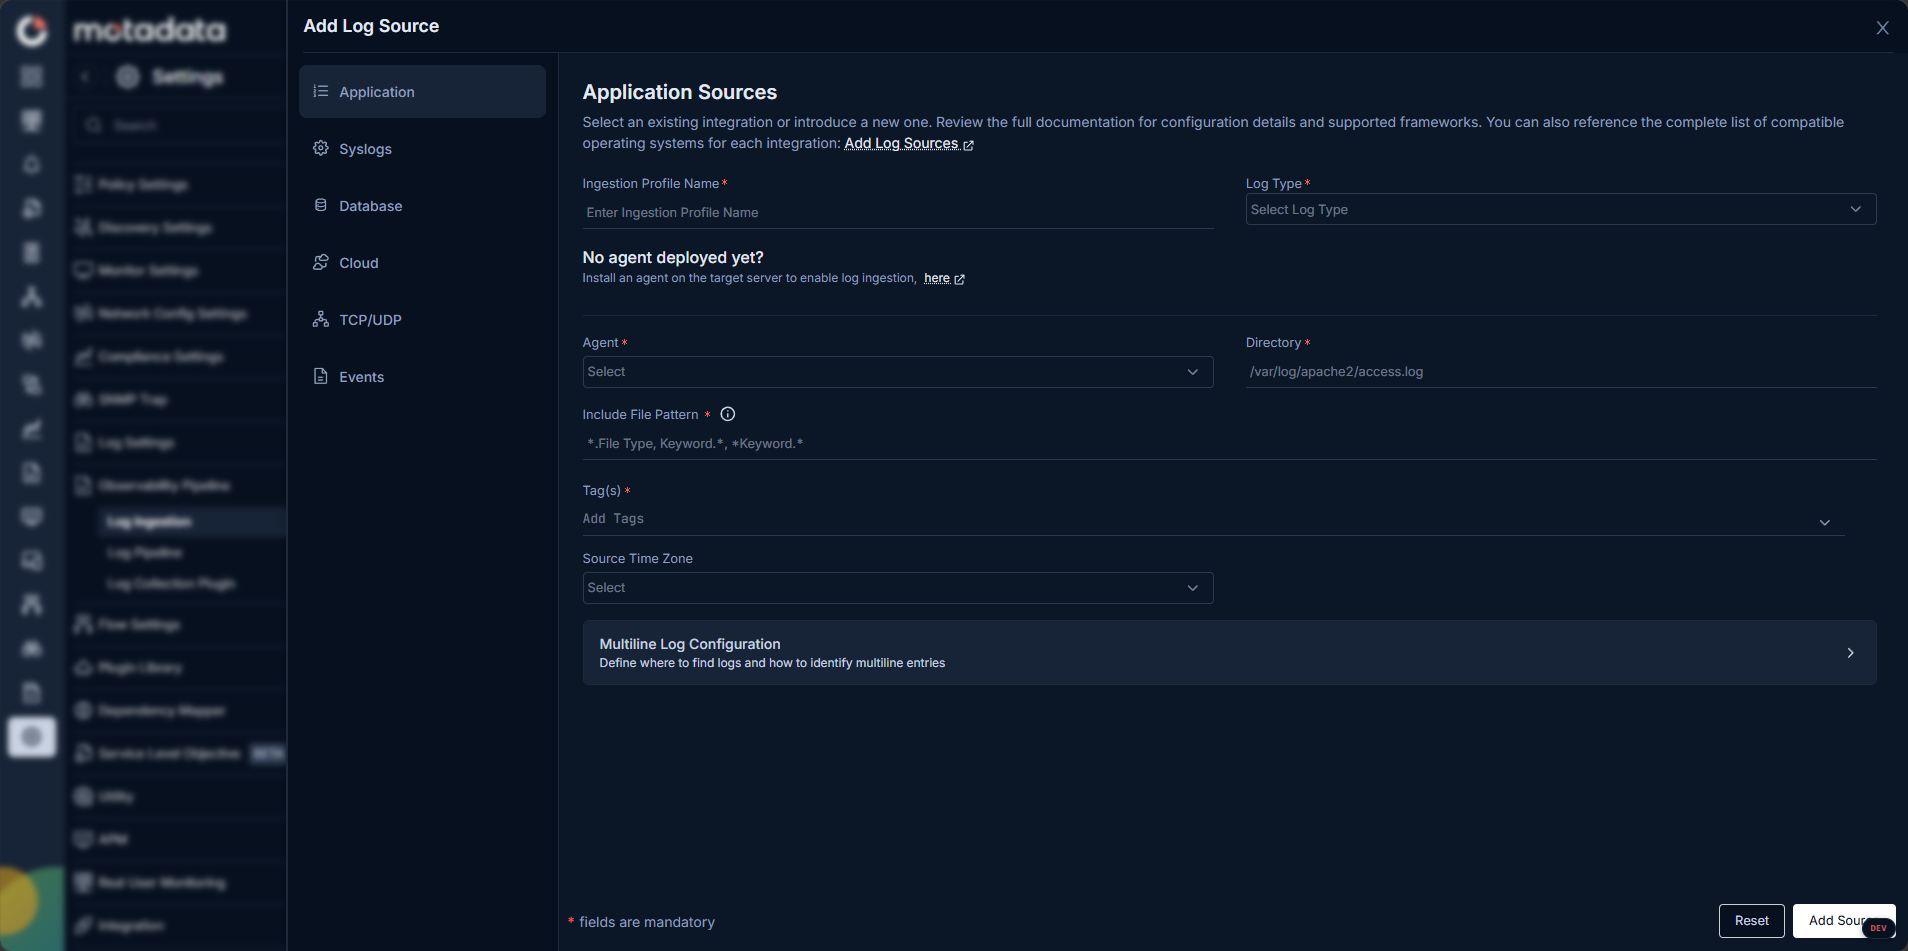
| Field | Description |
|---|---|
| Ingestion Profile Name | A unique name for this ingestion profile |
| Log Type | The log type to assign to logs from this source |
| Agent | Select the MotaAgent installed on the source server |
| Directory | Full path to the directory where log files are stored |
| Include File Pattern | File name or extension to collect. Example: *.log collects all .log files. |
| Tag(s) | Optional tags to attach to all logs from this source |
| Source Time Zone | The time zone of the source server |
Multiline Log Configuration: Enable this section to handle logs where a single entry spans multiple lines. Configure these settings:
| Field | Description |
|---|---|
| File Pattern | File name or extension that contains multiline logs. |
| Log Pattern | A regular expression that matches the first line of each new log entry |
After you click Add Source, this configured ingestion profile lists within the selected agent, where you can monitor the last received log timestamp and health of the ingestion profile.
If MotaAgent is not yet deployed on the target server, the form shows a "No agent deployed yet?" message. Install MotaAgent first, then return to complete the profile.
Motadata ObserveOps supports remote enablement of rsyslog forwarding on Linux devices using the log collection plugin. After you provide the IP range and valid credentials on the Add Syslog as Source screen, ObserveOps can remotely configure the target devices for log forwarding.
Ensure that the SSH port is reachable from the Master Server. ObserveOps remotely runs a script on the target nodes to enable rsyslog forwarding over TCP or UDP to the displayed destination IP address of the ObserveOps application.
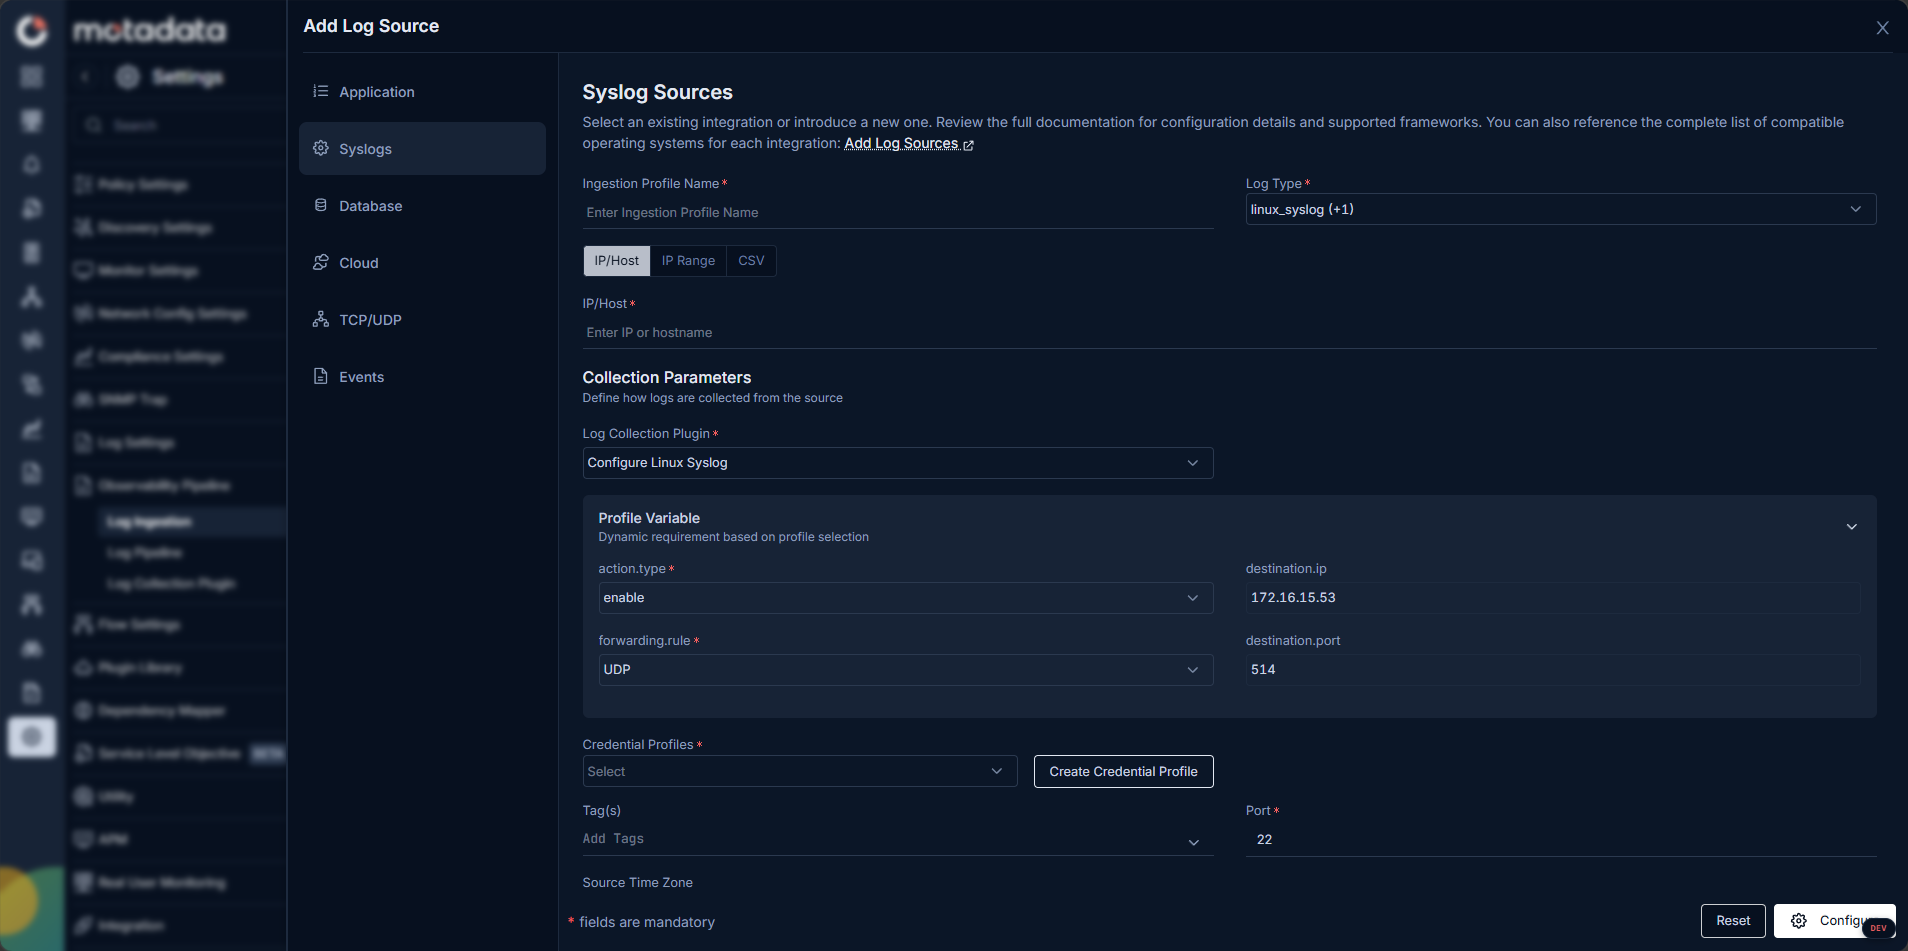
| Field | Description |
|---|---|
| Ingestion Profile Name | A unique name for this ingestion profile. |
| Log Type | The log type to assign (example: linux_syslog). |
| IP/Host | Enter the IP address or hostname of the syslog source. Use the IP Range or CSV tabs to add multiple sources at once. |
| Log Collection Plugin | Select the plugin that matches syslog (example: Configure Linux Syslog). |
Profile Variable - Set dynamic parameters for the collection plugin:
| Parameter | Description |
|---|---|
| action.type | Enable or disable the collection action. |
| destination.ip | The IP address ObserveOps listens on. |
| forwarding.rule | Protocol for forwarding (example: UDP). |
| destination.port | The port ObserveOps listens on. |
| Credential Profiles | Authentication credentials if required. |
| Tag(s) | Tags to attach to all logs from this source. |
| Port | The port for collection. |
After saving, ObserveOps shows a Syslog Configure Progress screen while it applies the configuration to the target.
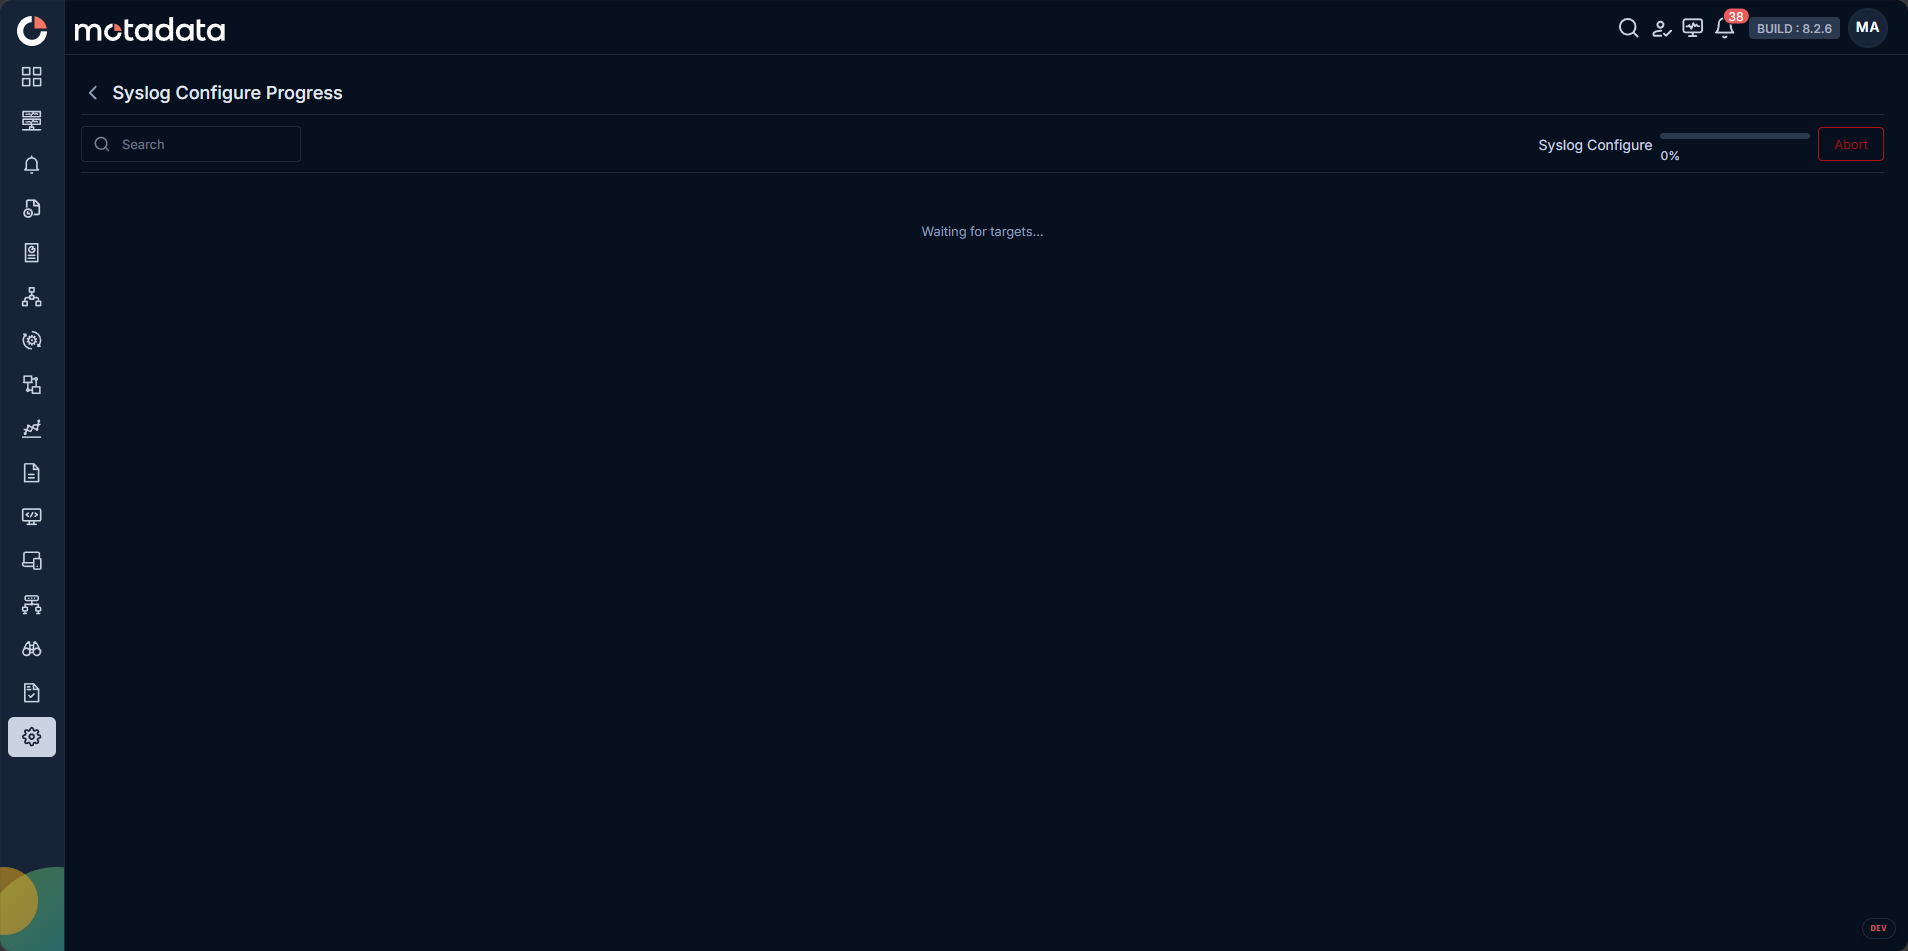
When complete, the Syslog Configure Result screen shows the outcome for each source with STATUS and MESSAGE columns.
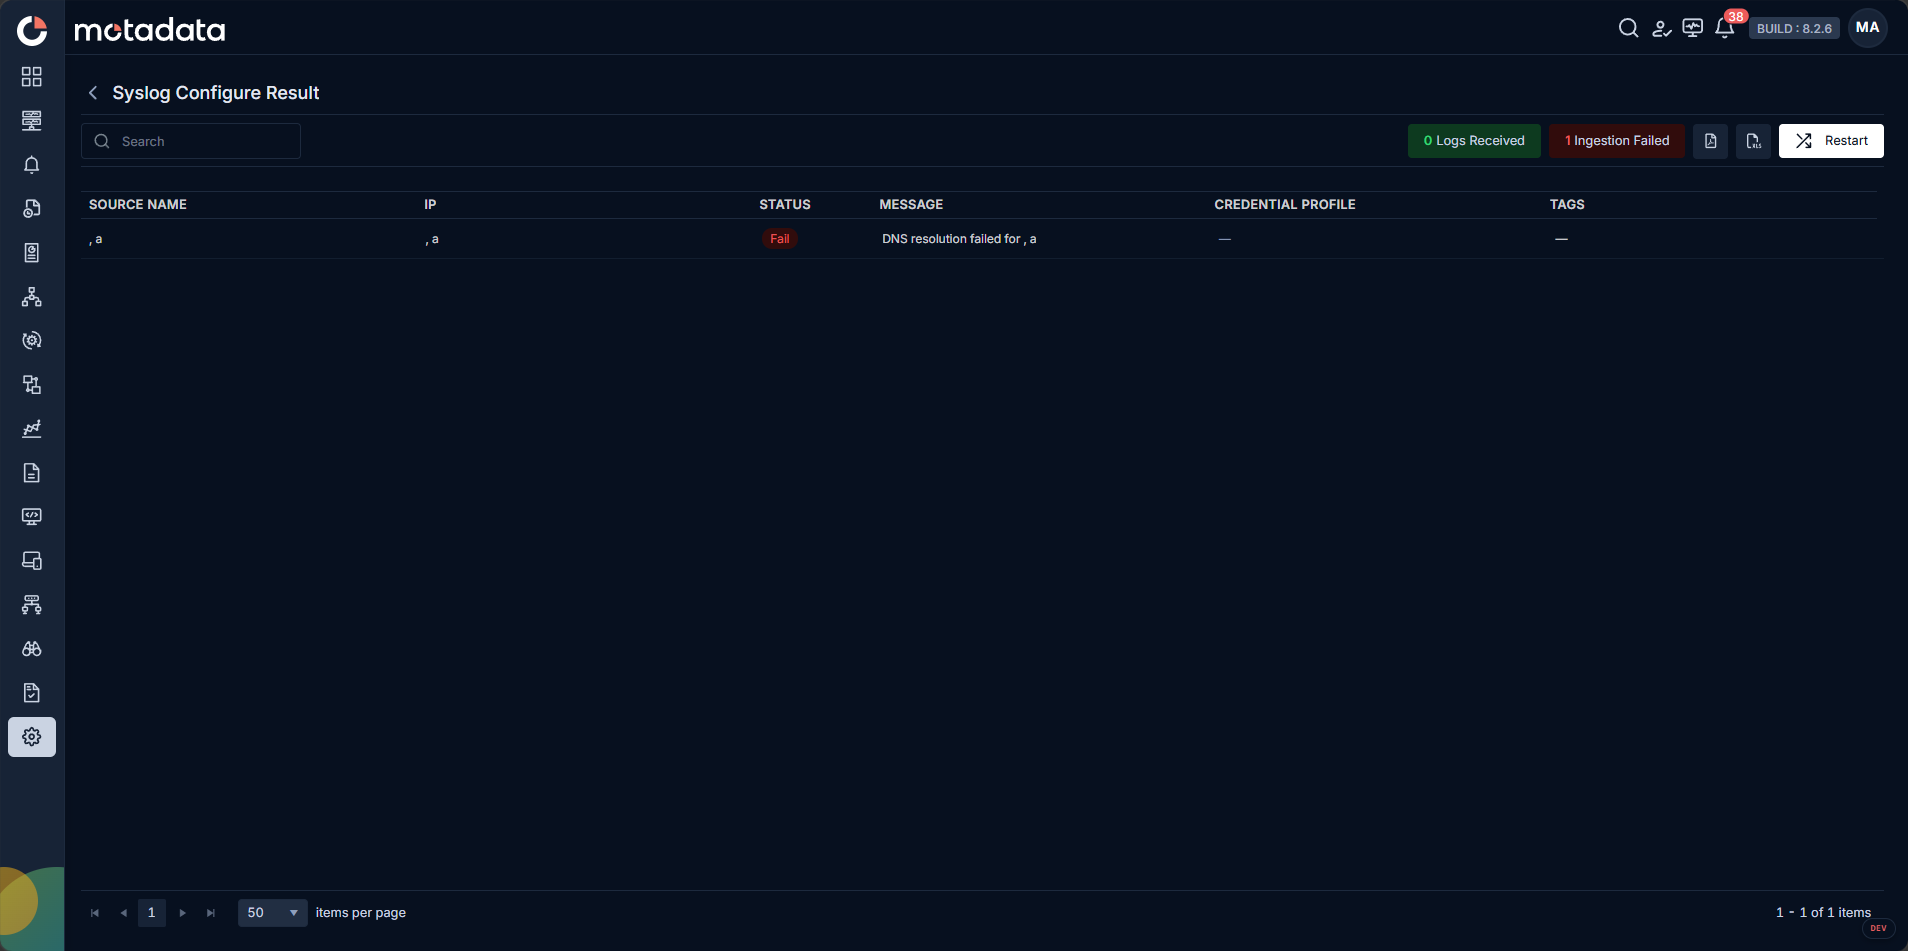
| Column | Description |
|---|---|
| SOURCE NAME | The name of the ingestion profile just configured. |
| IP | The IP address of the syslog source. |
| STATUS | Whether the configuration succeeded or failed. |
| MESSAGE | A description of the outcome or the error if configuration failed. |
| CREDENTIAL PROFILE | The credential profile used, if any. |
| TAGS | Any tags attached to this source. |
After the configuration is completed successfully, the source appears in the Log Ingestion list, and ObserveOps starts receiving syslog data on the configured port.
You can filter the results by successful or failed ingestion attempts using the respective buttons available in the top-right corner. All IPs with successful ingestion attempts are listed in the Log Ingestion grid along with their corresponding ingestion profile.
The flow for enabling syslog forwarding using the Add Log Source button applies only to new log sources that are not already available in the Log Ingestion grid.
To enable syslog for devices already listed in the Log Ingestion grid, click the action icon and add syslog from there. For such devices, the credential profile may already be available if the device is also a monitor, or it can be provided manually by the user.
Database logs arrive through MotaAgent installed on the database server.
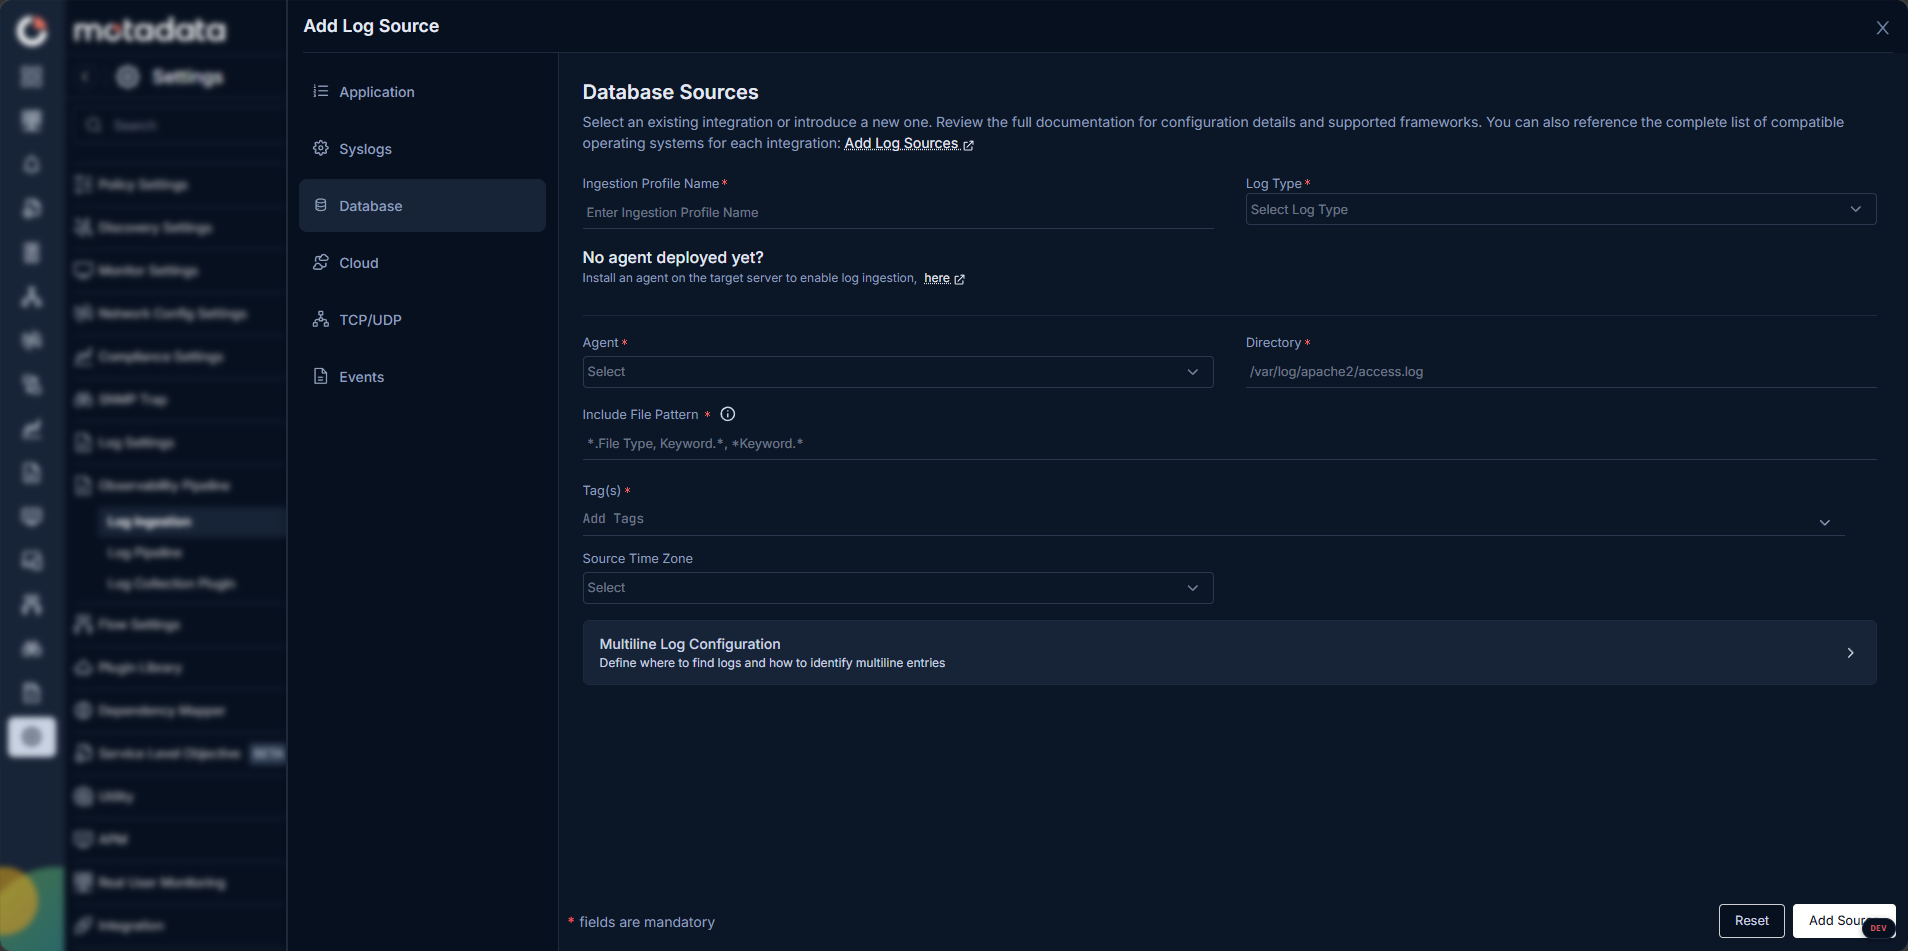
The configuration fields are the same as Application sources. Select the agent installed on the database server, set the directory path, and define the file pattern.
If MotaAgent is not yet deployed on the database server, install it first before creating this profile.
Cloud sources pull logs from cloud provider APIs using Log Collection Plugins. ObserveOps includes built-in collectors for AWS, Azure, and Microsoft 365 services.
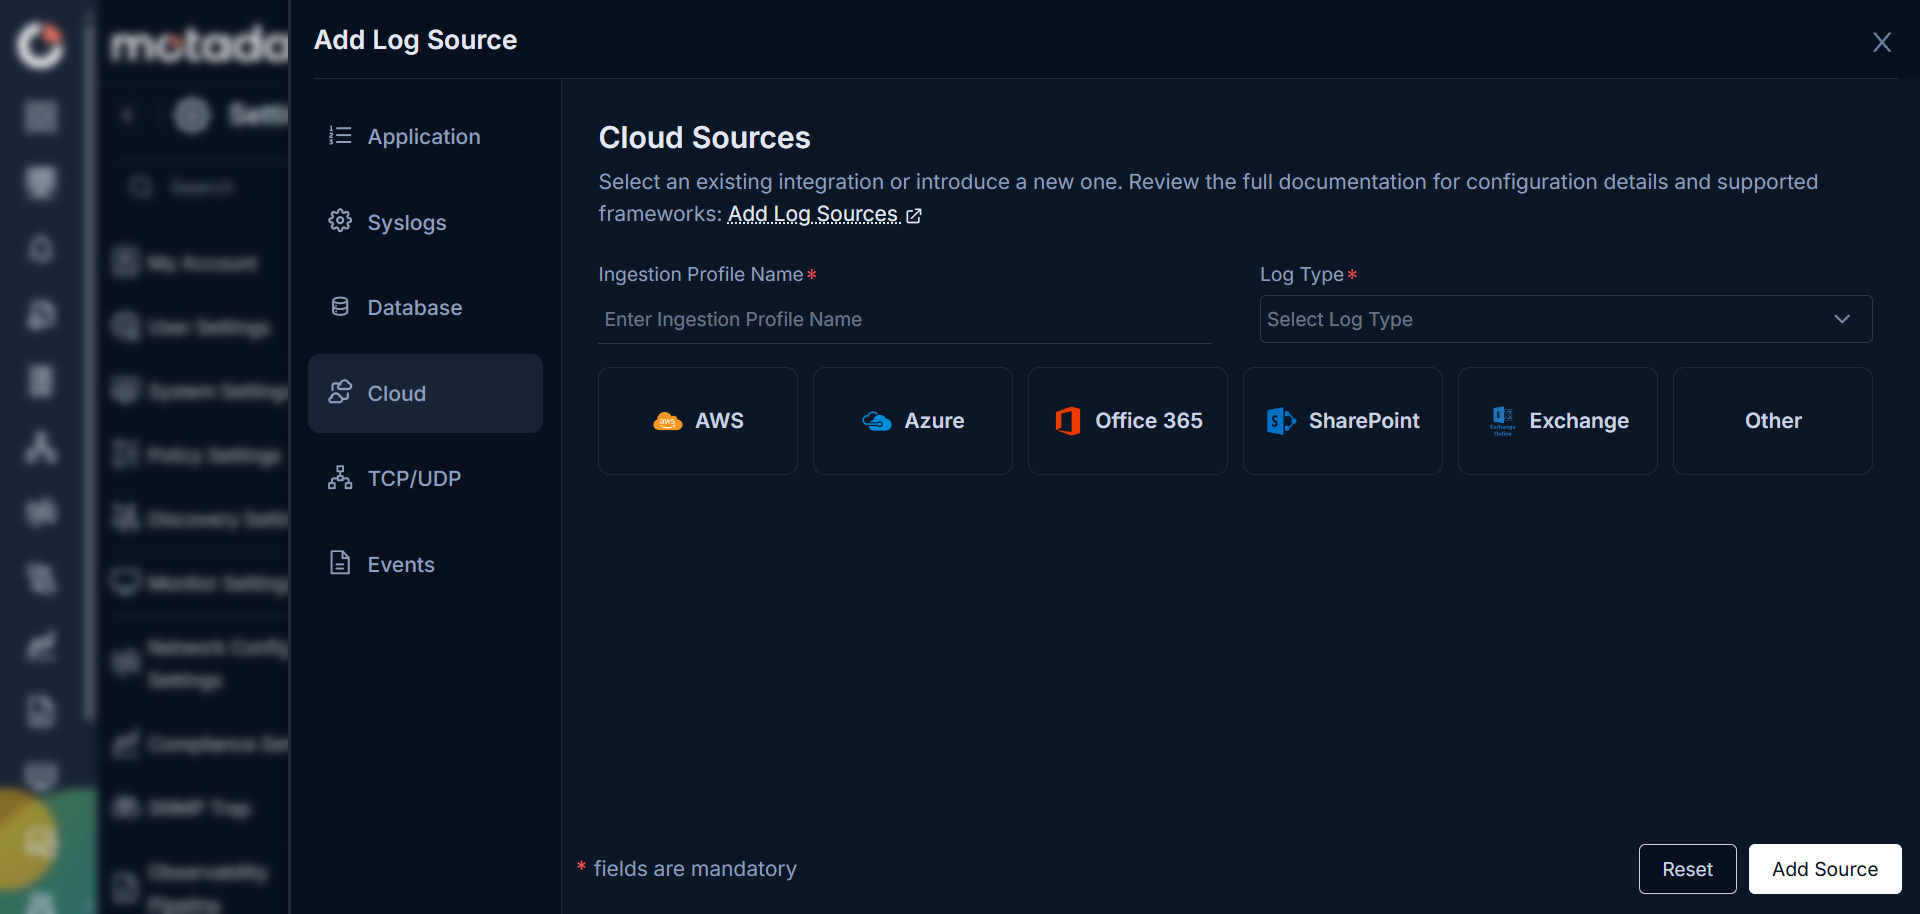
Enter an Ingestion Profile Name and select a Log Type, then click a provider card to load its collection settings.
AWS
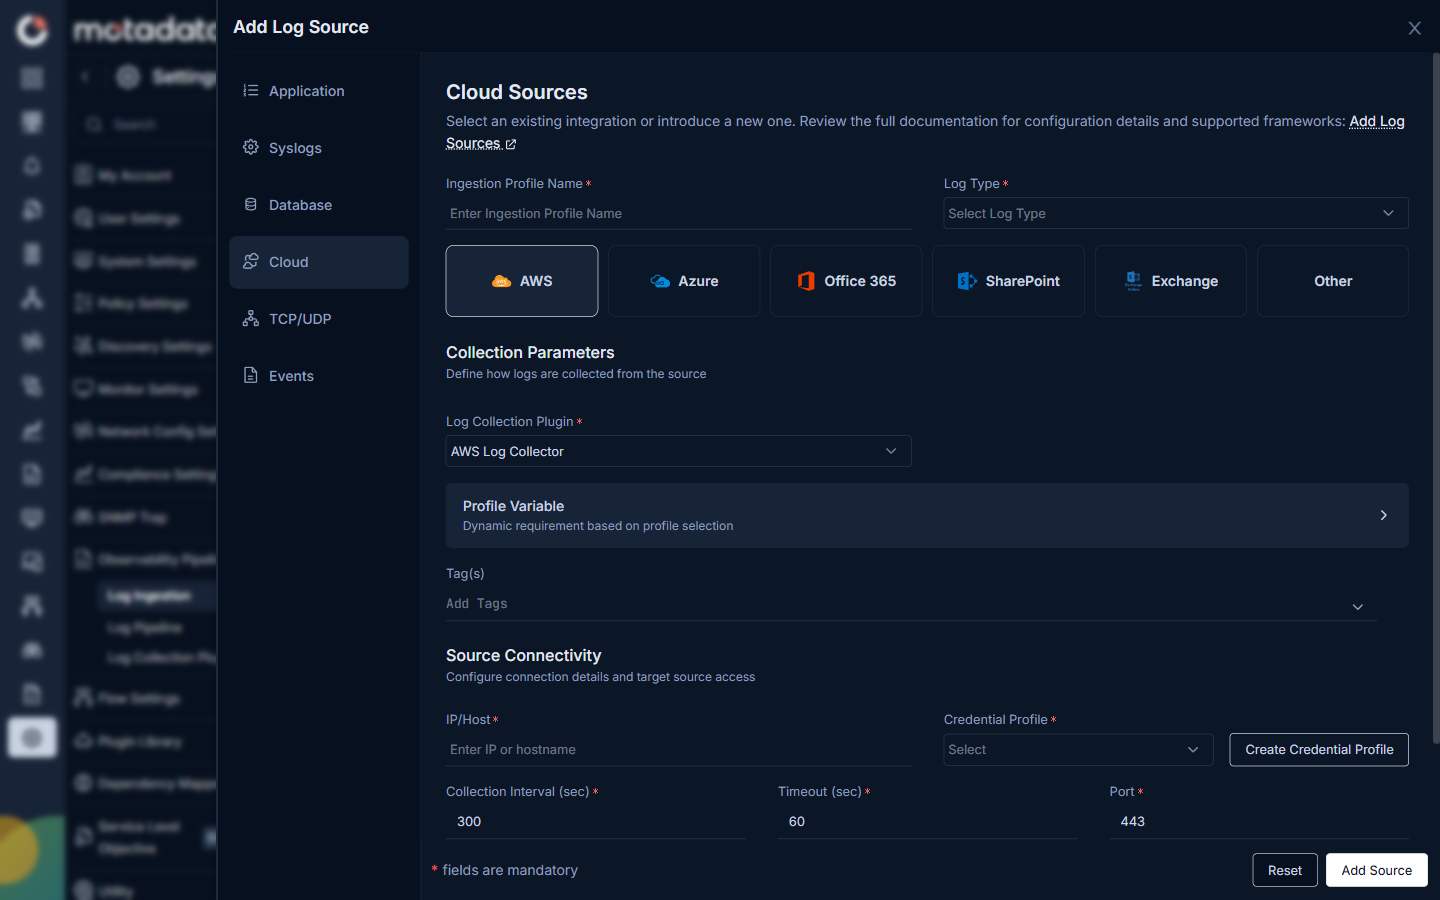
ObserveOps uses the AWS Log Collector plugin to pull logs from your AWS environment.
| Field | Description |
|---|---|
| Log Collection Plugin | Preset to AWS Log Collector. ObserveOps uses this plugin to connect to your AWS account and pull logs. |
| Profile Variable | Dynamic parameters driven by the selected plugin. Expand this section to review or update the values before saving. |
| Tag(s) | Optional tags to attach to every log collected from this source. Use tags to filter and group logs in Log Explorer. |
| IP/Host | The IP address or hostname of the AWS endpoint ObserveOps connects to. |
| Credential Profile | The credential profile that holds your AWS access keys. Click Create Credential Profile to add one if none exists. |
| Collection Interval (sec) | How often ObserveOps pulls logs from AWS. Default is 300 seconds. Lower this value if you need near-real-time log collection. |
| Timeout (sec) | The maximum time ObserveOps waits for a response before it marks the attempt as failed. Default is 60 seconds. |
| Port | The port ObserveOps uses to connect. Default is 443. |
Azure
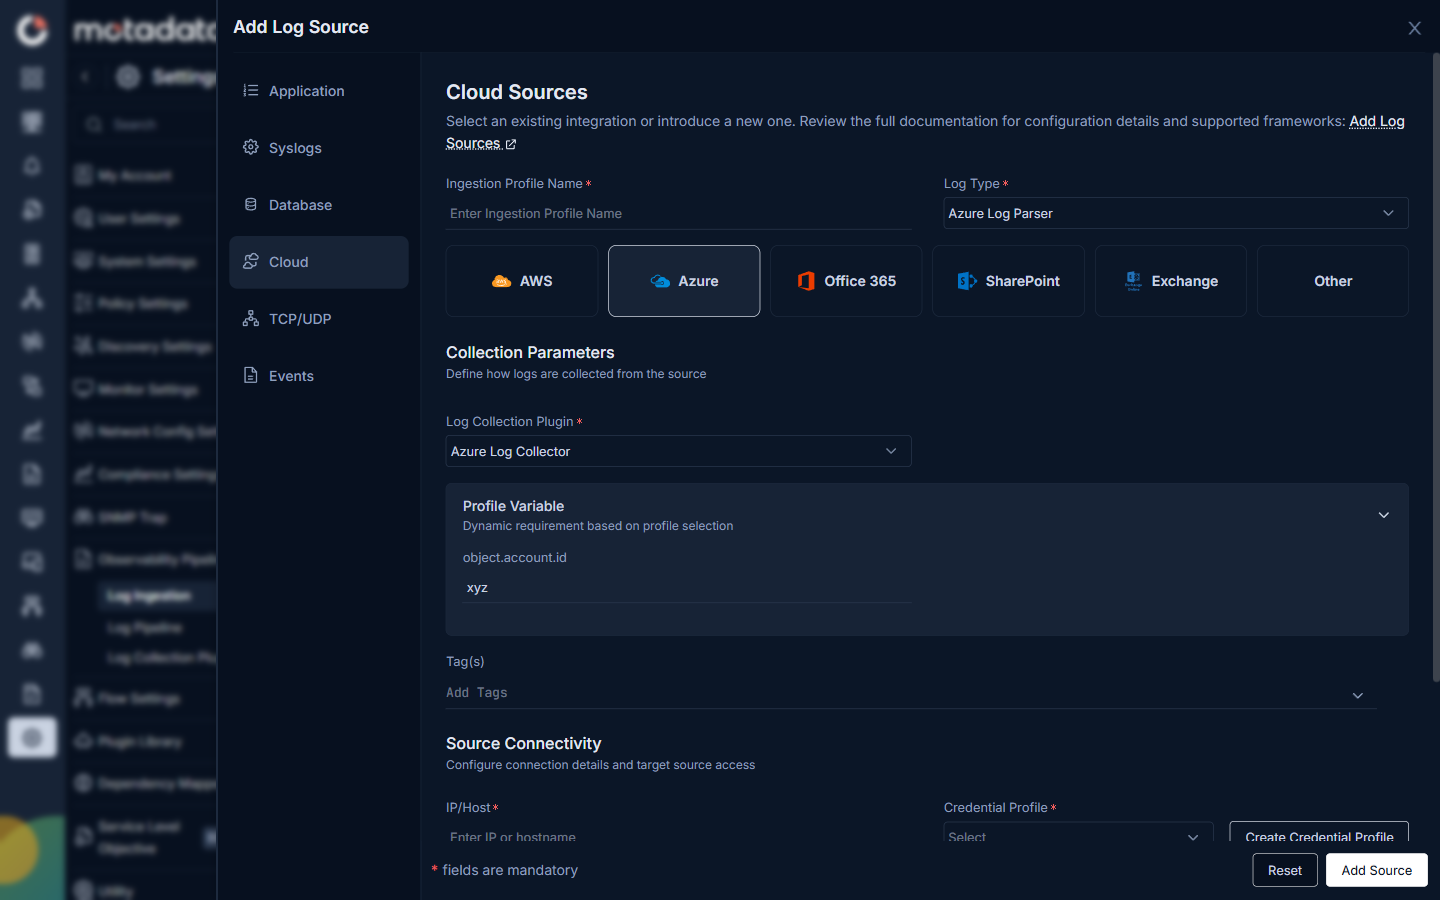
ObserveOps uses the Azure Log Collector plugin to pull logs from your Azure environment.
| Field | Description |
|---|---|
| Log Collection Plugin | Preset to Azure Log Collector. |
| object.account.id | Your Azure account ID. Enter this value in the Profile Variable section so ObserveOps can identify which Azure account to connect to. |
| Tag(s) | Optional tags to attach to every log collected from this source. |
| IP/Host | The IP address or hostname of the Azure endpoint. |
| Credential Profile | The credential profile with access to your Azure account. Click Create Credential Profile to add one if none exists. |
Office 365
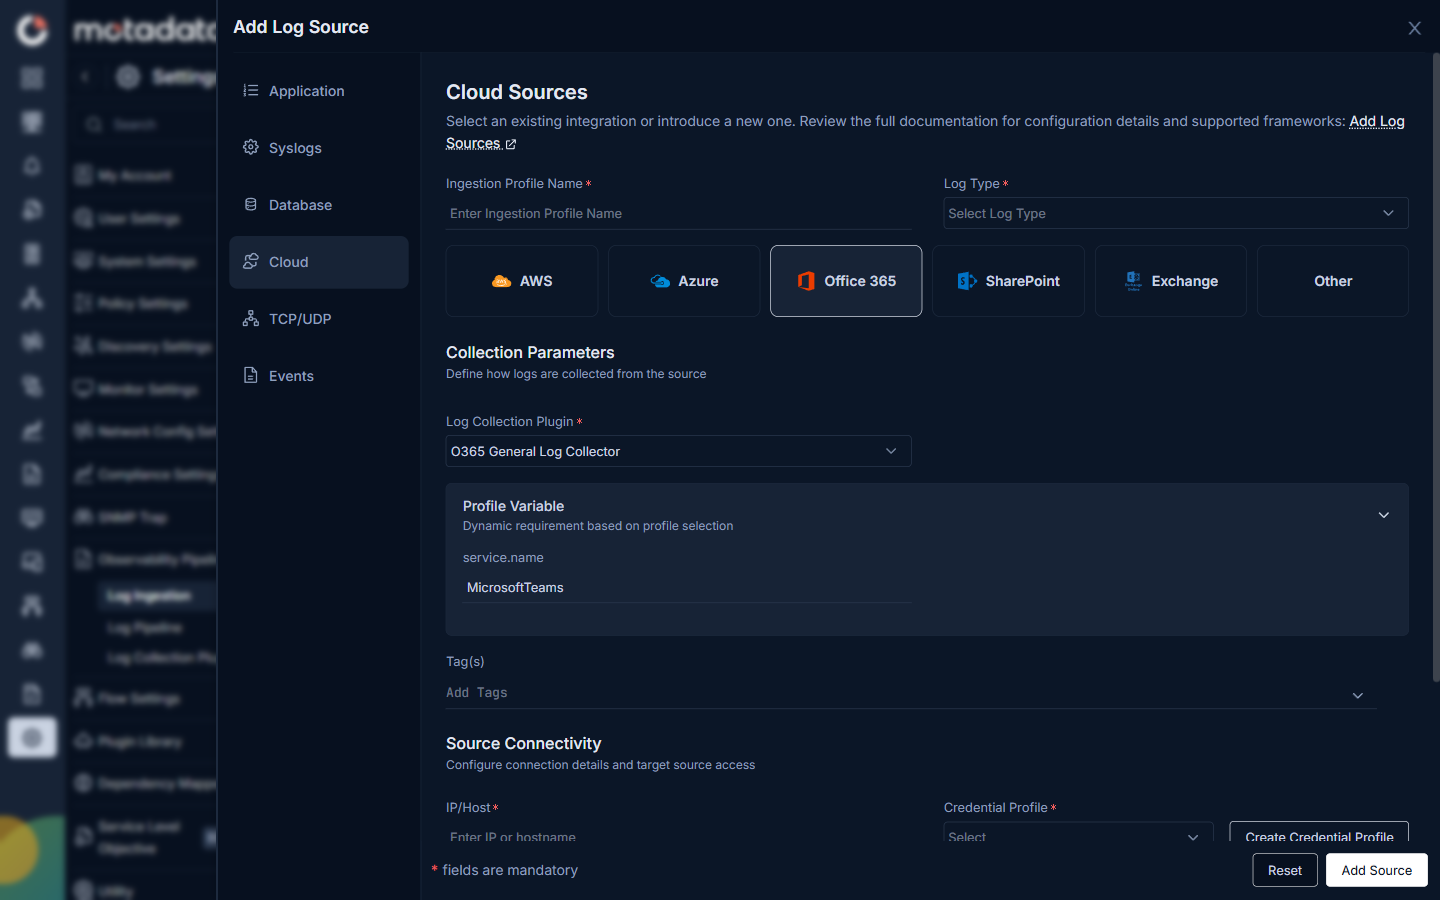
ObserveOps uses the O365 General Log Collector plugin to pull Office 365 audit logs.
| Field | Description |
|---|---|
| Log Collection Plugin | Preset to O365 General Log Collector. |
| service.name | The Office 365 service you want logs from. The default value is MicrosoftTeams. Update this to match the service you want to monitor. |
| Tag(s) | Optional tags to attach to every log collected from this source. |
| IP/Host | The IP address or hostname of the Office 365 endpoint. |
| Credential Profile | The credential profile with access to your Microsoft 365 tenant. Click Create Credential Profile to add one if none exists. |
SharePoint
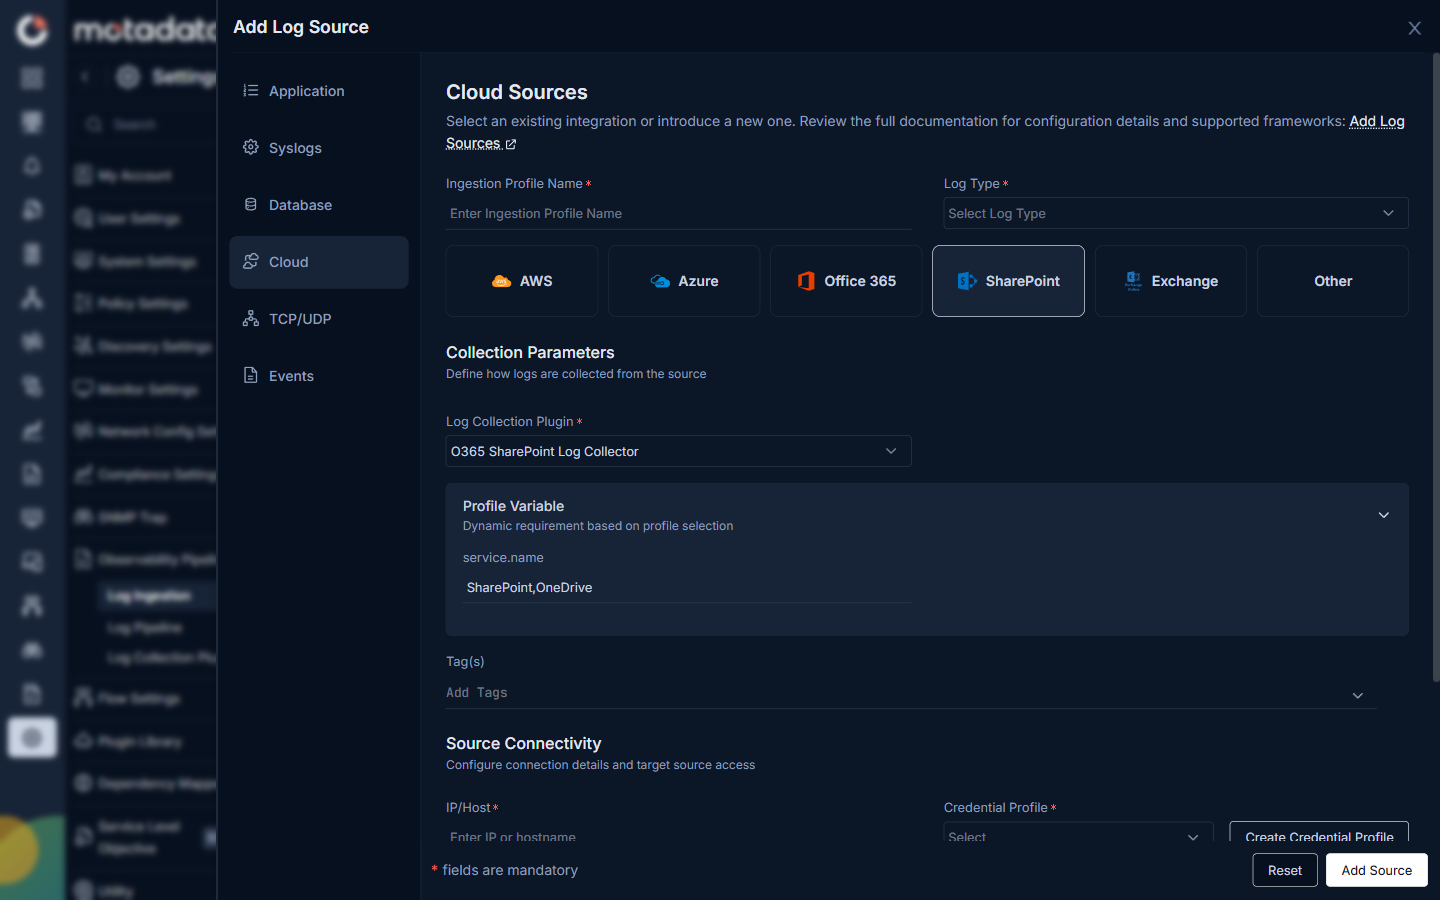
ObserveOps uses the O365 SharePoint Log Collector plugin to pull audit logs from SharePoint and OneDrive.
| Field | Description |
|---|---|
| Log Collection Plugin | Preset to O365 SharePoint Log Collector. |
| service.name | The Microsoft 365 services to collect logs from. The default value is SharePoint,OneDrive. Update this to restrict collection to a single service if needed. |
| Tag(s) | Optional tags to attach to every log collected from this source. |
| IP/Host | The IP address or hostname of the SharePoint endpoint. |
| Credential Profile | The credential profile with access to your Microsoft 365 tenant. Click Create Credential Profile to add one if none exists. |
Exchange
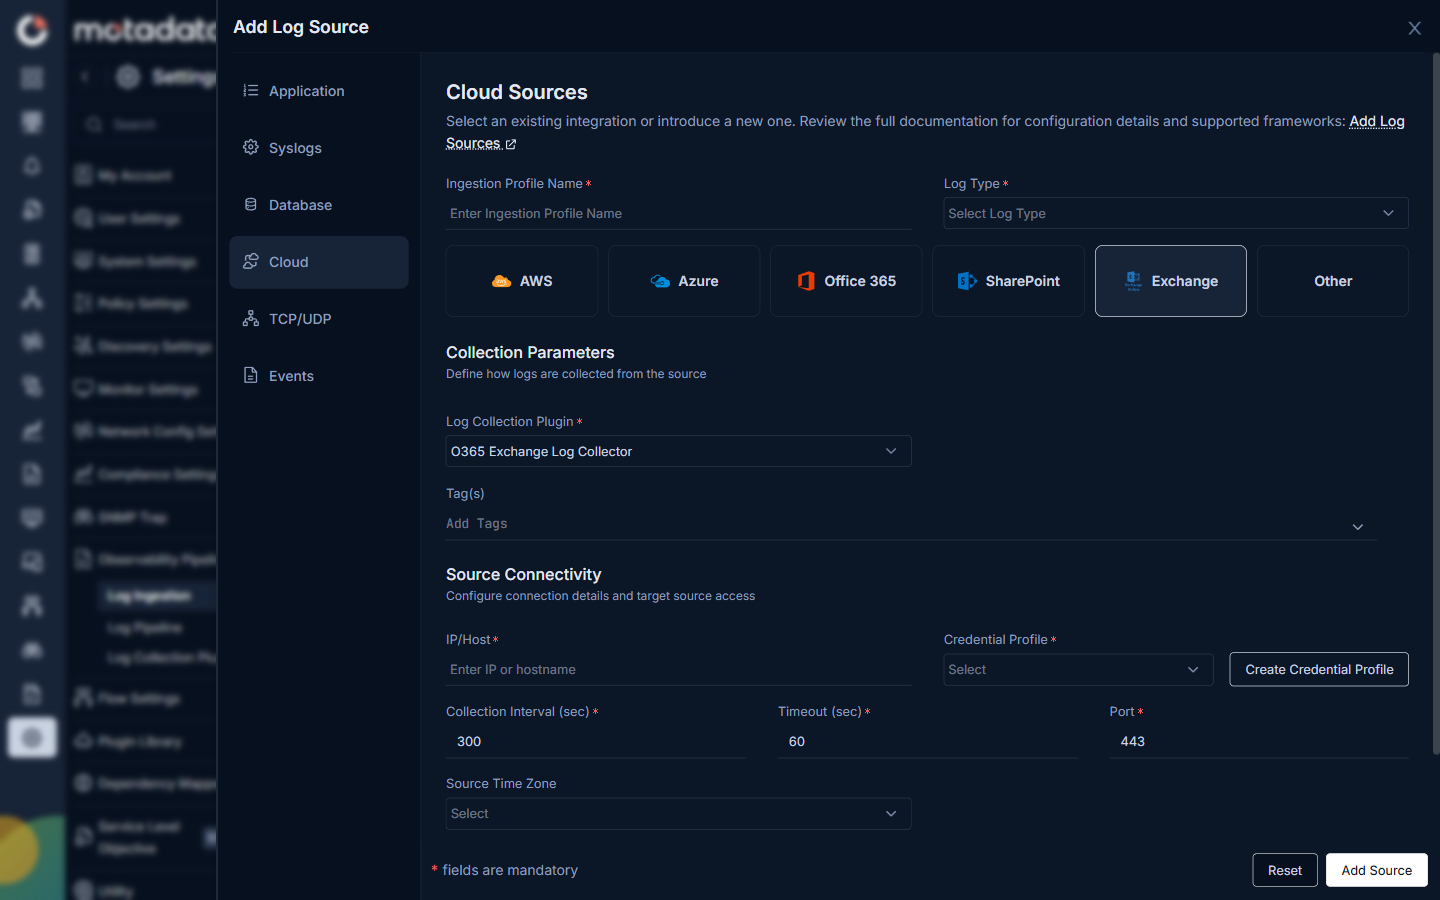
ObserveOps uses the O365 Exchange Log Collector plugin to pull Exchange message tracking and audit logs.
| Field | Description |
|---|---|
| Log Collection Plugin | Preset to O365 Exchange Log Collector. |
| Tag(s) | Optional tags to attach to every log collected from this source. |
| IP/Host | The IP address or hostname of the Exchange endpoint. |
| Credential Profile | The credential profile with access to your Microsoft 365 tenant. Click Create Credential Profile to add one if none exists. |
| Collection Interval (sec) | How often ObserveOps pulls logs from Exchange. Default is 300 seconds. |
| Timeout (sec) | The maximum time ObserveOps waits for a response before marking the attempt as failed. Default is 60 seconds. |
| Port | The port ObserveOps uses to connect. Default is 443. |
| Source Time Zone | The time zone of the Exchange server. Select this so ObserveOps timestamps log entries correctly. |
Other
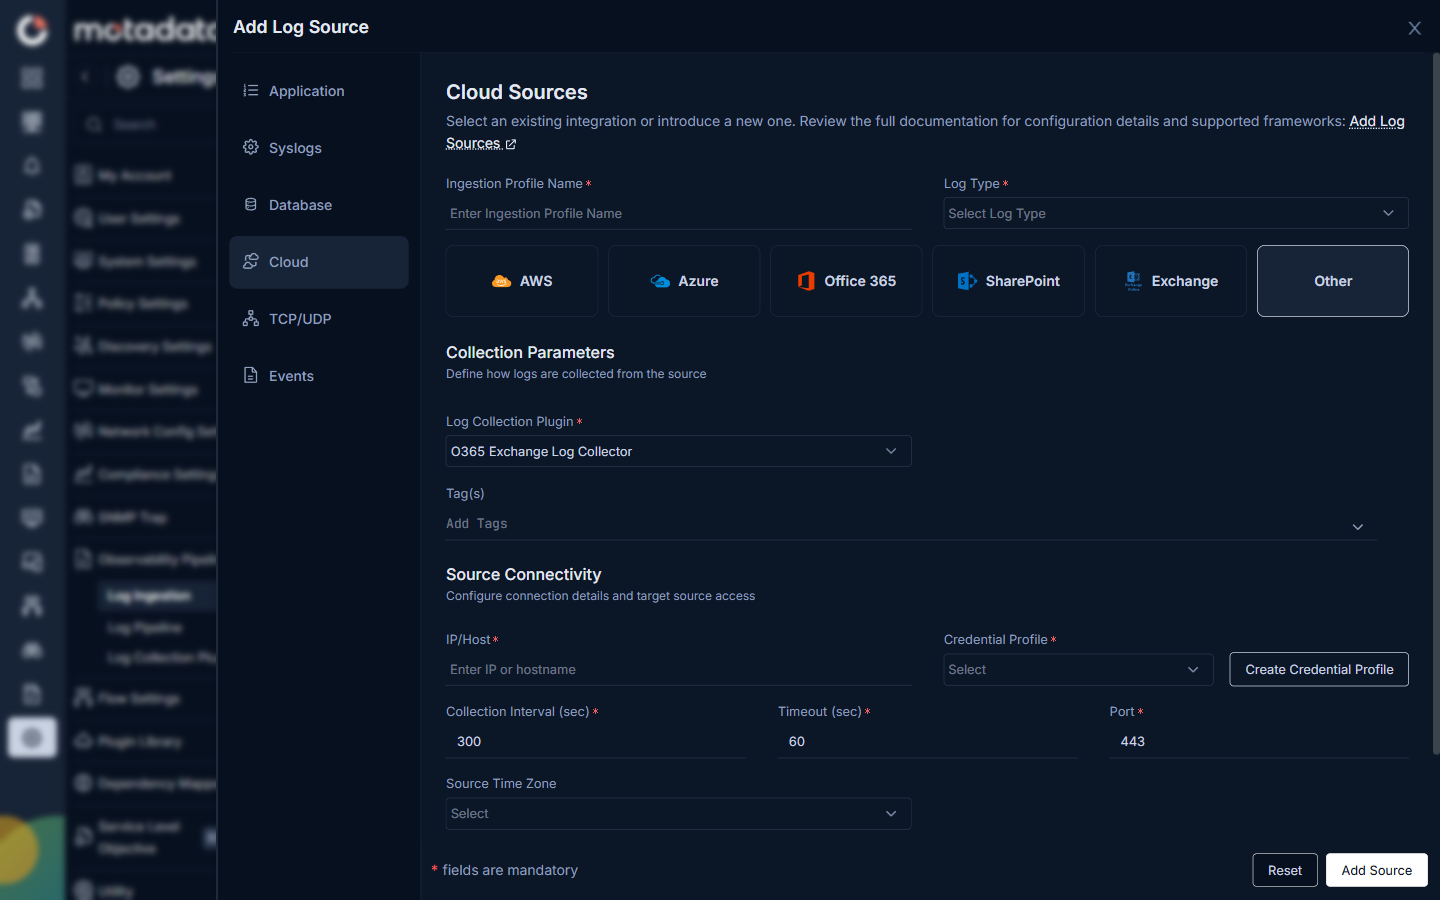
Use this option to connect a cloud source that does not have a built-in card. Select the Log Collection Plugin that matches your source.
| Field | Description |
|---|---|
| Log Collection Plugin | Select the plugin that matches your custom cloud source. ObserveOps uses this plugin to define how it connects and collects logs. |
| Tag(s) | Optional tags to attach to every log collected from this source. |
| IP/Host | The IP address or hostname of the cloud source endpoint. |
| Credential Profile | The credential profile with access to the source. Click Create Credential Profile to add one if none exists. |
| Collection Interval (sec) | How often ObserveOps pulls logs. Default is 300 seconds. |
| Timeout (sec) | The maximum time ObserveOps waits for a response. Default is 60 seconds. |
| Port | The port ObserveOps uses to connect. Default is 443. |
| Source Time Zone | The time zone of the source server. |
After you click Add Source, ObserveOps starts pulling logs from the cloud provider using the configured plugin.
TCP/UDP sources receive logs sent directly over TCP or UDP to ObserveOps.
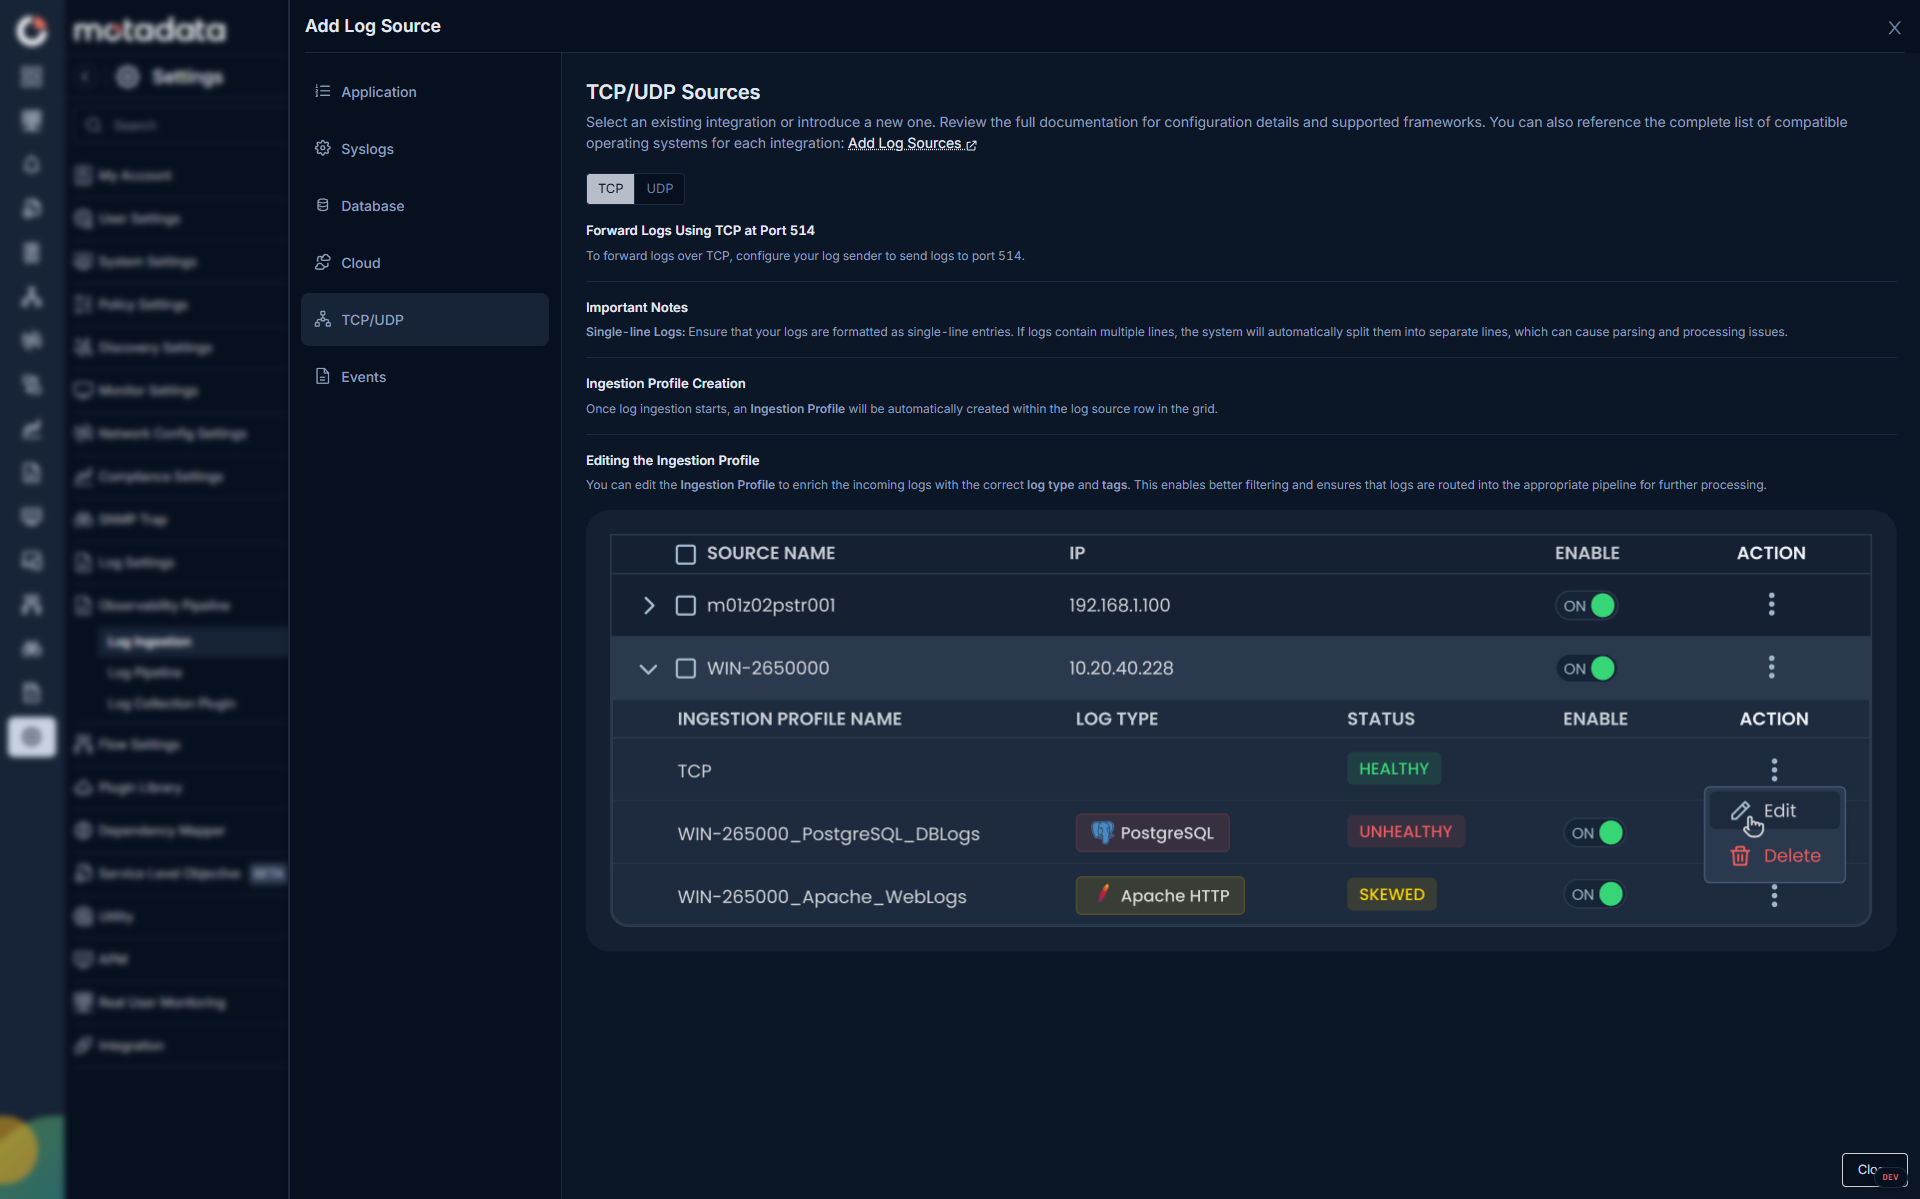
You can follow the exact instructions available on the screen.
Event sources collect Windows Events, vCenter events, Cisco events, and others — either through MotaAgent or directly without an agent.
Agent Based:
Motadata supports comprehensive agent based log ingestion for Windows events.
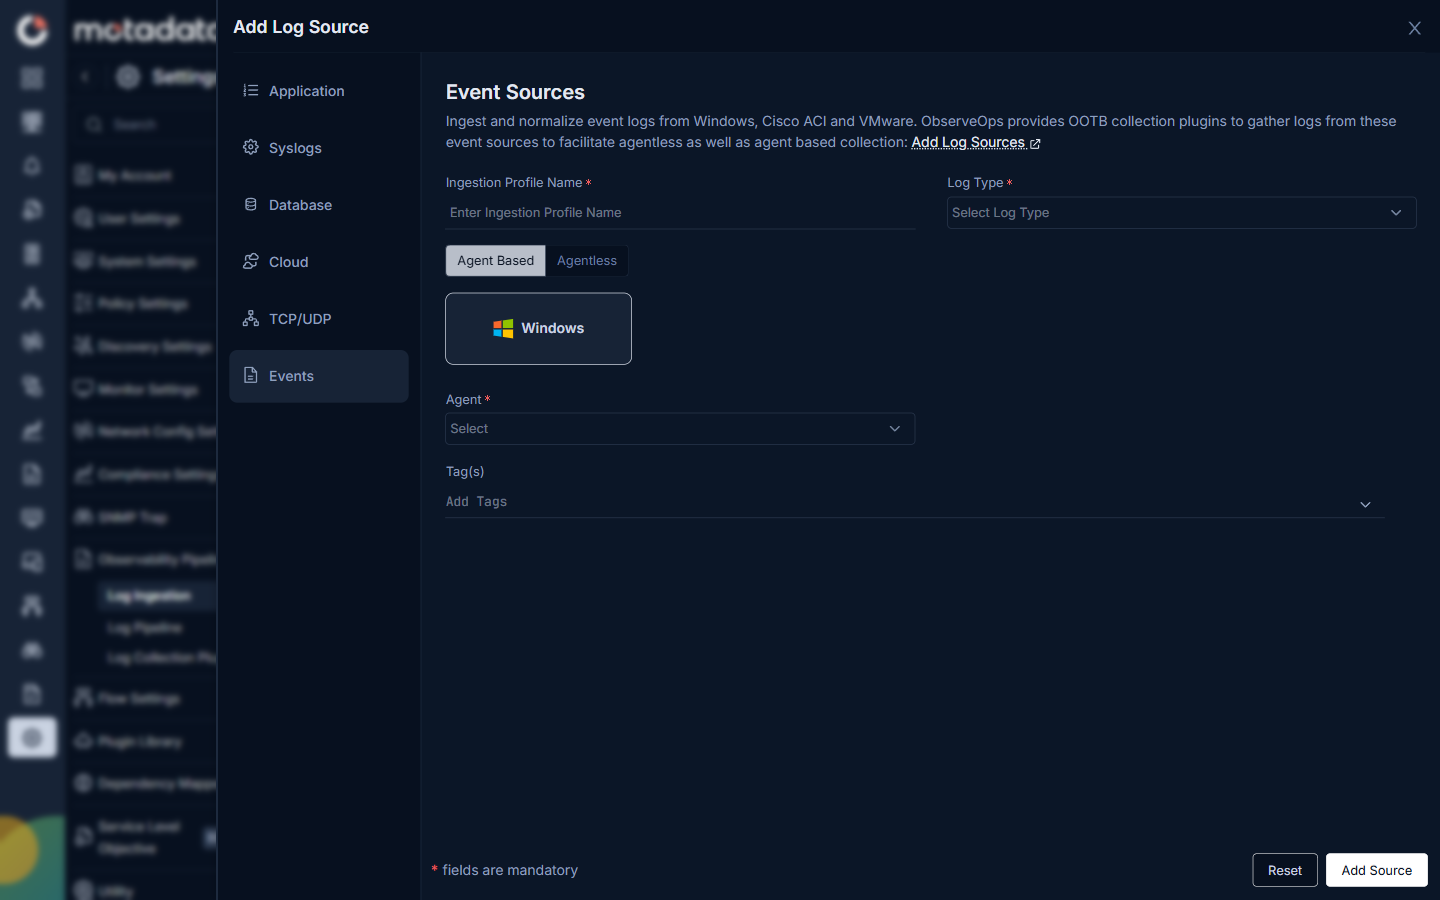
Select the MotaAgent installed on the source. Add any tags you want attached to logs from this source.
Agent Based field:
| Field | Description |
|---|---|
| Agent | The MotaAgent installed on the host where events originate |
| Tag(s) | Optional tags to attach to all events from this source |
Agentless:
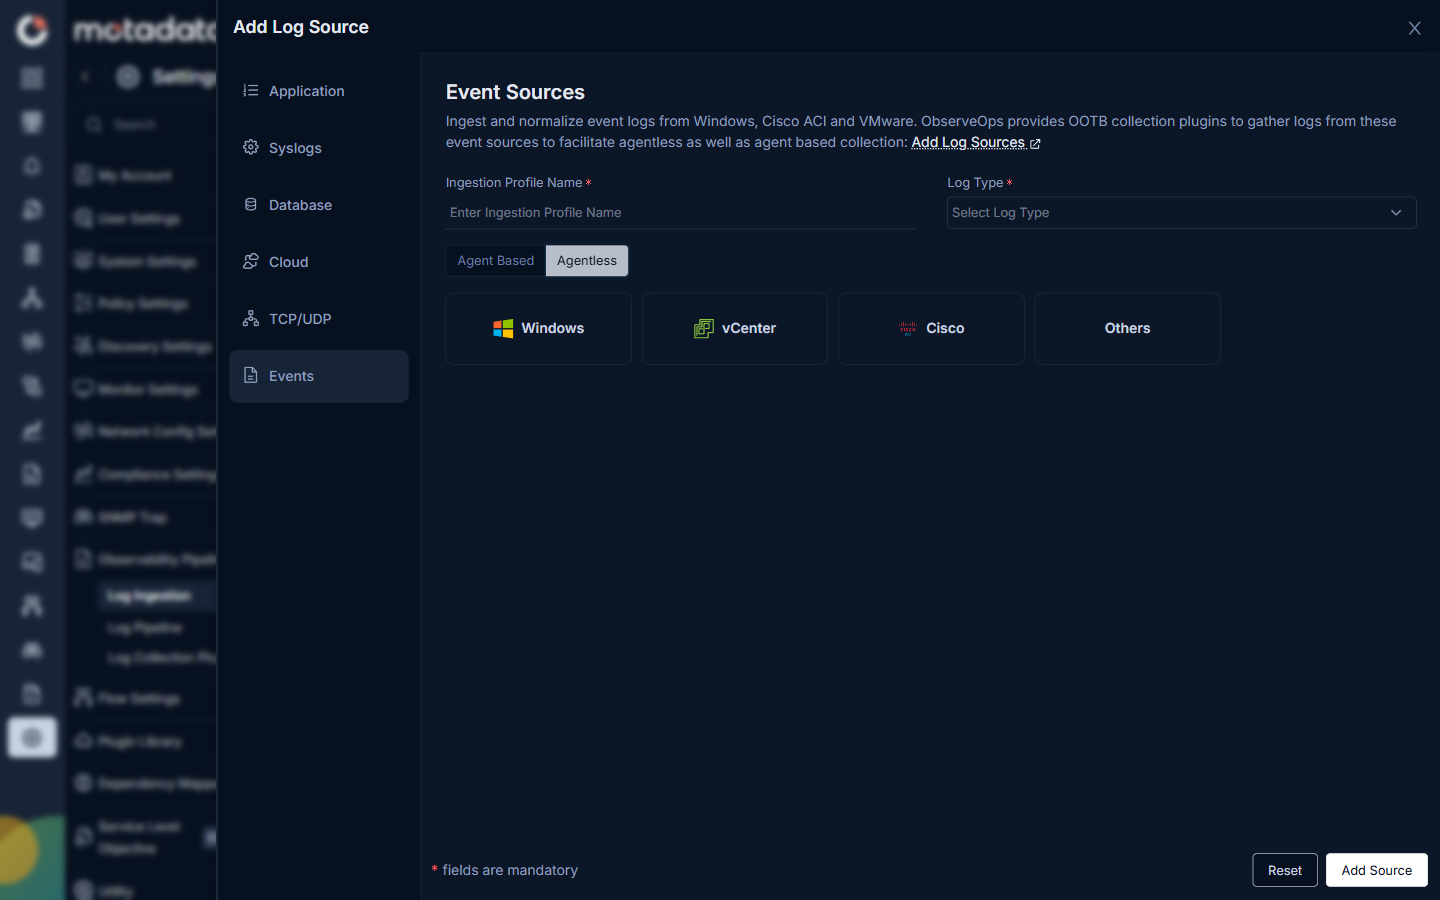
Click a card to configure the agentless connection for that source type. ObserveOps connects directly to the source using a Log Collection Plugin and a credential profile. No agent installation is needed on the target.
Windows
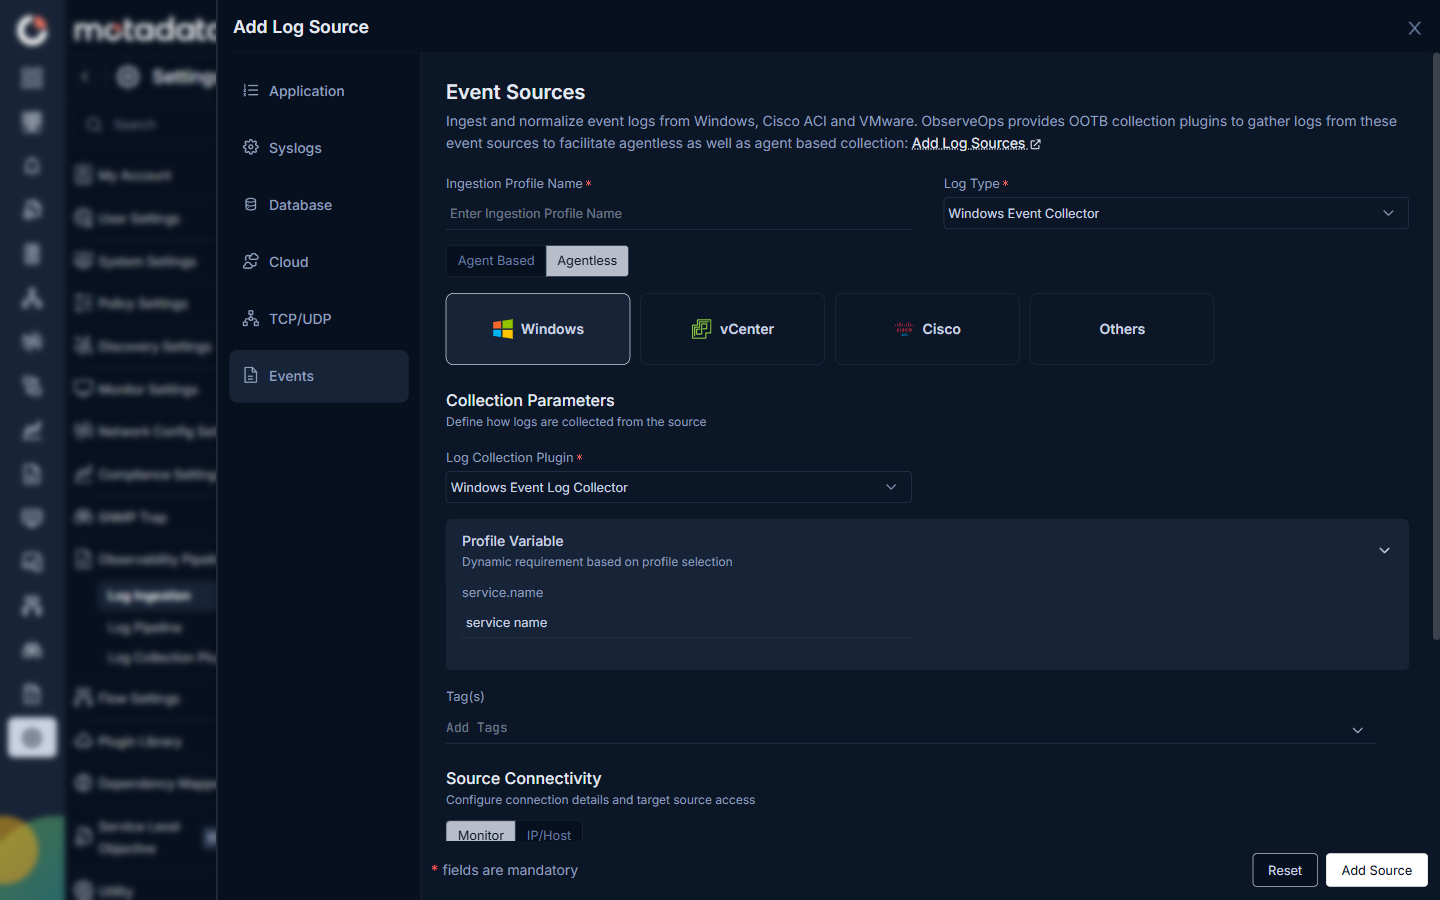
ObserveOps uses the Windows Event Log Collector plugin to collect Windows Event logs without installing an agent on the source.
| Field | Description |
|---|---|
| Log Collection Plugin | Preset to Windows Event Log Collector. |
| service.name | The Windows service name to scope event collection. Enter the value in the Profile Variable section to filter events by service. |
| Tag(s) | Optional tags to attach to every event collected from this source. |
| Source Connectivity | Select Monitor to pick a Windows host already monitored in ObserveOps, or select IP/Host to enter the IP address or hostname directly. |
vCenter
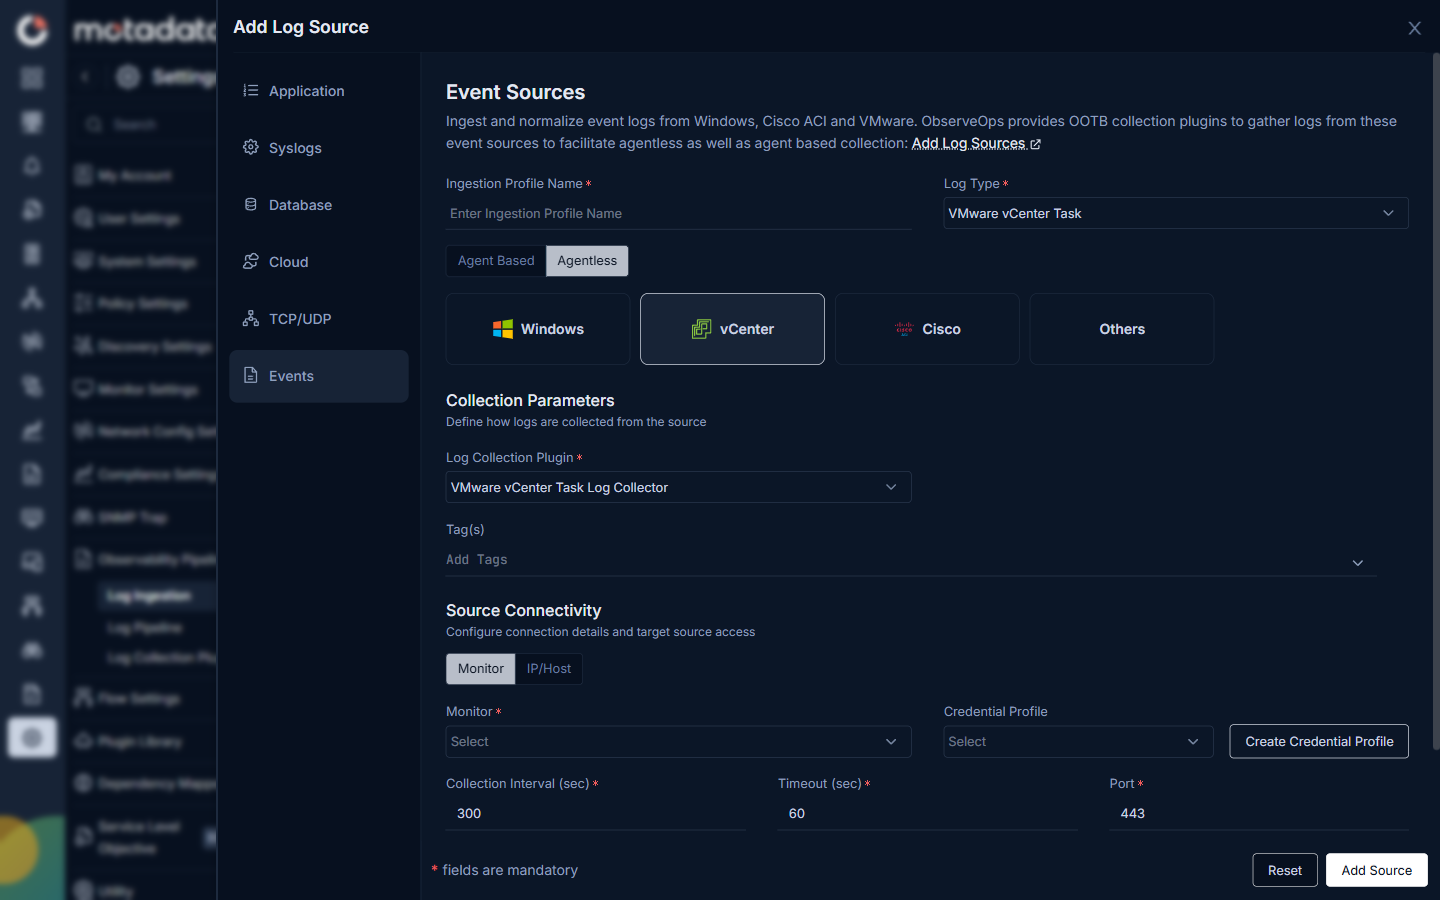
ObserveOps uses the VMware vCenter Task Log Collector plugin to pull task and event logs from vCenter.
| Field | Description |
|---|---|
| Log Collection Plugin | Preset to VMware vCenter Task Log Collector. |
| Tag(s) | Optional tags to attach to every event collected from this source. |
| Monitor | Select the vCenter host from the list of monitored devices. ObserveOps uses this to identify which vCenter server to connect to. |
| Credential Profile | The credential profile with read access to the vCenter API. Click Create Credential Profile to add one if none exists. |
| Collection Interval (sec) | How often ObserveOps polls vCenter for new events. Default is 300 seconds. |
| Timeout (sec) | The maximum time ObserveOps waits for a response from vCenter. Default is 60 seconds. |
| Port | The port ObserveOps uses to connect to vCenter. Default is 443. |
Cisco
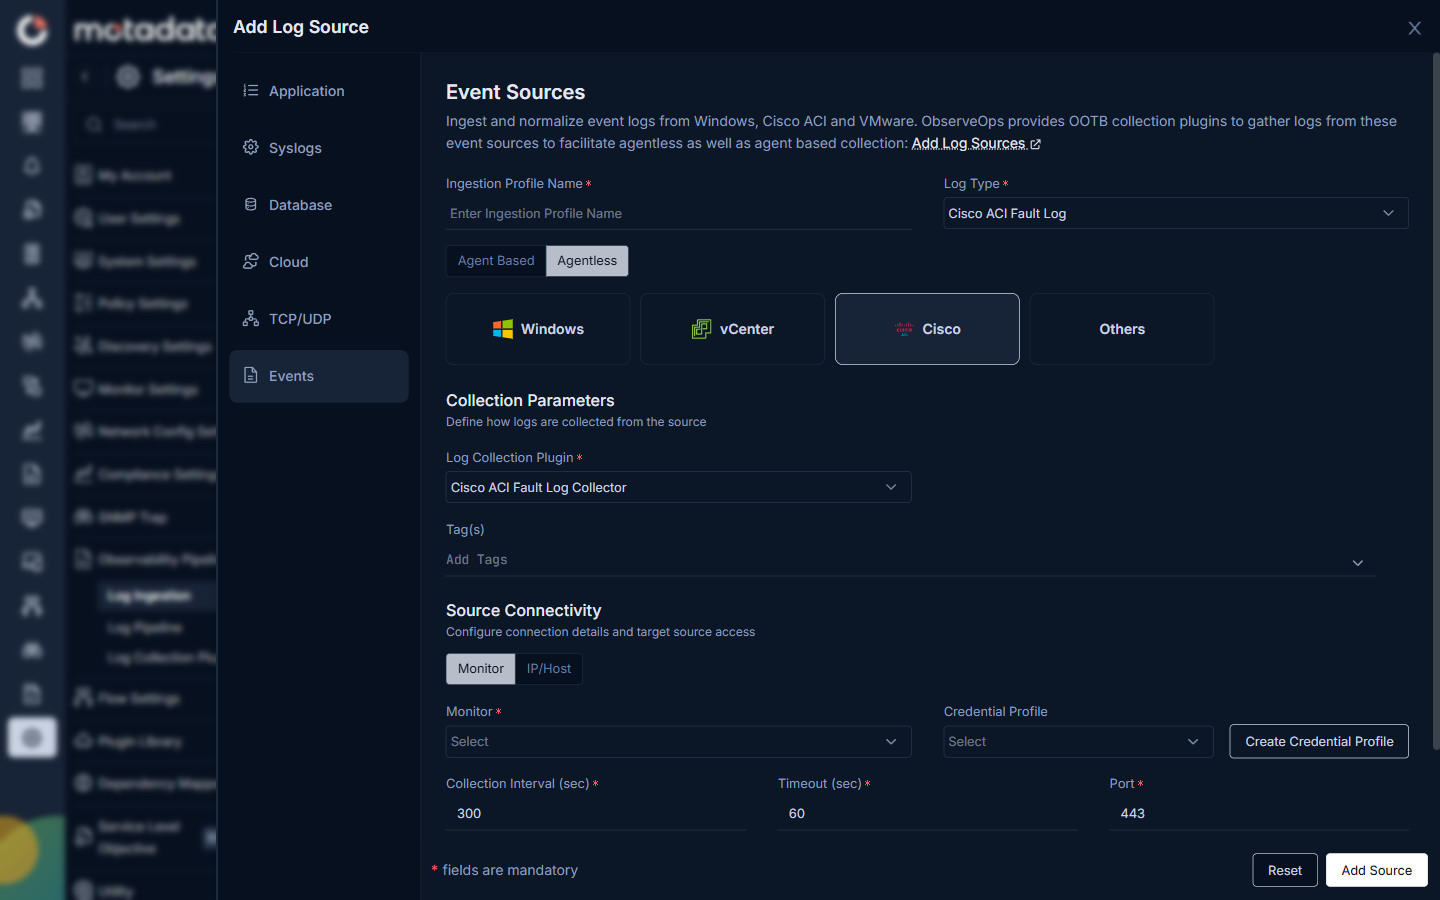
ObserveOps uses the Cisco ACI Fault Log Collector plugin to pull fault logs from Cisco ACI devices.
| Field | Description |
|---|---|
| Log Collection Plugin | Preset to Cisco ACI Fault Log Collector. |
| Tag(s) | Optional tags to attach to every event collected from this source. |
| Monitor | Select the Cisco ACI device from the list of monitored devices. |
| Credential Profile | The credential profile with access to the Cisco ACI device. Click Create Credential Profile to add one if none exists. |
| Collection Interval (sec) | How often ObserveOps polls the device for new fault events. Default is 300 seconds. |
| Timeout (sec) | The maximum time ObserveOps waits for a response from the device. Default is 60 seconds. |
| Port | The port ObserveOps uses to connect. Default is 443. |
Others
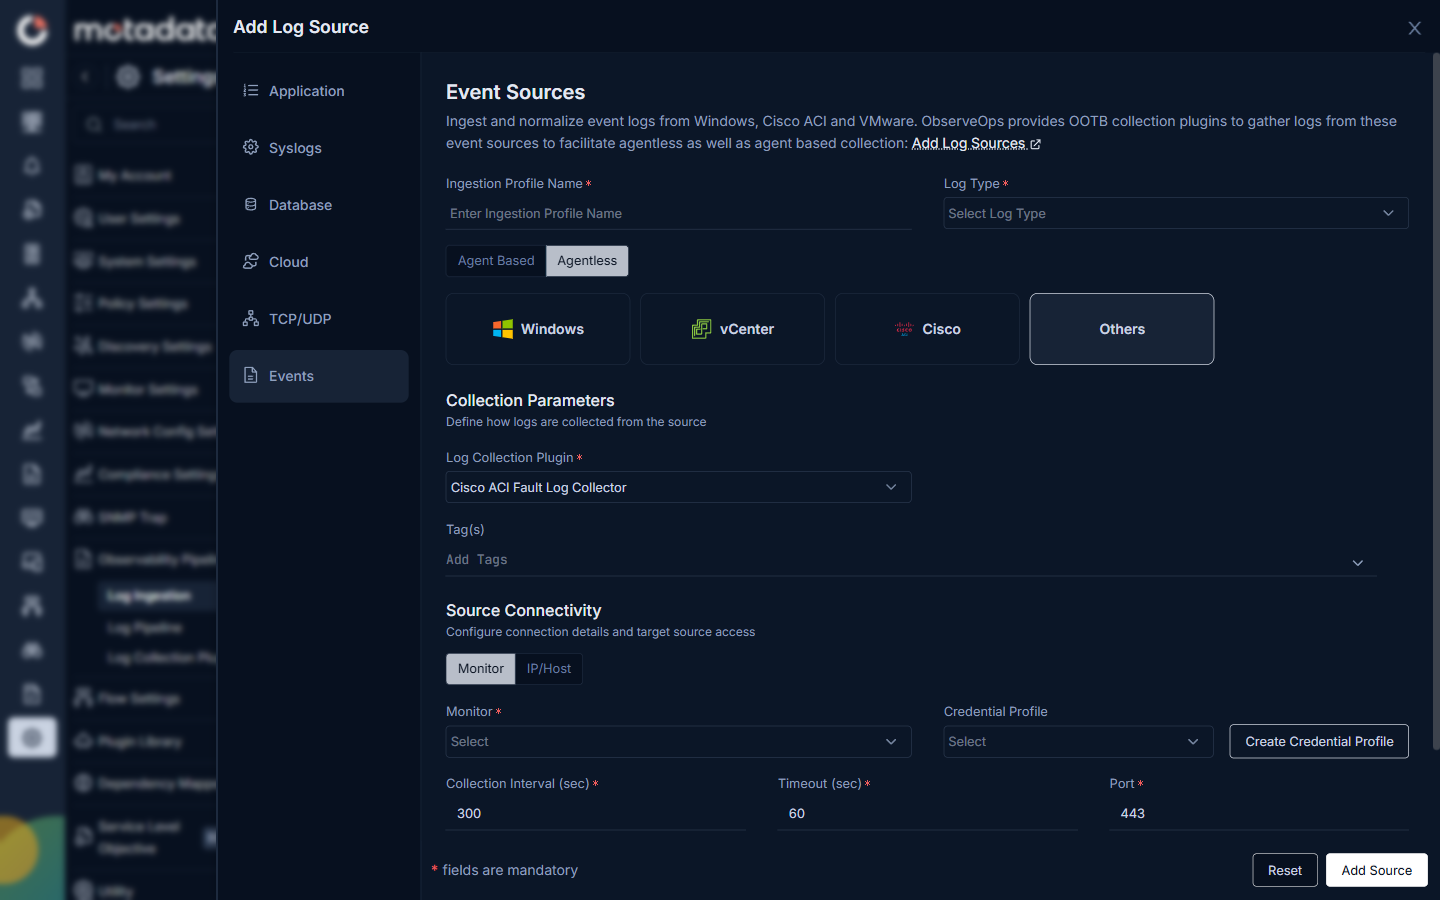
Use this option to collect events from a source that is not listed above. Select a Log Collection Plugin that matches your event source.
| Field | Description |
|---|---|
| Log Collection Plugin | Select the plugin that matches your custom event source. ObserveOps uses this plugin to define how it connects and collects events. |
| Tag(s) | Optional tags to attach to every event collected from this source. |
| Monitor | Select the device from the list of monitored devices. |
| Credential Profile | The credential profile with access to the event source. Click Create Credential Profile to add one if none exists. |
| Collection Interval (sec) | How often ObserveOps polls the source for new events. Default is 300 seconds. |
| Timeout (sec) | The maximum time ObserveOps waits for a response. Default is 60 seconds. |
| Port | The port ObserveOps uses to connect. Default is 443. |
After you click Add Source, ObserveOps begins collecting events from the configured source.
-->