Geo Map
Overview
Once the Geo Map integration is configured under Settings → Integration → Geo Map, the interactive map is available directly from the ObserveOps main menu. The Geo Map plots monitored devices, log sources, and network-flow endpoints on a geographical map so operations teams can see where infrastructure is deployed, focus on a region, and drill down to specific assets.
Navigation
Go to Menu. Select Geo Map  . The Geo Map screen is displayed with all monitored devices and assets plotted on the map.
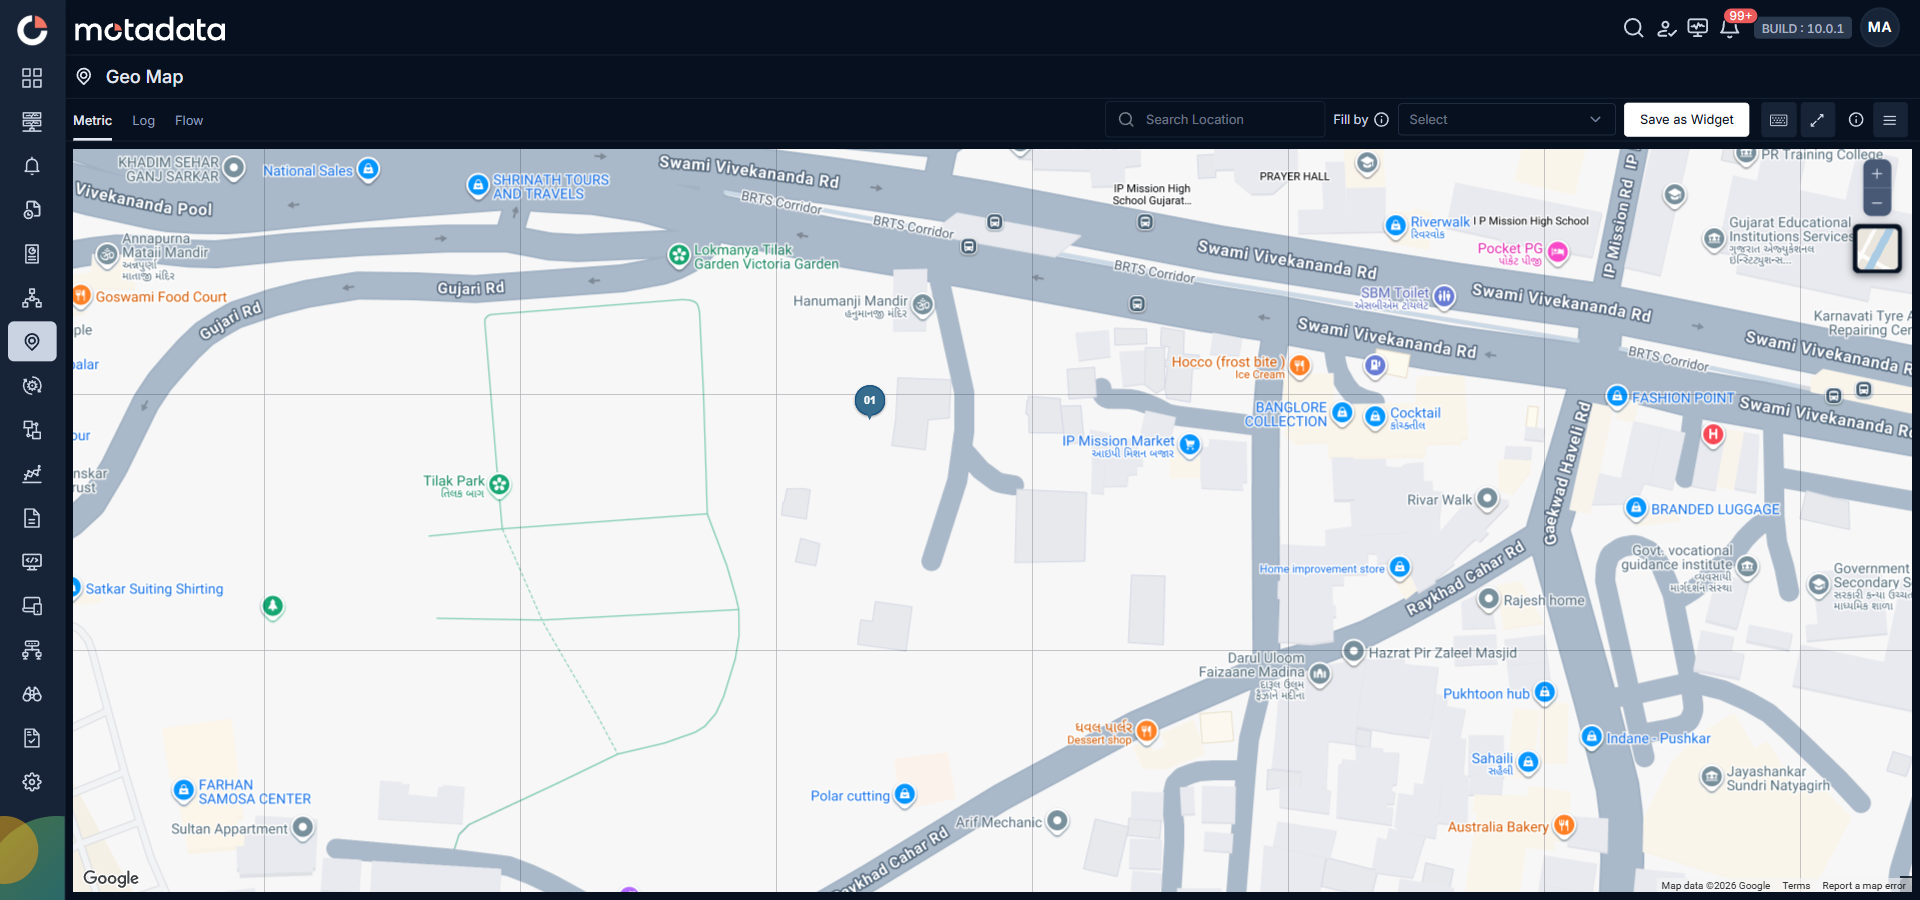
Geo Map UI Elements
The Geo Map screen has a header row with data-source tabs and controls, and an interactive map canvas that fills the rest of the screen. Each element is explained below.
Data Source Tabs (Metric, Log, Flow)
Located at the top-left of the screen. Switch between the three data sources plotted on the map:
- Metric: Monitored devices and assets that have metric data. This is the default tab. Each device is placed on the map using its configured location metadata.
- Log: Log-source locations. Sources that send logs into ObserveOps are plotted so you can see the log-collection geography.
- Flow: Network-flow endpoints. Source and destination IPs from the flow explorer are plotted, useful for spotting geographic anomalies.
Only one tab is active at a time. Switching a tab reloads the map with markers from that data source.
Search Location
Text field at the top-center of the header. Type a location, address, city, or place name.
- With Google Map configured, address autocomplete suggestions appear as you type (Places API). Select a suggestion to pan and zoom to that location.
- With Open Street Map configured, the search performs a location lookup using OSM's Nominatim service (autocomplete is limited).
Filter By
Dropdown next to the search box. Narrows the visible markers by attributes such as:
- Monitor Category: for example, Server, Network, or Storage.
- Status: Clear, Warning, Critical, Down, or Unreachable.
- Group: user-defined groups the monitor belongs to.
- Tag: user-defined tags applied to the monitor.
Selecting one or more filters reduces the markers shown on the map to only those matching the filter set.
Time Range Selector
Located in the top-right corner of the screen. Controls the time window for the data displayed on the map. Options include 1 hour, 6 hours, 12 hours, 1 day, 7 days, 30 days and a custom range picker.
If the map appears empty for the default time range (for example, no metric data for the last 1 hour), switch to a wider range such as 7 days or 30 days to see historic device presence. This is the most common cause of a blank Geo Map.
Save as Widget
Button in the top-right area. Saves the current Geo Map view, including the active tab, filter selection, and time range, as a reusable widget. The saved widget can then be added to any ObserveOps dashboard for at-a-glance geographic monitoring.
Map Canvas
The interactive map area that fills the rest of the screen. Rendered by the selected map provider (Open Street Map or Google Map). Devices, sites, and assets are drawn on top of the map as colored markers.
Device Marker
Each marker on the map represents a single monitored device, log source, or flow endpoint. The marker color reflects the health status (for example, green for Clear, red for Down).
Click a marker to open a tooltip / side panel showing:
- Device / monitor name
- IP address / host name
- Current status
- Monitor group and tags
- A direct link to the monitor detail page
Marker Cluster
When multiple devices are geographically close, they are grouped into a cluster with a count badge (for example, 8). Clusters keep the map readable at zoomed-out levels.
- Click a cluster to zoom in and expand into its individual markers.
- Cluster color reflects the worst status among grouped devices.
Zoom Controls
On-screen + / − buttons at the bottom-right of the map. Use them to zoom in or out. You can also:
- Use the mouse wheel to zoom in / out.
- Click and drag the map to pan across regions.
- Double-click a location to zoom in on it.
Fullscreen Toggle
Button that expands the Geo Map to fill the entire browser window for a distraction-free operations view. Click again (or press Esc) to exit fullscreen.
Typical Workflows
Locate an at-risk site
- Open Menu → Geo Map.
- On the Metric tab, set Filter By → Status → Critical, Down.
- Use the Time Range on the top-right to widen or narrow the observation window.
- Zoom into the region with red markers, click a cluster to expand, and click a marker to jump to the affected monitor.
Add a Geo Map view to a dashboard
- Configure the tabs, filters, and time range that reflect what your team needs to see.
- Click Save as Widget in the top-right.
- Open the target dashboard, add the widget, and save.
Search for a specific site
- Type the site address / city name in the Search Location field.
- Select the autocomplete suggestion (Google Map) or the search result (Open Street Map).
- The map pans and zooms to the location. Any monitors within the view are shown as markers.
Troubleshooting
If the Geo Map appears blank, the map tiles do not load, or search does not work:
- Confirm the API key is saved correctly at Settings → Integration → Geo Map (for Google Map).
- Verify that the required Google APIs (Maps JavaScript, Places, Geocoding, Geolocation) are enabled in your Google Cloud project.
- Verify that the API key's Application restrictions allow the ObserveOps deployment URL (or are set to None for initial validation).
- Confirm outbound HTTPS (
TCP 443) connectivity from the ObserveOps server to Google API endpoints (for Google Map) or to OSM tile servers (for Open Street Map). - Change the Time Range in the top-right corner to a wider window (7 days / 30 days) to check if historic data appears.
- Verify that the monitored devices have valid location metadata (latitude and longitude). Devices without location cannot be plotted on the map.
- If only some markers appear, check Filter By. A stale filter may be hiding devices.
Related Topics
- Configuring Geo Map Integration: how to set the map provider (Open Street Map or Google Map) and paste the API key in Motadata.
- Generating the Google Maps API Key: end-to-end SOP for generating and restricting the Google Maps Platform key.