Vulnerability Dashboard
The Vulnerability Dashboard in ServiceOps ships pre-configured with six KPI cards and three chart widgets. It activates automatically when you enable the Vulnerability license. Your team gets immediate security visibility from day one without building a single widget manually.
Prerequisites
Before you access the Vulnerability Dashboard, ensure:
- You have the Vulnerability Manager or Vulnerability Specialist Technician role, or View Dashboard is enabled on your role under Admin > Users > Roles
- A Vulnerability license is active in ServiceOps
- At least one endpoint is enrolled and at least one vulnerability scan has completed. All KPI counts show zero until the first scan runs.
- To create or edit custom KPIs and widgets, Manage Dashboard must also be enabled on your role
How Does the Vulnerability Dashboard Work?
The Vulnerability Dashboard is an out-of-the-box dashboard created automatically when the Vulnerability license activates. It pulls live data from the same scan results that appear on the Vulnerabilities and Vulnerability Endpoints list pages. There's no separate data pipeline.
KPI cards count records matching their configured condition at the moment you load or refresh the dashboard. Widgets render charts from the same data using the configured view type, conditions, and axis settings.
You can also create custom KPI cards and widgets using the standard ServiceOps dashboard builder. The Vulnerability module is available as a view type in both builders alongside your existing ITSM modules.
Vulnerability Dashboard Screen
Navigate to Dashboards > Vulnerability Dashboard.
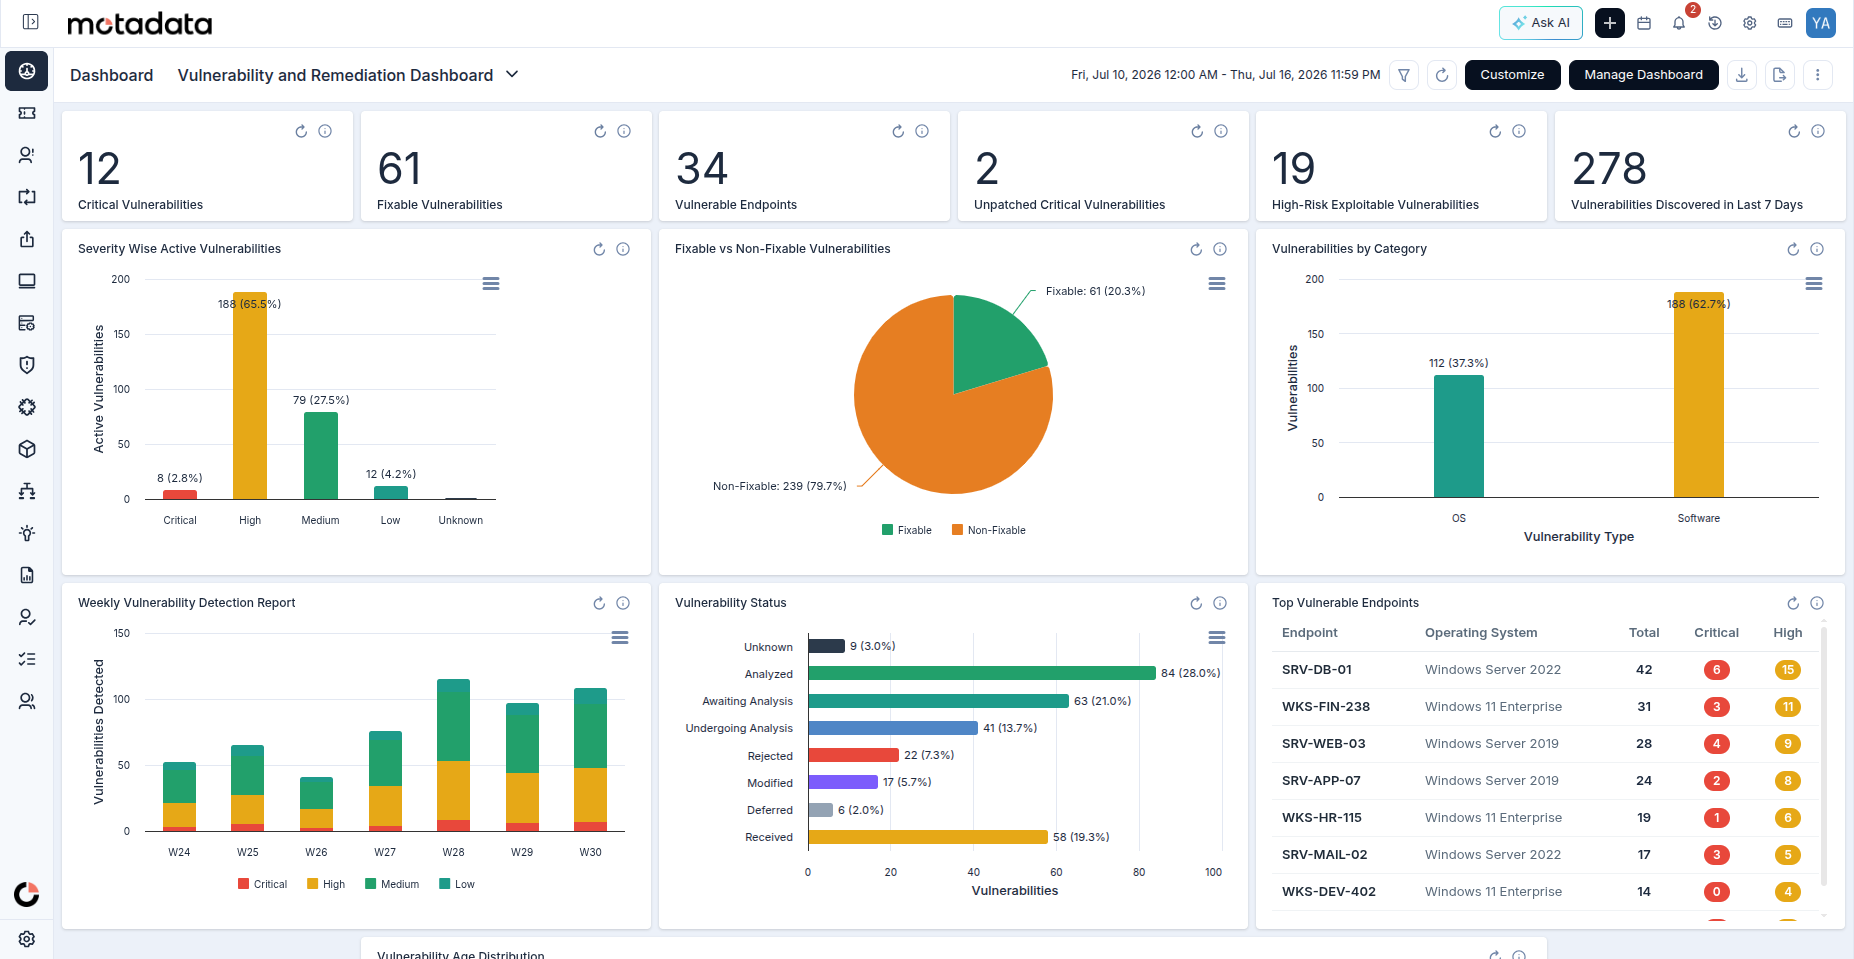
The screen shows these out-of-the-box KPI cards:
| KPI Card | Condition | What it counts |
|---|---|---|
| Critical Vulnerabilities | Severity = Critical | CVEs with Critical severity |
| Fixable Vulnerabilities | Patch Availability = Yes | CVEs with a remediation patch available |
| Vulnerable Endpoints | Total Vulnerabilities > 0 | Enrolled endpoints with at least one active CVE |
| Unpatched Critical Vulnerabilities | Severity = Critical AND Patch Status = Unpatched | Critical CVEs that have not yet been patched |
| High-Risk Exploitable Vulnerabilities | Exploit Status = Exploitable AND Severity = High or Critical | CVEs that are actively exploitable and pose high risk |
| Vulnerabilities Discovered in Last 7 Days | Discovered Date within last 7 days | New CVEs detected in the past week |
Configuration
To use the out-of-the-box widgets
The dashboard ships with three pre-configured chart widgets. They display automatically without any setup:
Severity Wise Active Vulnerabilities: A pie chart breaking down all CVEs by severity (Low, Medium, High, Critical, Unknown). Use it to see whether your exposure is concentrated at High or Critical and prioritise remediation accordingly.
Weekly Vulnerability Detection Report: A line chart showing total CVEs discovered each week, plotted by week number. Use it to spot spikes from vendor security bulletins or batch scan enrollments.
Fixable vs Non-Fixable Vulnerabilities: A pie chart comparing CVEs that have a patch available (Yes) against those that do not (No). Use it to gauge how much of your exposure can be closed through patching alone.
To create a custom KPI card or widget
Custom KPI cards and widgets follow the same steps as any other ServiceOps dashboard. See Creating a Dashboard for step-by-step instructions. The Vulnerability module is available as a view type in both builders, with Vulnerabilities and Endpoints as the supported view types.
Example
Your IT manager asks for a weekly security update. You open Dashboards > Vulnerability Dashboard before the Monday meeting. Critical Vulnerabilities shows 12 and Unpatched Critical Vulnerabilities shows 8, meaning most of the critical findings still have no patch applied. The Weekly Vulnerability Detection Report line chart shows a spike last Wednesday, which matches a vendor advisory that came out that day. You share the dashboard screenshot in the meeting and the team immediately prioritises the 8 unpatched critical findings for the week's remediation cycle.
Troubleshooting
Vulnerability Dashboard is not listed under Dashboards
Cause: The Vulnerability license is not active.
Fix: Verify the Vulnerability license under Admin > Account > Licenses. The Vulnerability Dashboard appears automatically once an active license is detected.
All KPI cards show zero
Cause: No scans have run yet, or no endpoints are enrolled.
Fix: Confirm endpoints are enrolled in Admin > Discovery and Agents > Endpoint Management. Go to Admin > Vulnerability Management > Vulnerability Settings and click Update Now to trigger the first scan.
A custom widget shows no data
Cause: The condition or time filter excludes all current records.
Fix: Open the widget editor, remove all conditions, and confirm data appears. Then re-apply conditions one at a time until you identify the one that filters out all results.
Cannot create or edit a KPI or widget
Cause: Manage Dashboard permission is not enabled on your role.
Fix: Ask an administrator to enable Manage Dashboard under Admin > Users > Roles.