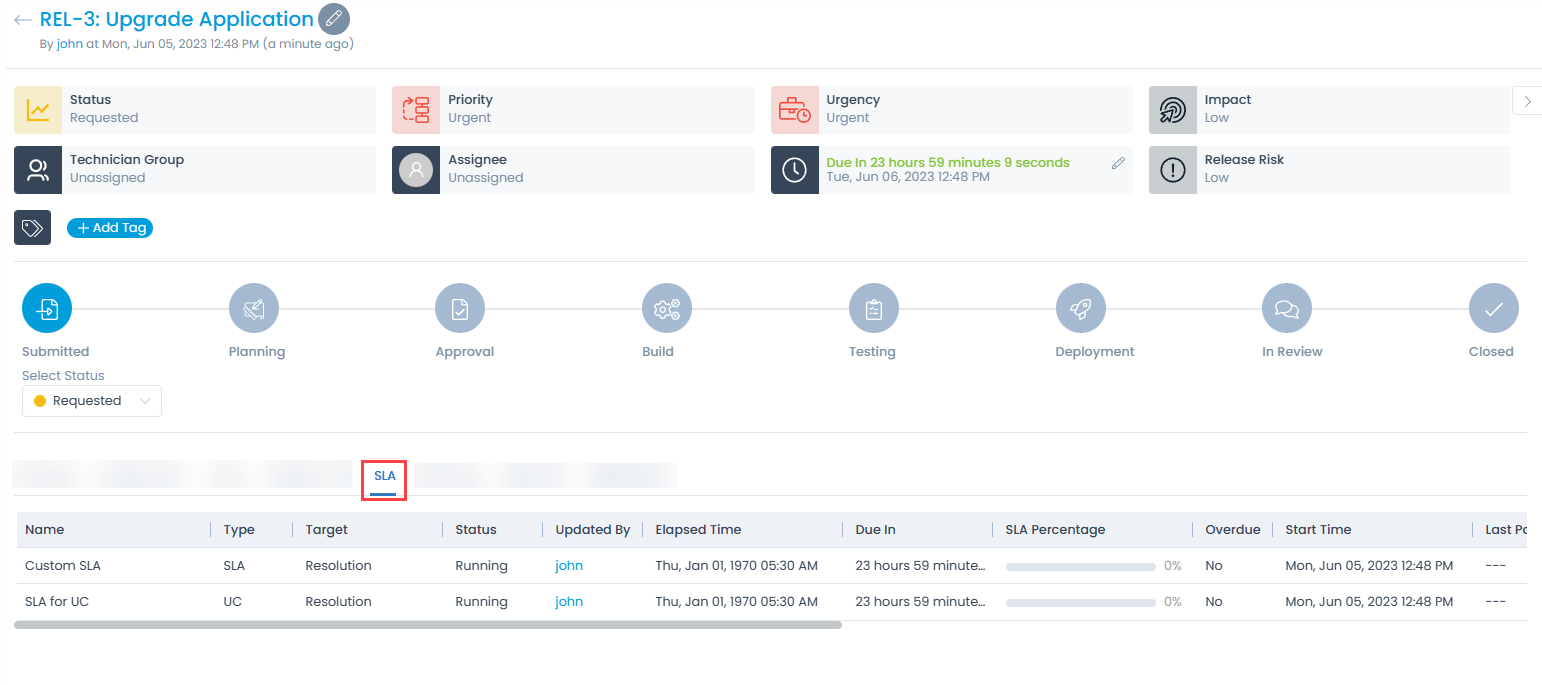
SLA
The SLA tab displays the history details of the all the SLAs and UCs applied to the tickets. It displays details like name, type, target, status, updated by, elapsed time, due in, SLA percentage, overdue, start time, last pause time, stop time, pause duration, breached duration, technician group, Operational Hours Type, and Update Count.

| Parameters | Description |
|---|---|
| Name | Displays name of the currently applied SLA or UC. |
| Type | Displays the type of the currently applied SLA i.e. SLA or UC. |
| Target | Displays the target of the currently applied SLA or UC. If Response timer is applied, First Response will be displayed. If Resolution time is applied, Resolution will be displayed. |
| Status | Displays the current status of the applied SLA and UC. The possible values are: - Running: Appears when the SLA/UC timer is currently running. - Achieved: Appears when the ticket is resolved or closed or assigned to someone within the defined response or resolution duration. - Breached: This appears when the SLA/UC is running even after the defined duration. - Cancelled: This appears when a new SLA/UC is applied while the existing SLA/UC is already running - Paused: This appears when the SLA/UC timer is running and the ticket's status is changed in which the Run SLA or Run UC is disabled. |
| Updated By | Displays the username when the SLA is manually updated. If it is automatically updated by the system using SLA/UC, then System is displayed. |
| Elapsed time | Displays the total running duration of the SLA/UC based on the assigned operation hour type. |
| Due In | Displays the remaining time of SLA/UC. |
| SLA Percentage | Displays the percentage based on the elapsed time. - If the elapsed time is <= to the total SLA/UC configured duration, the value will be between 0-100% - If the elapsed time > total SLA/UC configured duration, the value will be more than 100%. - Green color is displayed for value between 0-50%. - Yellow color is displayed for value between 51-75%. - Orange color is displayed for value between 76-100%. - Red color is displayed for value greater than 100%. |
| Overdue | Displays whether the SLA/UC is breached. |
| Start Time | Displays the start time when the SLA/UC was applied to the ticket. |
| Last Pause Time | Displays the time when the SLA/UC timer is paused based on the Run SLA or Run UC flag from the Request Status page. |
| Stop Time | Displays the time when the SLA/UC was stopped or cancelled for the ticket. |
| Pause Duration | Displays the total pause duration of SLA/UC. |
| Breached Duration | Displays the total breached duration of SLA/UC. |
| Penalty Amount | Displays the amount of penalty applied to the SLA/OLA/UC. |
| Technician Group | Displays the assigned technician group in case of OLA. |
| Operational Hours Type | Displays the assigned operational hours type. The values can be: Calendar Hours and Business Hours. |
| Update Count | Display the number of times the same SLA/UC is started, either first time or after pause. |