Common User Interface Elements in ObserveOps
ObserveOps includes a consistent set of interface elements across all modules. This page introduces the menus, controls, and display components you'll use throughout the platform.
Left Navigation
The left sidebar with six top-level items, module flyouts, Explorer pinning, the collapsible icon rail, and the Settings secondary sidebar is covered on its own page.
See Left Navigation for the complete reference.
Global Controls
Global controls (Search, NCCM Approval, Health Monitoring, Notification Bell, user avatar) live in the left sidebar header and footer. See Left Navigation for the full layout and behavior of these controls.
The on-page time selector (described in Controls > Filters and Time Selector below) is the one global control that stays on each page's content area rather than in the sidebar.
Controls
Filters and Time Selector
Use the time selector to adjust the time range of data displayed on any page. ObserveOps applies the selected range to all charts, tables, and counts on the current screen.
Click the time range control at the top right of any screen to open the time selector.
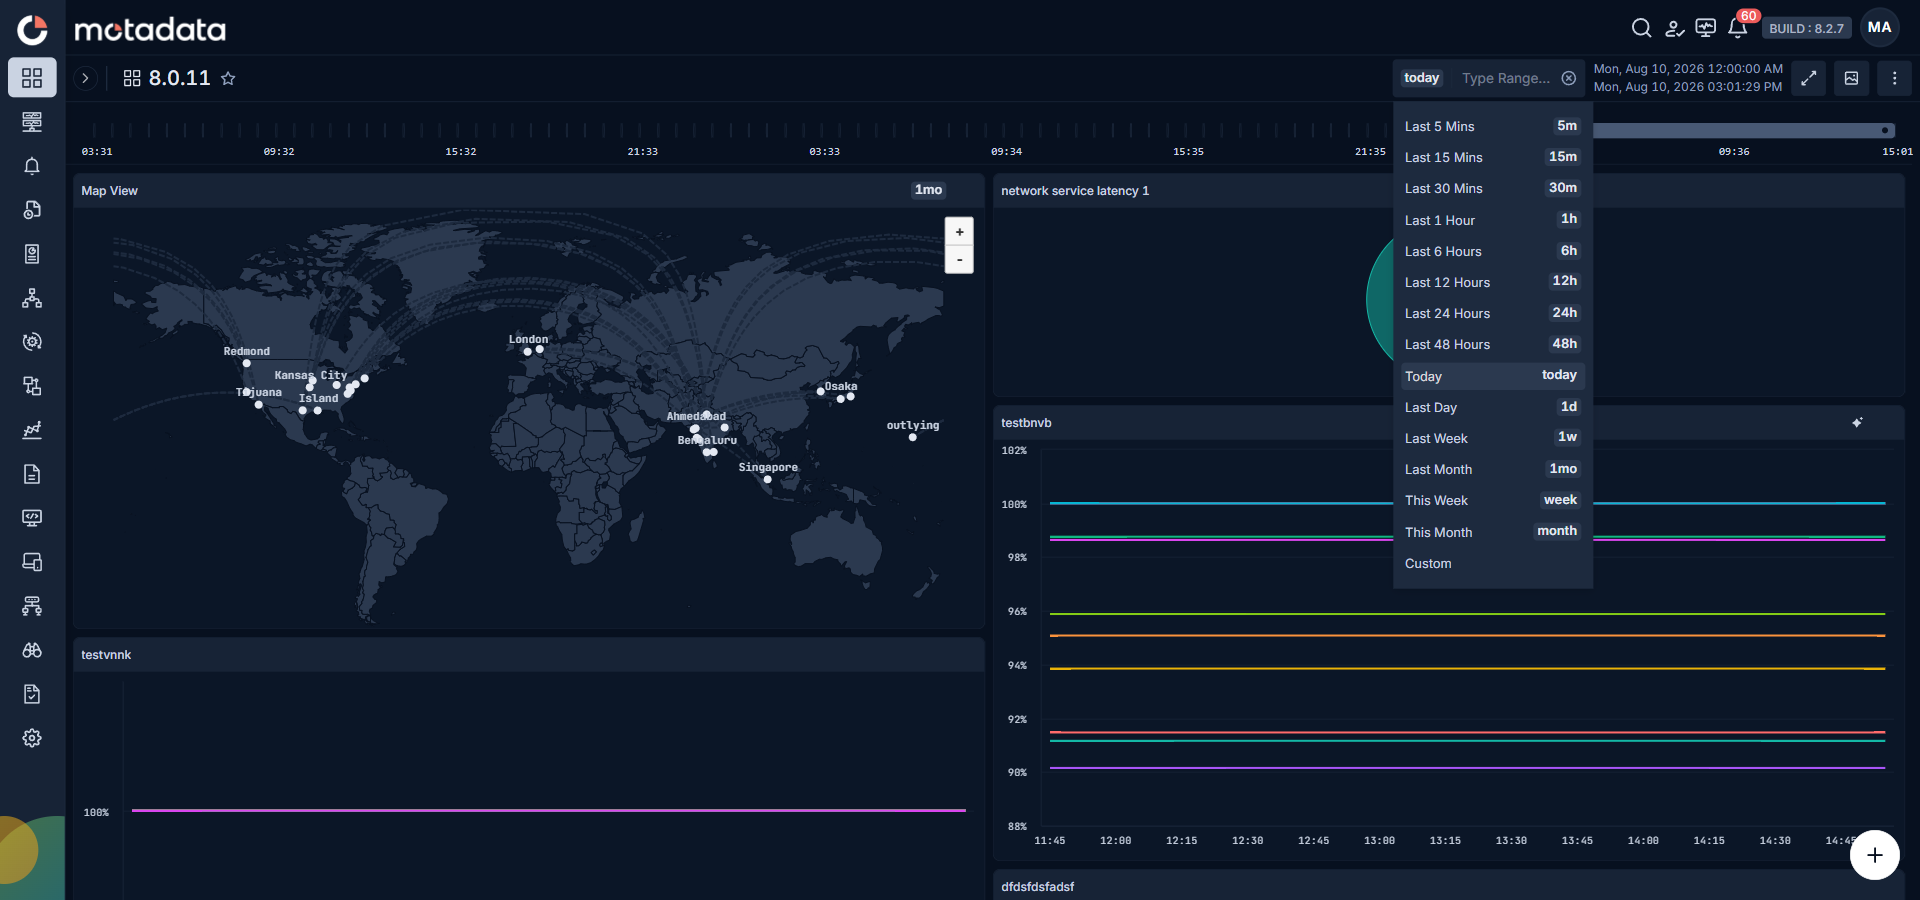
Available time ranges:
| Option | Range |
|---|---|
| Last 5 Mins | 5 minutes |
| Last 15 Mins | 15 minutes |
| Last 30 Mins | 30 minutes |
| Last 1 Hour | 1 hour |
| Last 6 Hours | 6 hours |
| Last 12 Hours | 12 hours |
| Last 24 Hours | 24 hours |
| Last 48 Hours | 48 hours |
| Today | From midnight today |
| Last Day | Previous 24-hour period |
| Last Week | Previous 7 days |
| Last Month | Previous 30 days |
| This Week | Current calendar week |
| This Month | Current calendar month |
| Custom | Set a specific start and end date and time |
Action Buttons
Action buttons let you create, edit, delete, or configure resources directly on the current page. You'll find them near the relevant sections so you don't need to navigate away.
Information Display
Dashboard
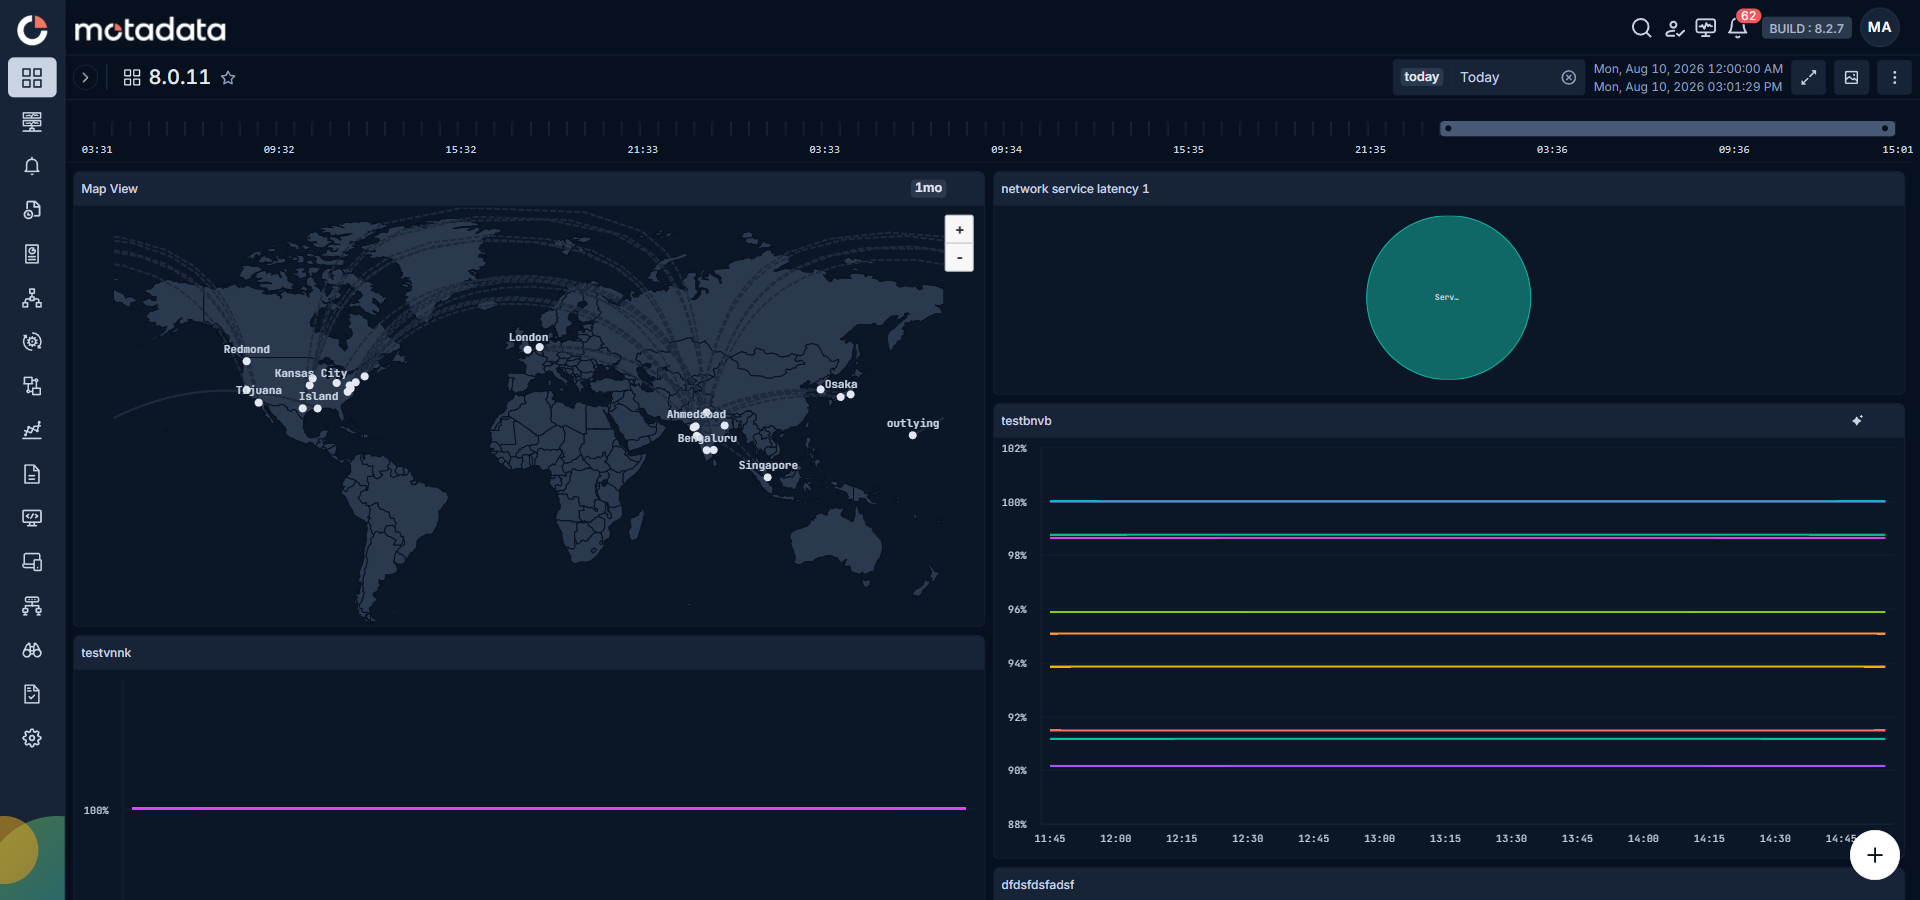
The Dashboard displays charts, graphs, and key metrics so you can see system performance at a glance. Use it to identify trends and monitor overall infrastructure health.
Notifications
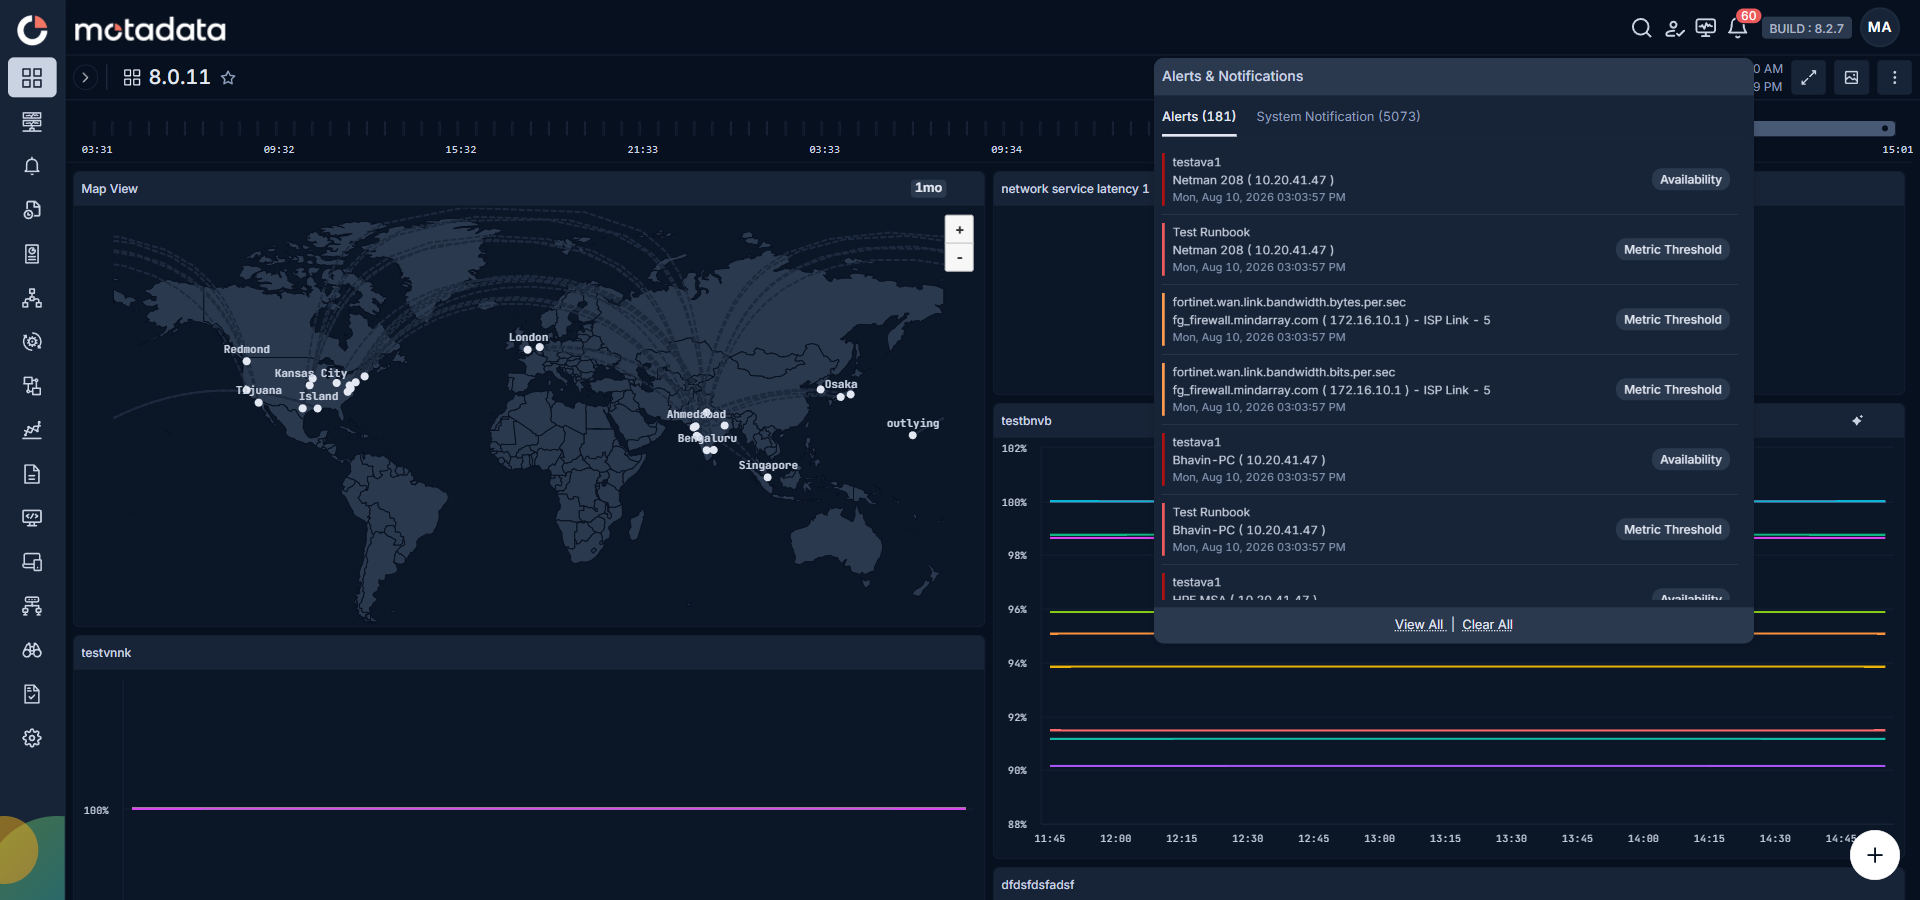
The notifications panel shows alerts, system updates, and messages that need your attention. It updates in real time as conditions in your infrastructure change.
Click the Notification Bell in the left sidebar footer to open the panel.
| Tab | What It Shows |
|---|---|
| Alerts | Active alert notifications across all monitors and policies. Each entry shows the monitor name, device, timestamp, and alert type. Select View All to open the full Alerts module. Select Clear All to dismiss all visible notifications. |
| System Notification | Platform-level events such as discovery completions, scheduled report runs, backup jobs, and configuration changes. |
Search Query
The Search panel lets you find monitor data and metrics from any screen and create dashboard widgets directly from a query result.
Click Search in the left sidebar header, or press Ctrl + K from anywhere, to open the search panel. Select the data type (Metric, Log, Flow, or Trap) from the dropdown, type your query, set a time range, and press Enter.
ObserveOps auto-suggests field names, metric names, and device values as you type.
Use Cases
Use Case 1 — Monitors with the highest CPU utilization percentage:
Use Case 2 — Top 10 Disk Volumes occupied across all monitors: