9.2.1. Getting to Know About Reports
Reports in Motadata are multi-dimensional, which means data can be shown in different ways. In Motadata, reports are of two types:
Pre-defined Reports
Custom Reports
We give forty one Reports out of the box, referred as Pre-defined Reports. These Reports are standard Reports commonly used by most of our users.
Custom Reports are user generated reports, and there’s no limit to the number of Reports a user can generate.
9.2.1.1. Folders for Managing Reports
All reports (both Pre-defined and Custom Reports) in the system are grouped into folders. There are 12 folders (based on the number of modules) of out of the box, but a user can create more folders.
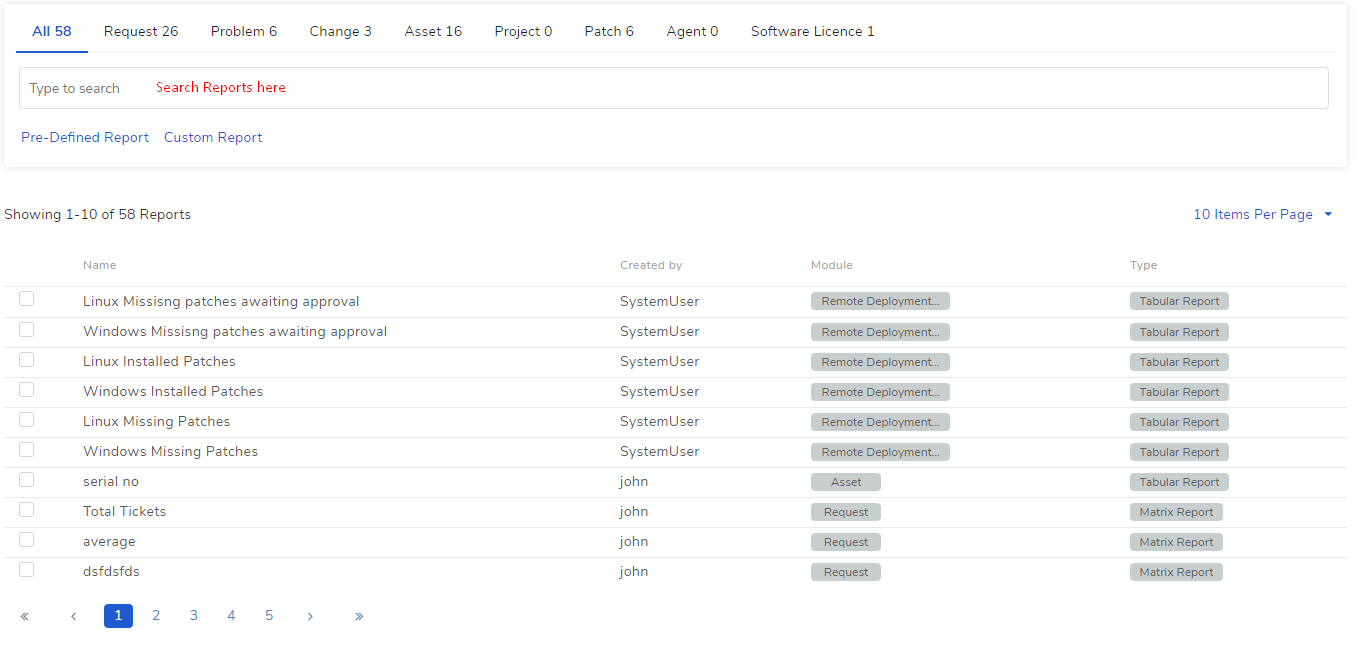
To view all the folders, a user has to go to Launcher >> Report (Report List View).
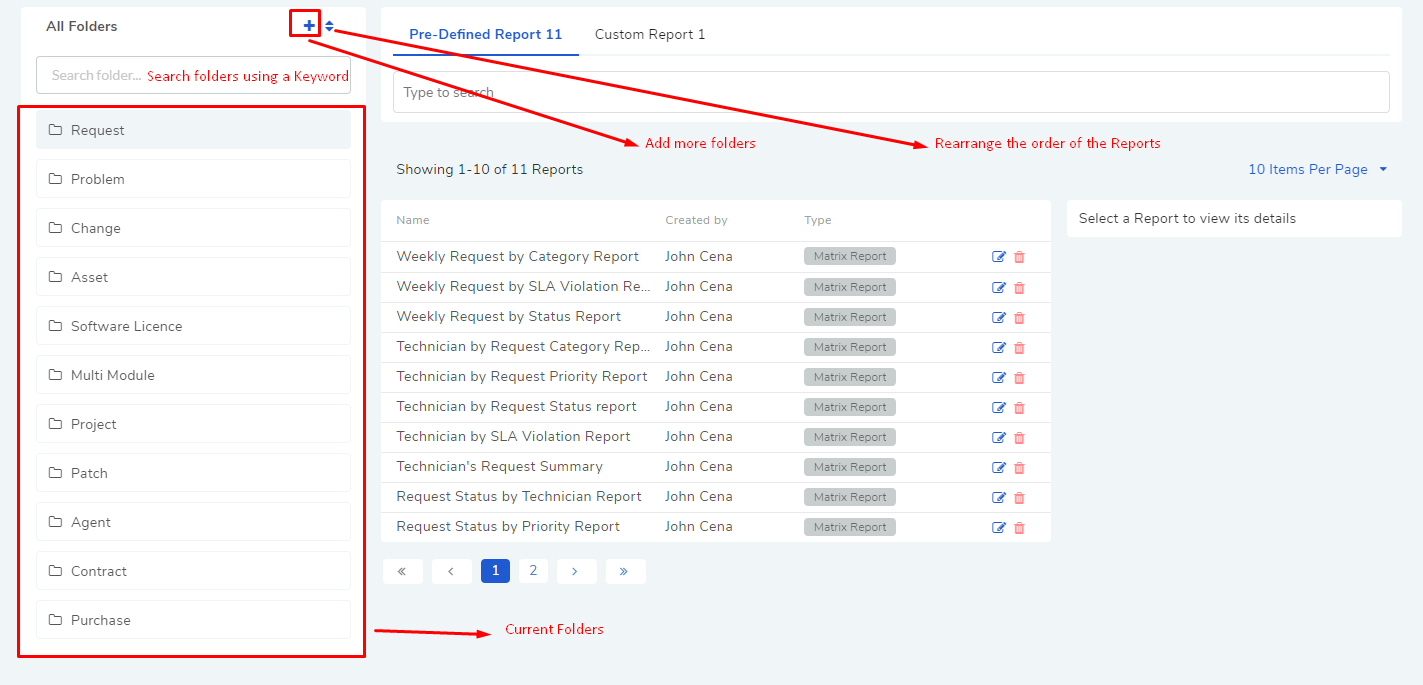
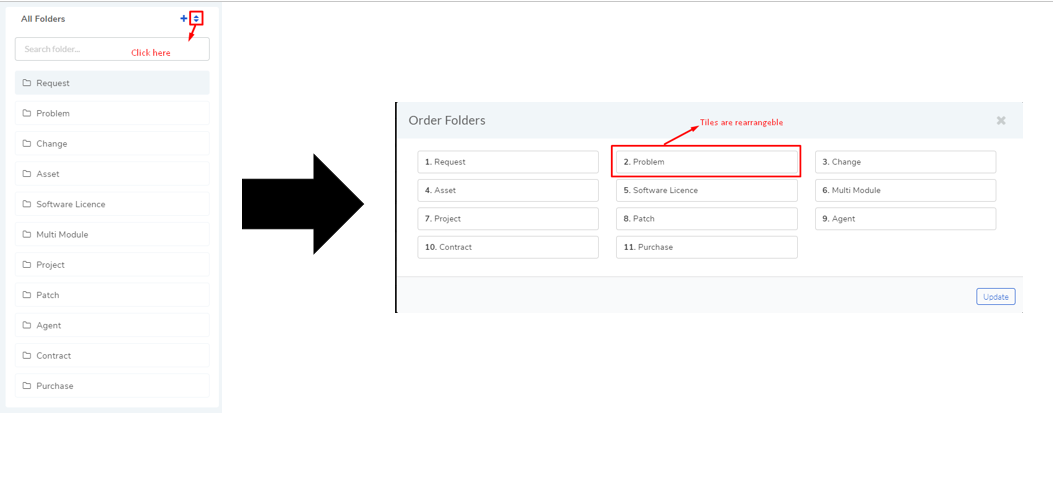
9.2.1.1.1. Rearranging Folders
A user can change the order of the Folders from the Report List View.
9.2.1.1.2. Trash Folder in Report
A user with the Manage Report Folder role can create and delete folders in Reports. When a folder is deleted, the content (Reports) of the folder is sent to the Trash folder.
Important
An individual Report deleted by the owner will not go to the Trash folder; it will be deleted permanently.
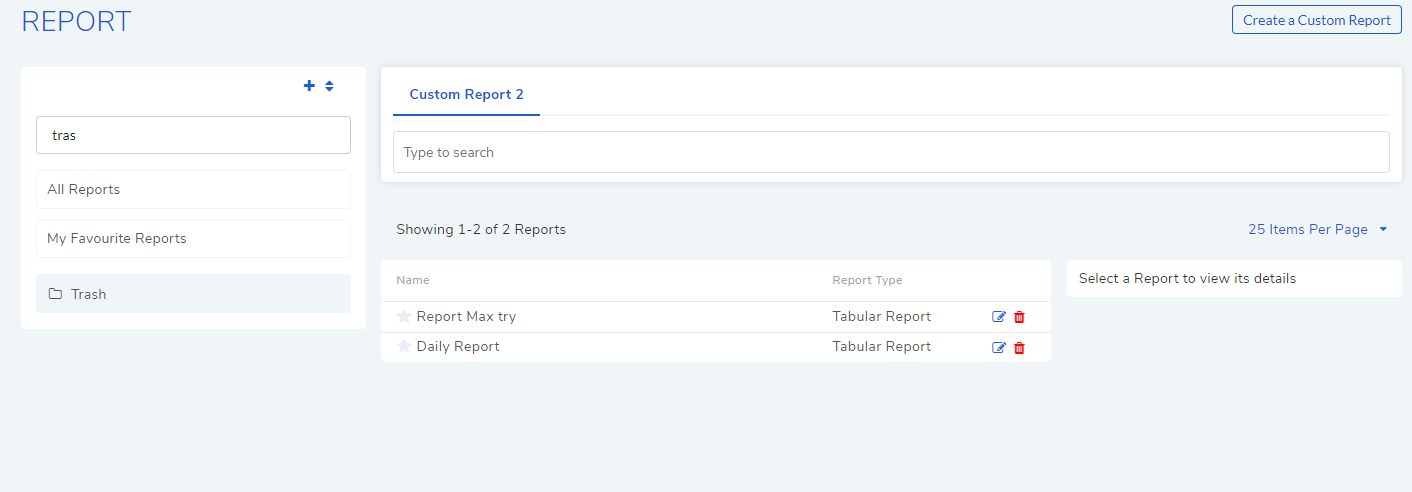
A user can open the Trash folder and view the following:
Trashed Reports which he/she is the owner.
Trashed Reports shared with the user.
Even in the Trash folder, only the owner can delete a Report.
9.2.1.2. Stages to Create a Custom Report
We have a standard interface to create reports across different modules.
All Custom Reports are created using the New Custom Reports page. Creating a Custom Report is a multi-stage process, which involves the following stages:
9.2.1.2.1. Create a Custom Report (Stage 1)
Log in to the Dashboard using the Technician Portal.
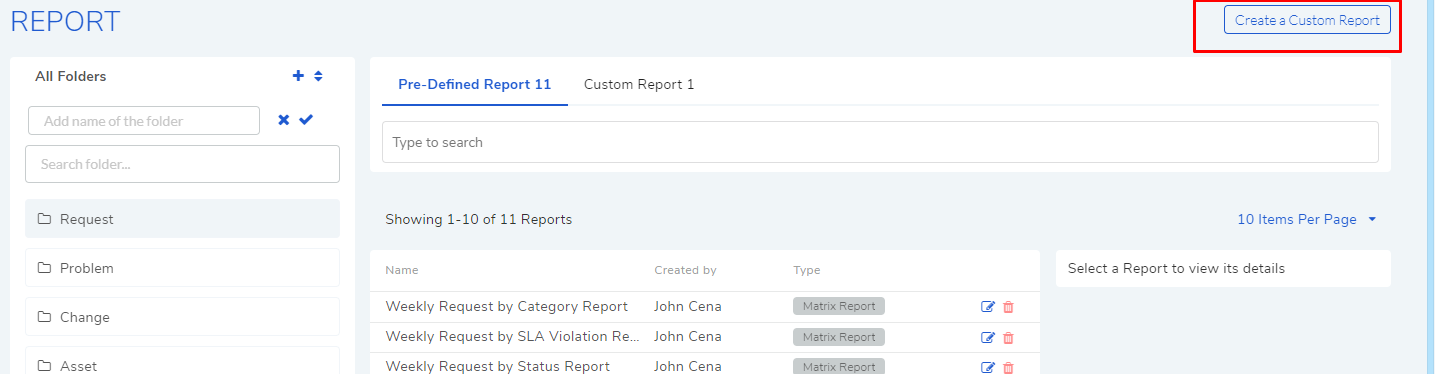
Go to Launcher >> Report (Reports List View).
The Report List View opens. Click on Create a Custom Report button situated in the top right corner of the page. Create a Custom Report dialog box opens where you have to perform the following actions:
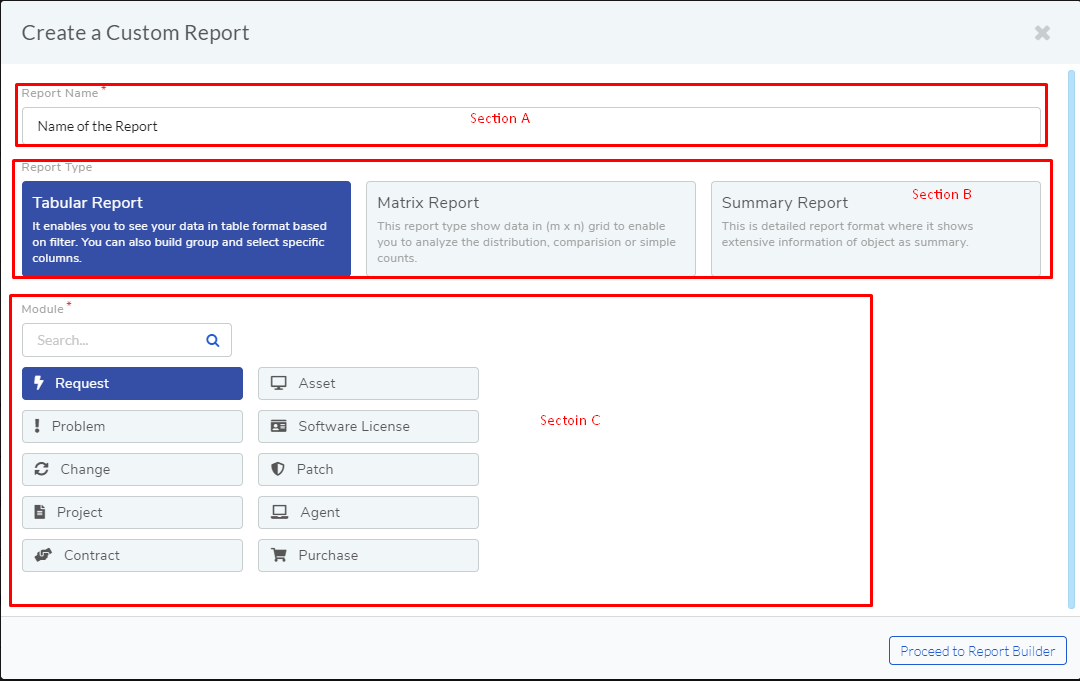
9.2.1.2.1.1. Add a Name to the Report
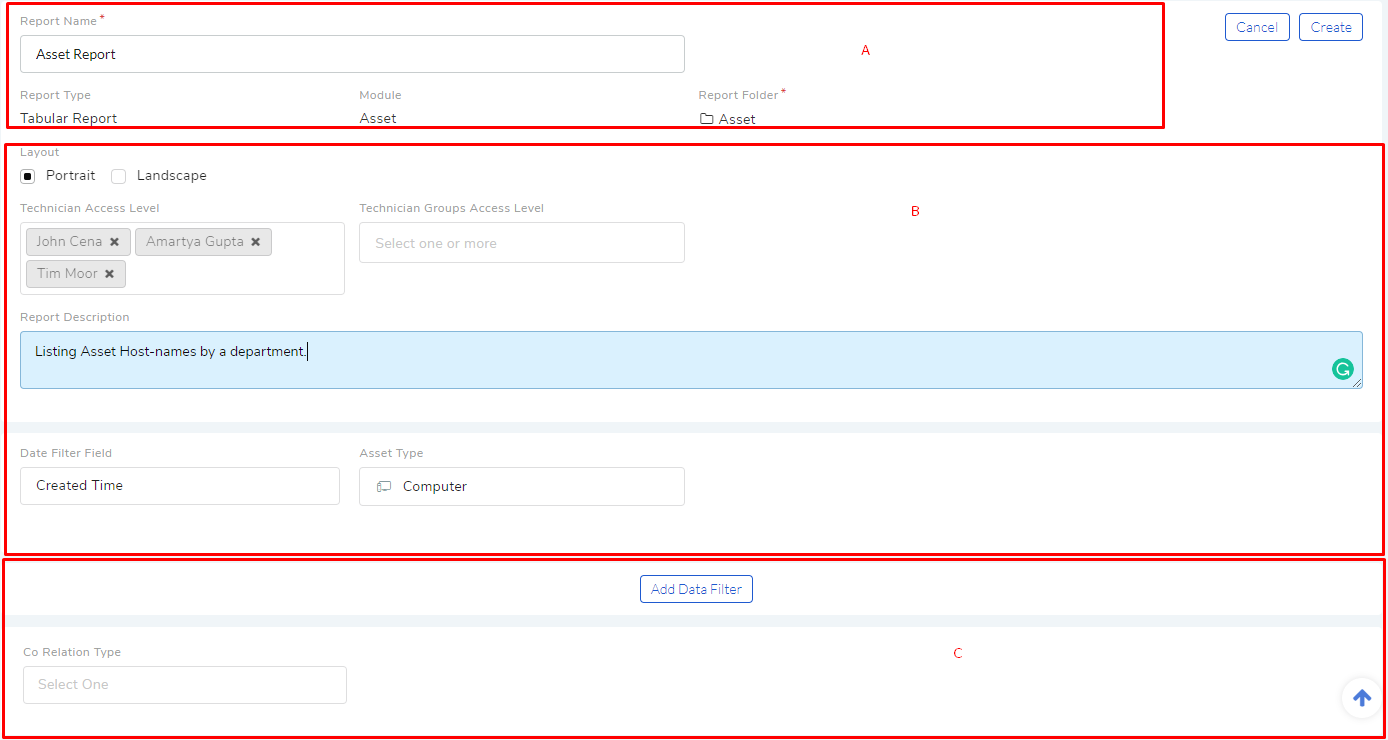
Section-A (rf1.1) is where you enter the name of the Report. The best
practice is having a name which is descriptive and concise.
9.2.1.2.1.2. Selecting Report Type
Section-B (rf1.1) lets you select the Report type. There are three
types shown which are as follows:
Tabular Report: These are simple reports that allow you list items in columns grouped by specific criteria/filters formated as a table.
Matrix Report: This type of Reports show cumulative item counts in a grid format (C X R). The counts are group based on specific criteria/filters.
Summary Report: This type of Reports can summarize properties, details, milestones, and components of items in Asset, Projects, Patches, Purchase and Software License.
Note: This is a onetime selection meaning that you cannot change it later.
9.2.1.2.1.3. Selecting a Module
Section-C (rf1.1) is where you search and select the module for which you are
making the Report. You are allowed to select one module from the
following modules:
Request: Refers to the Request Management module.
Problem: Refers to the Problem Management module.
Change: Refers to the Change Management module.
Asset: Refers to the Asset Management module. You can drill down to an Asset Report Type (you can further drill down to an Asset Type in the next stage) with the selection in
rf2. The Report will be generated based on the Asset and type you select.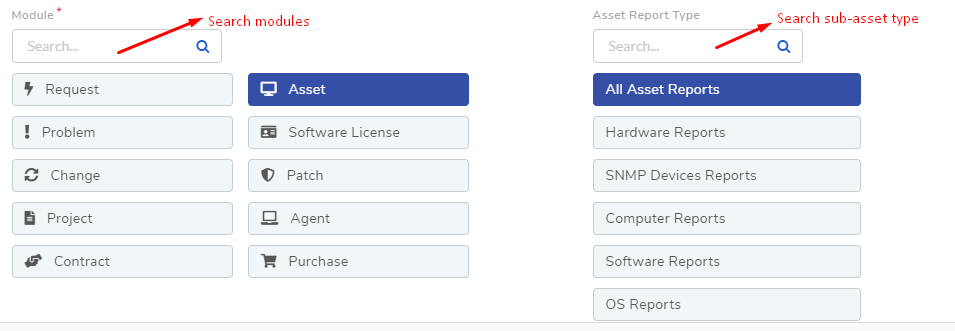
Note
You can further drill down in the Asset Type selection with Set Asset Type.
Project: Refers to the Project Management module.
Remote Deployment-Patch: Refers to the Patch Management module. When selecting this module you also have to select a platform.
Remoter Deployment-Agent: Refers to the Motadata Agent used for Asset discovery and remote deployment of patches and packages.
Software License: This allows you to create exclusive reports on Software License usage.
Multi-Module: This module helps you to combine two or more existing Reports into one Report. This module is visible when the Report Type is set to Summary Report.
Contract: Refers to the Contract Management module.
Purchase: Refers to the Purchase Management module.
Depending on the module selected, the Criteria parameters, data columns and group by properties are updated.
Note: This is a onetime selection meaning that you cannot change it later.
After completing the dialog box, click on Proceed to Report Builder to move to the New Custom Report page.
9.2.1.2.2. Completing the New Custom Report Page (Stage 2)
The next stage in creating the Report is to complete the New Custom Report page. Here you construct the report by:
Categorizing the Report using a Folder.
Deciding the layout of the Report.
Decide who gets to see the Report using access control.
Adding data filters based on time and other criteria.
Decide a on sub-module if there’s a scope.
Add filters to get specific data from the module.
Adding of Group By criterion.
Selecting columns.
There are slight differences in the way columns are selected for different report types; and the available columns also differ with different modules. To further elaborate the steps follow the below explanation:
Note
Please refer rf2.1 & rf2.2 for below descriptions.
9.2.1.2.2.1. Editing the Description of a Report
In section-B (rf2.1), you can enter the description of the Report. Write a
suitable description because it is used as a body when the Report is
sent via email.
9.2.1.2.2.2. Setting the Folder of a Report
It is compulsory to set a folder for a report. In section A (rf2.1), you can set a folder by clicking on Report Folder.
A dialog box opens, where you can select an existing folder or create a new one and then select.
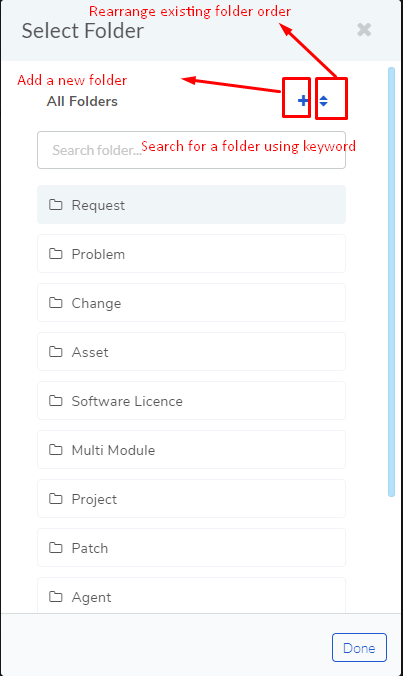
Learn more about Folders for Managing Reports.
9.2.1.2.2.3. Setting Layout of a Report
Section-B (rf2.1) houses the layout options that decide the
orientation of the final Report. You can see the orientation when the
Report is opened either in PDF or Excel format. There are two
orientations to choose from:
Portrait
Landscape
9.2.1.2.2.4. Report Visibility
Section-B (rf2.1) houses the access control. Here you can control who can view the Report.
There are two ways to share a report:
Technician Access Level: You can share the view and use rights to specific Technicians. But the right to edit and delete will still lie with the creator of the Report.
Technician Group Access Level: You can share the view and use rights to specific Technician Groups.
Note
If the fields are left empty then the Report becomes a private Report, which can be viewed by the owner only.
9.2.1.2.2.5. Filter Data with Time
Section-B (rf2.1) allows you to filter data using time. When
filtering tickets and CIs, one of the below mentioned type of time data is considered, depending on your selection.
Created Time: Whenever data is fetched, by Motadata, from a module, the Create Time is considered in checking conditions, if any. For example, in a Report that shows total Requests with the Urgency set to High and group by Technicians for last 60 days, the Motadata checks the Create Time of all the Requests to see eligibility for the period.
Updated Time: Instead of Create Time, the system uses the Update Time in checking data.
Closed Time: The closed time of a ticket/item is considered to check whether it falls within a specified period.
Warranty Expiration Date: Warranty Expiration Date of an Hardware Asset (including all its children) is considered to check whether it falls within a specified period.
Acquisition Date: Acquisition Date of an Hardware Asset (including all its children) is considered to check whether it falls within a specified period.
Audit Date: Audit Date of an Hardware Asset (including all its children) is considered to check whether it falls within a specified period.
You can altogether ignore this filter by selecting None.
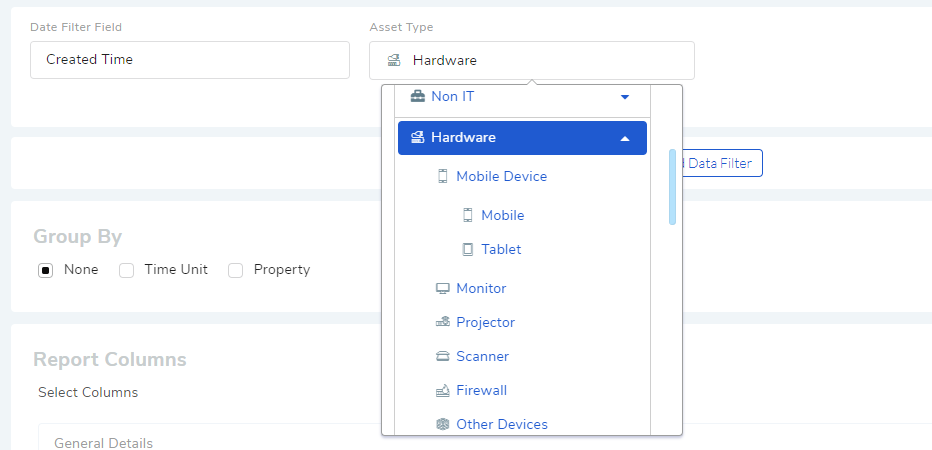
9.2.1.2.2.6. Set Asset Type
When creating an Asset Report, you can specify a particular Asset Type (even a sub-type) in Section-B (rf2.1).
This option allows you to generate reports, for example, of only Hardware Assets (Based on below diagram).
9.2.1.2.2.7. Apply Filters with Single Module
Section-C (rf2.1) is where you set conditions to filter data before
it is used for generating Reports.
The condition parameters are different for each module, but the way they
work is same for all. To start adding filter criteria, click on Add Data Filter (rf2.1).
You can add multiple conditions to filter the data. Conditions can be grouped together. A Condition is created from a predefined list of parameters framed as a statement; the parameters are different for each module.
You can add multiple condition groups with the Add Condition Group option. Within each group, you can add the condition statements.
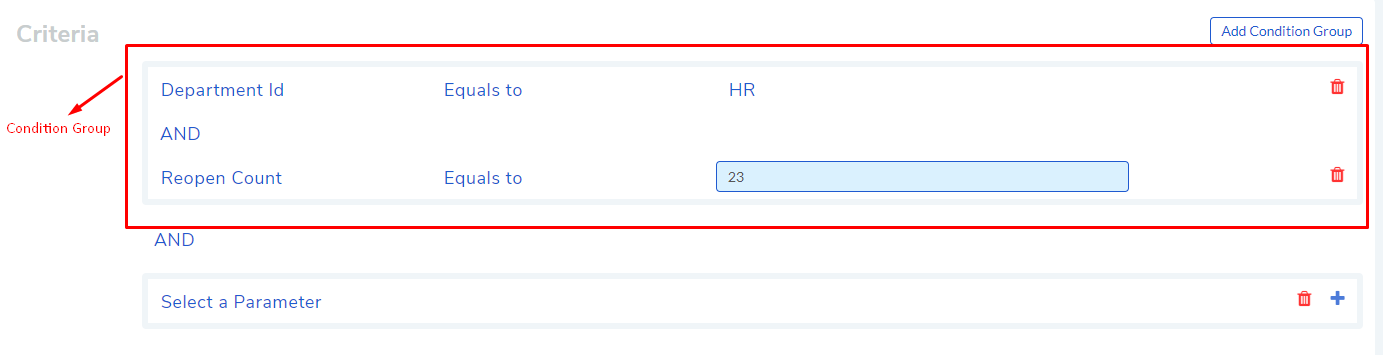
Each condition statement talks about a parameter being equal/not equal to something. You can form a condition statement by clicking on the three components marked by red boxes in Figure 3. Condition statements exist within a group, and you can add multiple conditions by clicking on the plus sign.
The conditions are checked following a hierarchy: first conditions are checked within a group, and then within groups. The outcome of a condition statement or a group of statements, or groups of statements is either true or false. The word AND & OR helps in deriving an outcome when there are multiple statements or groups, or both.
Multiple condition statements can also be evaluated using two basic operators: AND & OR. These two operators describe the relationship between two statements, and the outcome is always either true or false.
9.2.1.2.2.8. Apply Filters with Correlated Modules
Some modules have correlation with other modules; for example, Asset module has correlation with Patch (Remote Deployment). If a module has correlation, then you can select a co-related module from a drop down menu.
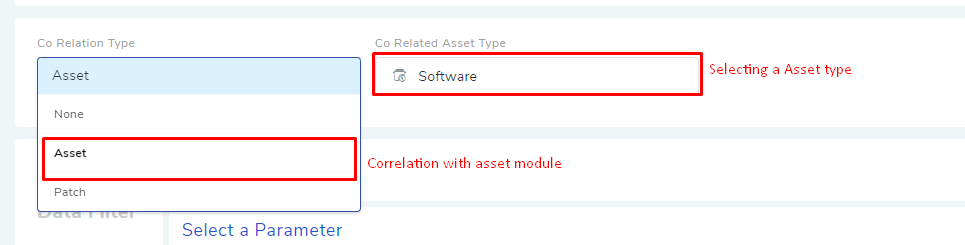
With correlation, you can play at the intersection/subset between two modules. A correlated module can have its own set of filters/conditions.
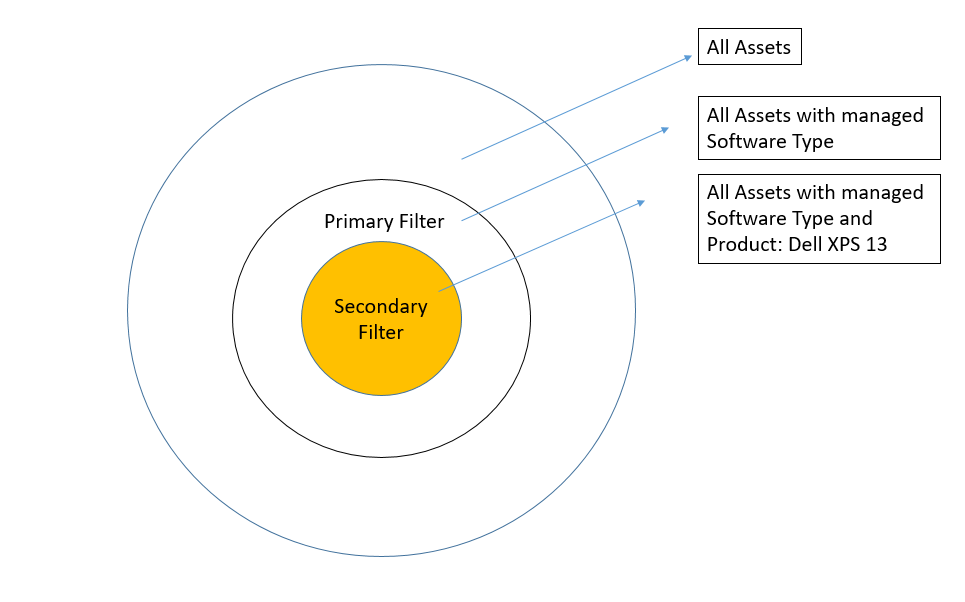
The below filter criteria is of a tabular report that shows the name of all Windows Laptop of the product Dell XPS 13 and have at least one managed Software.
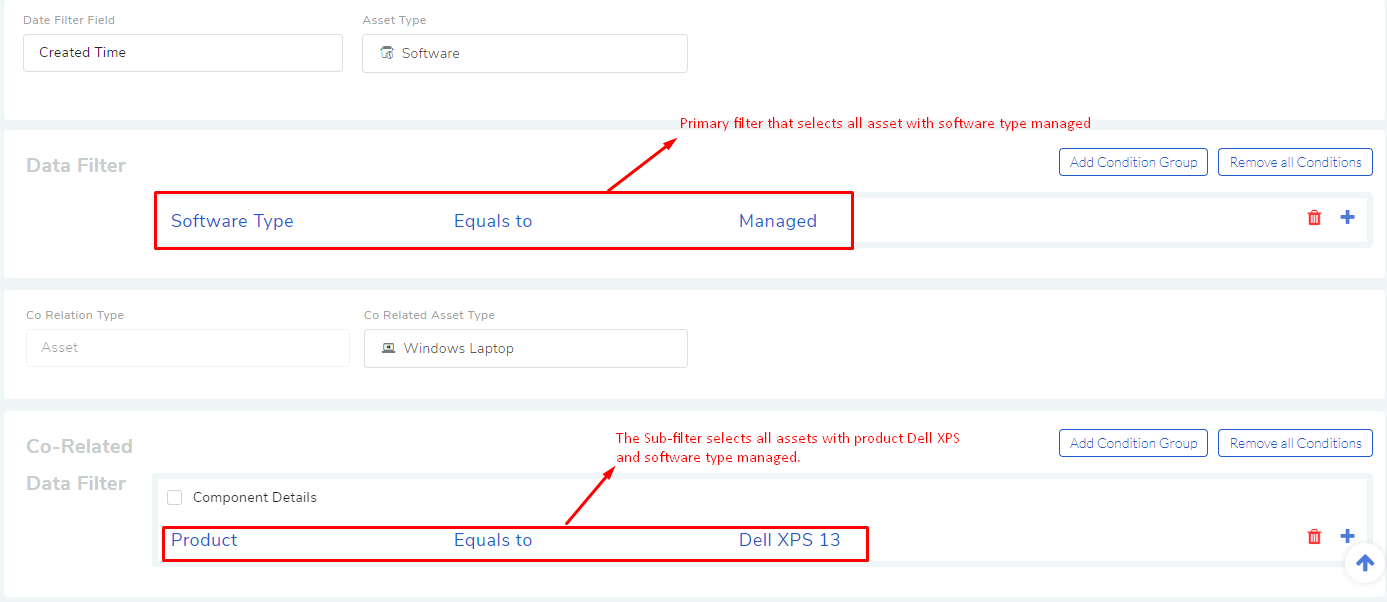
In correlation type reports, the primary filters comes into action first and then the secondary filters (of the correlated module).
Note
Read a use-case for correlated Report.
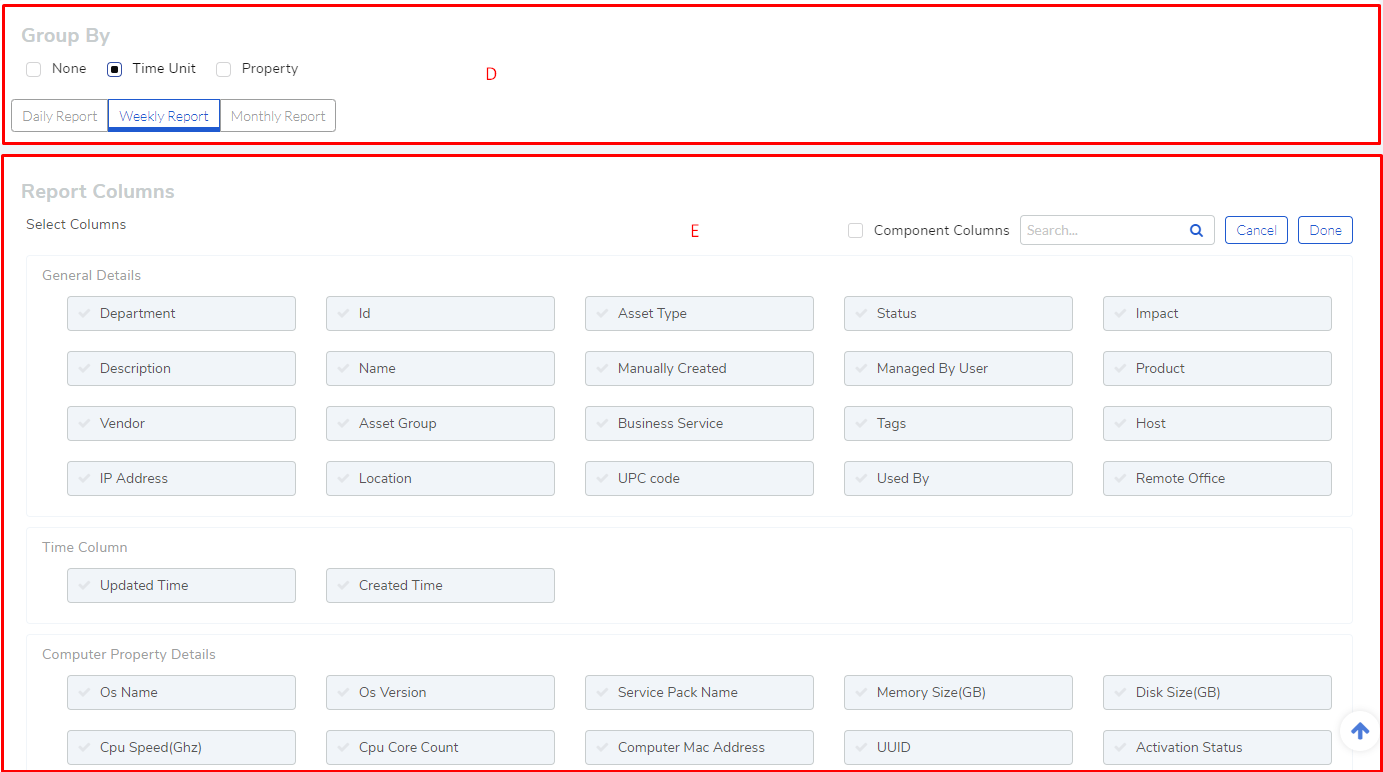
9.2.1.2.2.9. Grouping of data
Section-D (rf2.2) houses the Group By feature that groups the data
rows in a Report by:
Note
This field always has a value when the Report type is Matrix.
Time Unit: You can group the data row either Daily, Weekly or Monthly. This option is available when a data filter is selected.
Property: Each module has a list of properties that you can use to group the data rows in the Report.
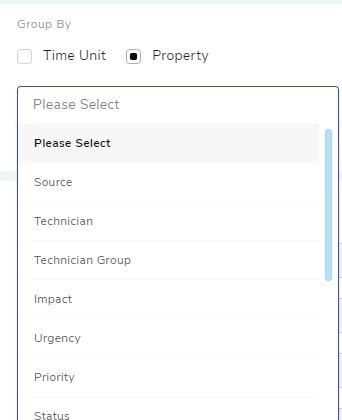
Note
The above figure shows the properties of the module Request Management.
You can ignore the group by feature in tabular reports by selecting the None option.
9.2.1.2.2.10. Selecting Columns
The last step in creating a Report is selecting the columns of the report. What columns are available depends on the Report type and module selected.
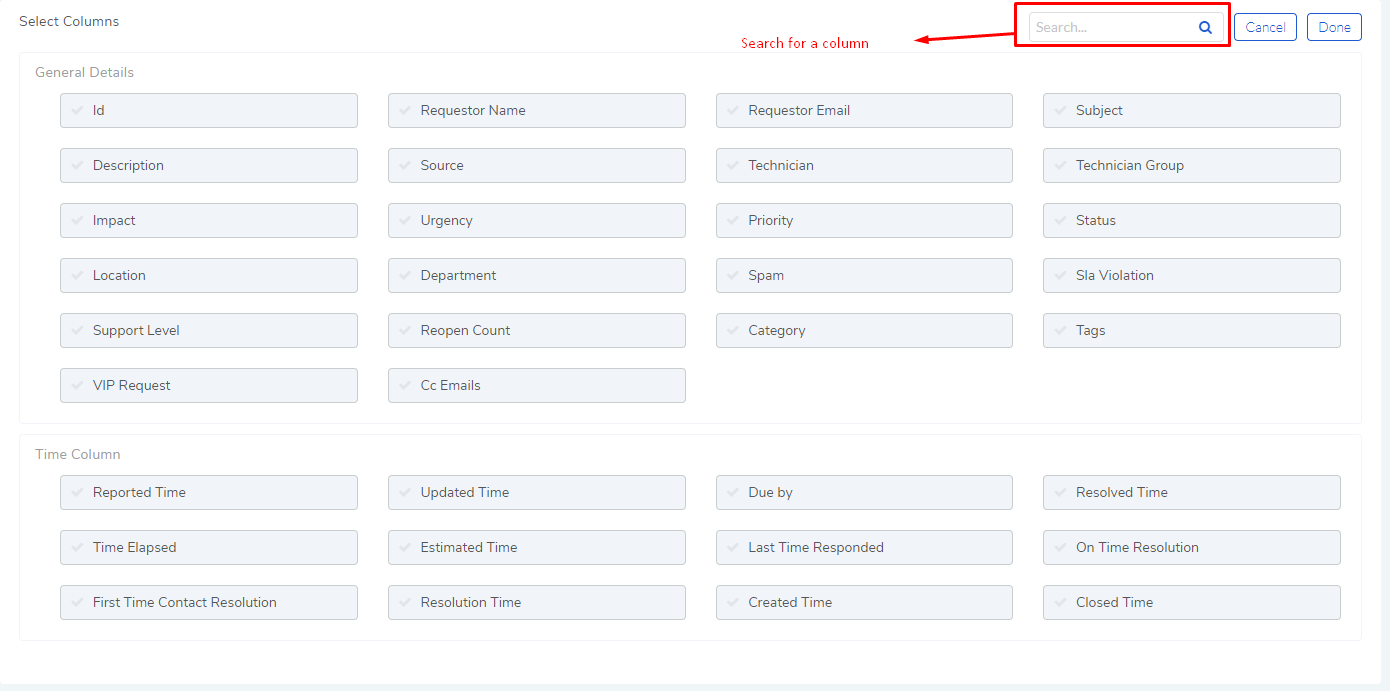
Tabular Report:
You add columns by selecting (Learn what is a Tabular Report) them and clicking on Done.
You can search a column by its name.
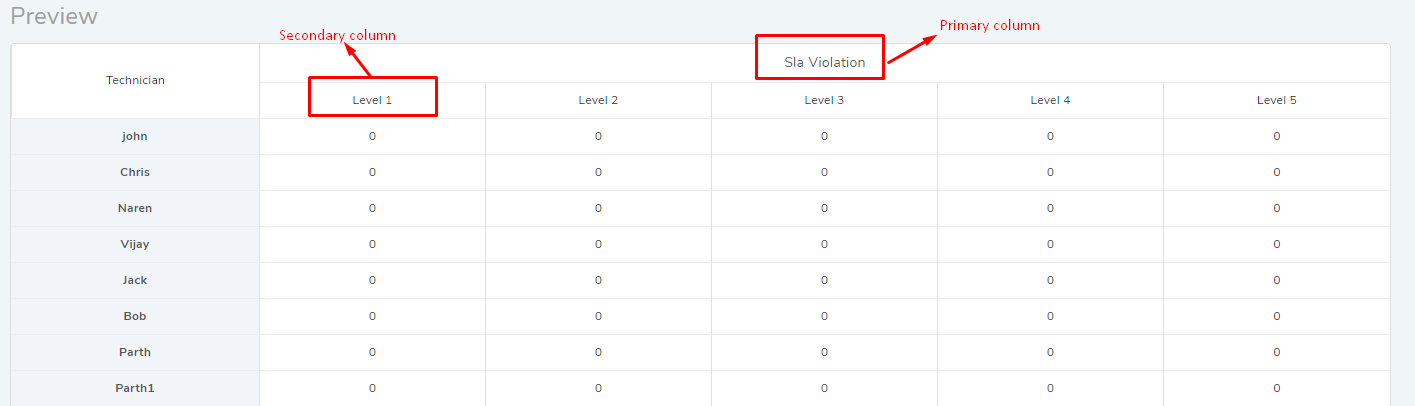
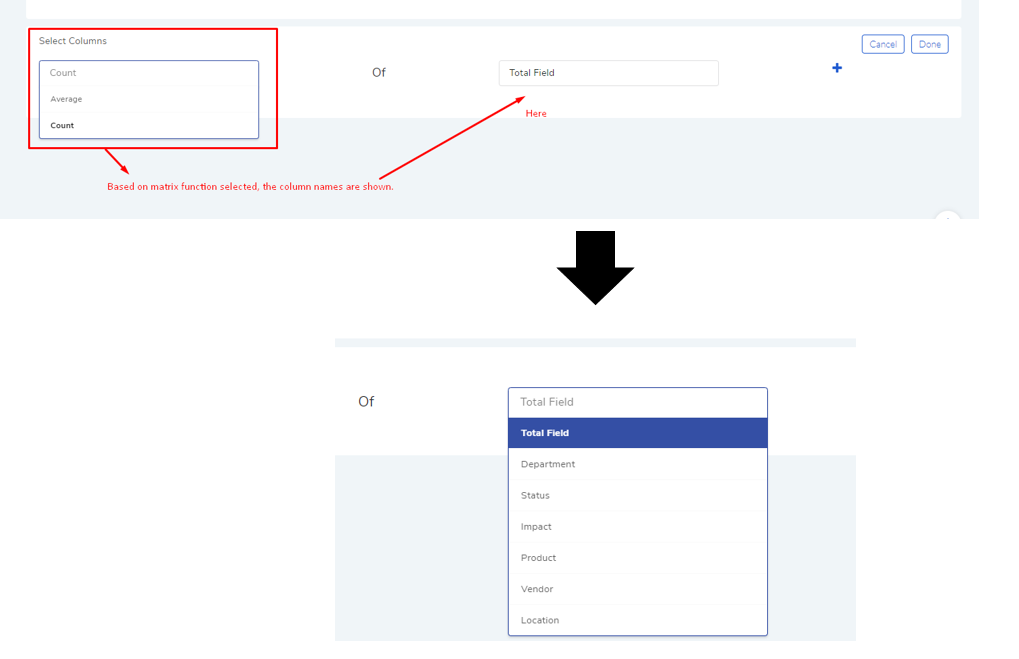
Matrix Report:
You select a column from a drop-down list (
rf5.2). You can add multiple columns. Each column is accompanied by a function. You can filter the column list by Count or Average function.Columns with the Count function shows a cumulative count of items grouped by either time or a product property. Columns with the Average function shows the average of items grouped by either time or a product property.
Some columns have sub-columns which you can access by clicking the down icon next to a column name.
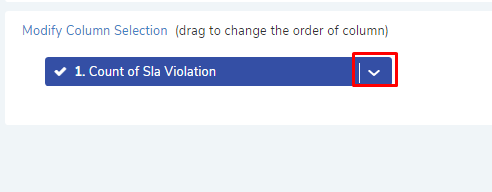
You can choose what sub-columns to include in report from the dialog box. Learn more about Matrix Reports.
You add more columns using the plus icon (
rf5.1).
Summary Report:
You add properties/details by selecting them (multiple selections are allowed) and clicking on Done.
Some properties/details have sub-items which you can access by clicking the arrow icon next to a name.
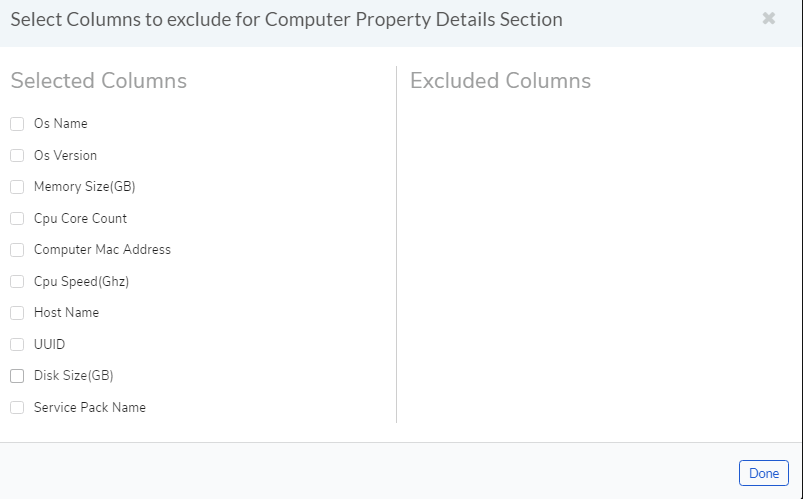
You can choose what sun-columns to include in the dialog box. Learn more about Summary Reports.
Multi-Module Report:
You search and select Reports that you want to merge into one Report. Learn what is a Multi-Module Report.
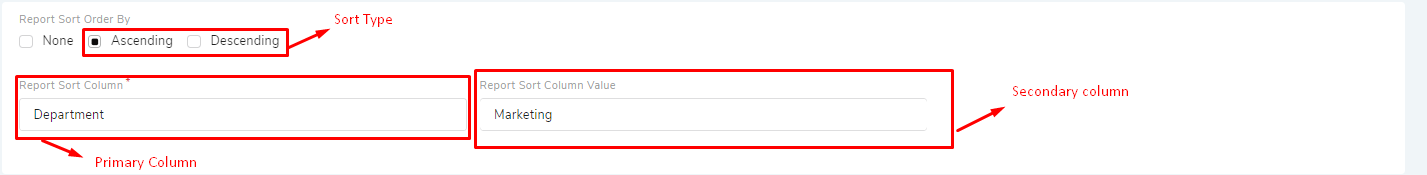
9.2.1.2.2.11. Sorting Columns
Once a Technician is done selecting columns, he/she can sort the rows by applying the sort function to a particular column. The sort option is available in Tabular and Matrix Reports.
There are two types of sorting Ascending and Descending. When doing sort, a Technician first selects a sort type, and then selects a column; if the selected column has sub-columns, then the Technician has to select that also.