9.2.5. Create a Matrix Report
We open the Create a Custom Report dialog box.
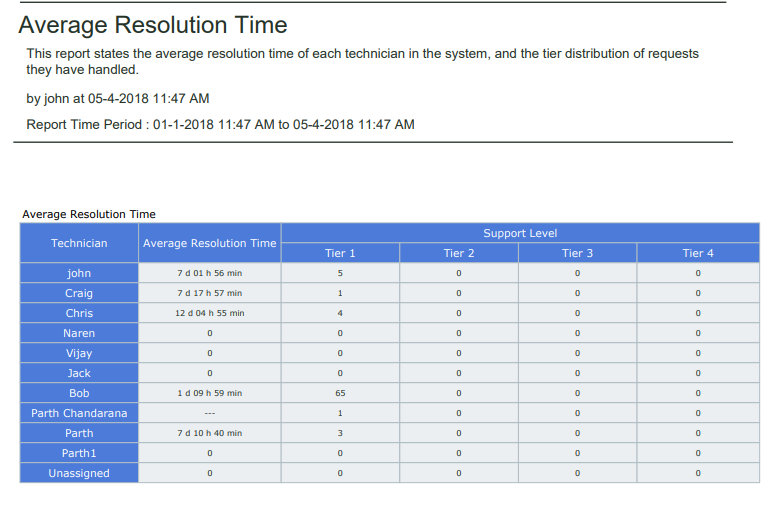
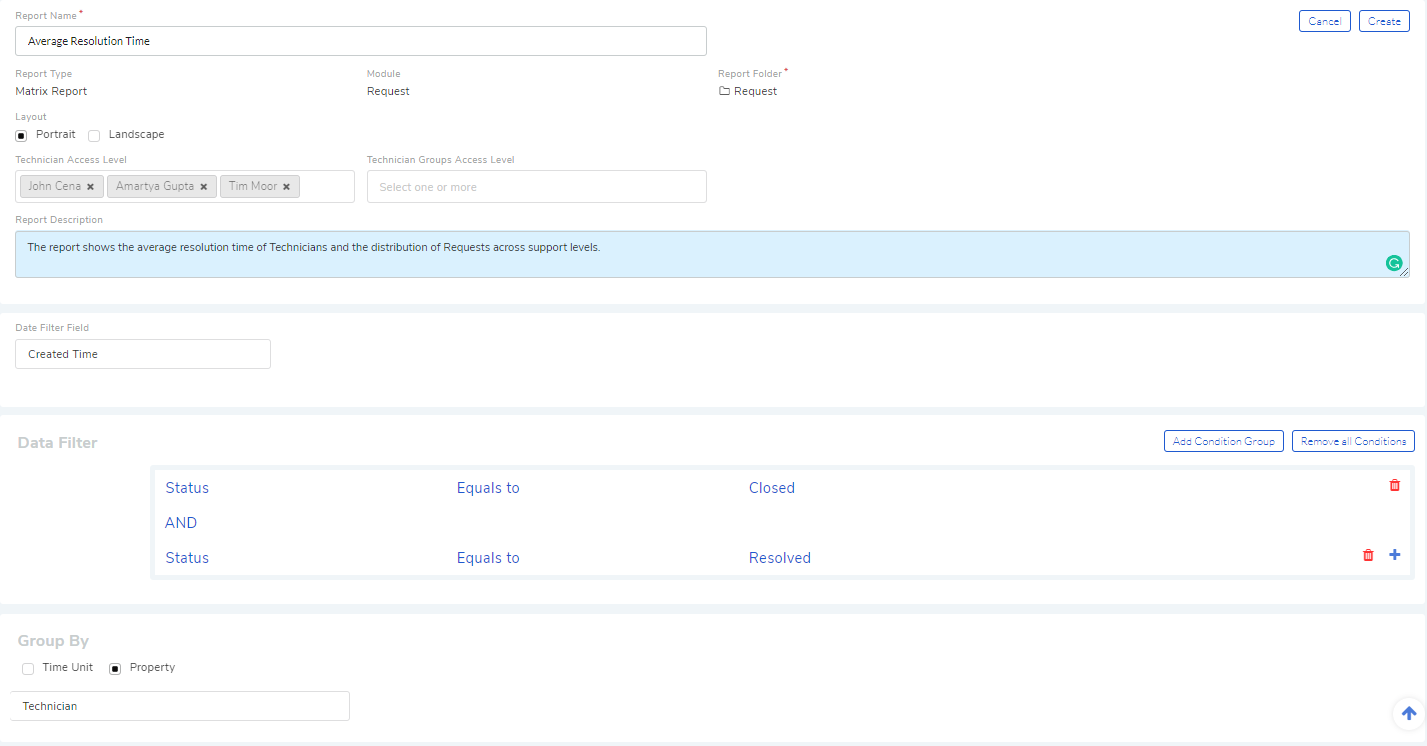
We are going to create a Matrix Report called Average Resolution Time that shows the average resolution time of each Technicians along with the Request number bifurcated across support levels.
Following is our selections/inputs for the sections in Create a Custom Report dialog box and New Custom Report page:
Values |
Section Name |
|---|---|
{Name of the Report} |
Add a Name to the Report |
Request |
selecting a module |
Matrix Report |
selecting report type |
Request (Report folder) |
Setting the Folder of a Report |
Description of the Report |
Editing the Description of a Report |
Portrait |
|
Report Shared with three Technicians. |
report visibility |
Created Time |
filter data with time |
Status Equals to Closed |
|
Technician |
grouping of data |
Scroll down to Select Column section of the page.
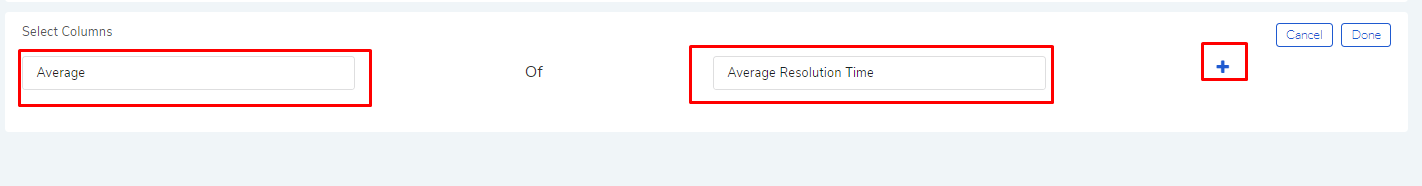
A Matrix Report gives you a cumulative count of data; for example, the total number of Requests assigned to each Technician. In :numref: rf14, Average is the function mentioned in the first box, and the second box shows you the column names supporting the average function. Each module has different column names. You can add more columns using the Plus Icon.
We select two columns and click on Done to finalize our decision.
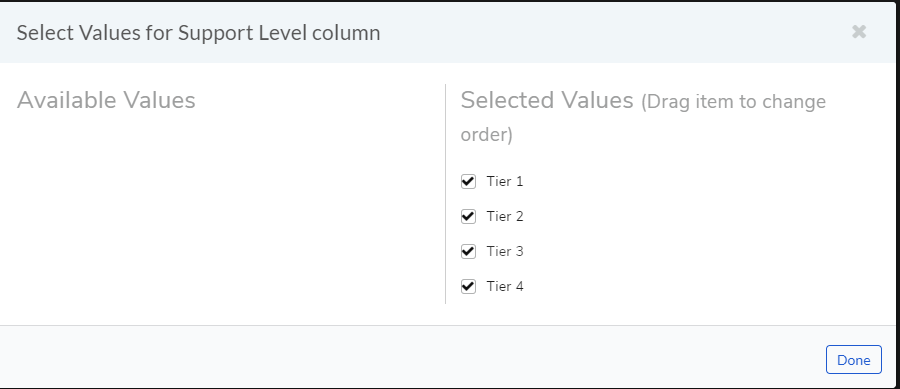
It may happen a column name may generate additional columns. You can control the visibility of those columns.

In the above figure, we have selected a column name Support Level. Clicking on the arrow icon adjacent to the column name opens a dialog box where you can check what sub-columns to show.
We don’t apply any sort function to any column; we select None for sorting.
We save the Report.by clicking on Create.
We get the following Report when we preview for the past 3 months and group by Technicians.