Create Report
The page enables you to create a custom report for all the modules. You can create tabular, matrix, summary, plugin, and query reports. Based on the module and report type selected, the filters, charts, and column values will appear for configuration.
- Geolocation is supported for Windows Laptop, Windows Desktop, Windows Server, and Hyper V assets only.
- While creating reports, Geolocation related conditions and columns will appear only for those assets in which the Geolocation feature is supported. For example, if the Asset Type is selected as Windows Laptop, then Geolocation related conditions and columns like Geolocation history, Enable Geolocation, and Geolocation Last Sync Time will be available.
Tabular Report
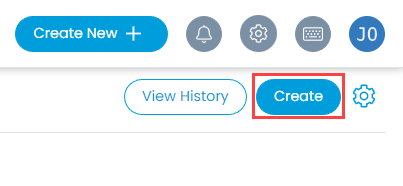
The tabular report displays the actual data of the column fields. To create a tabular report, Click Create on the top-right corner of the page and the Create Report page appears as shown below.
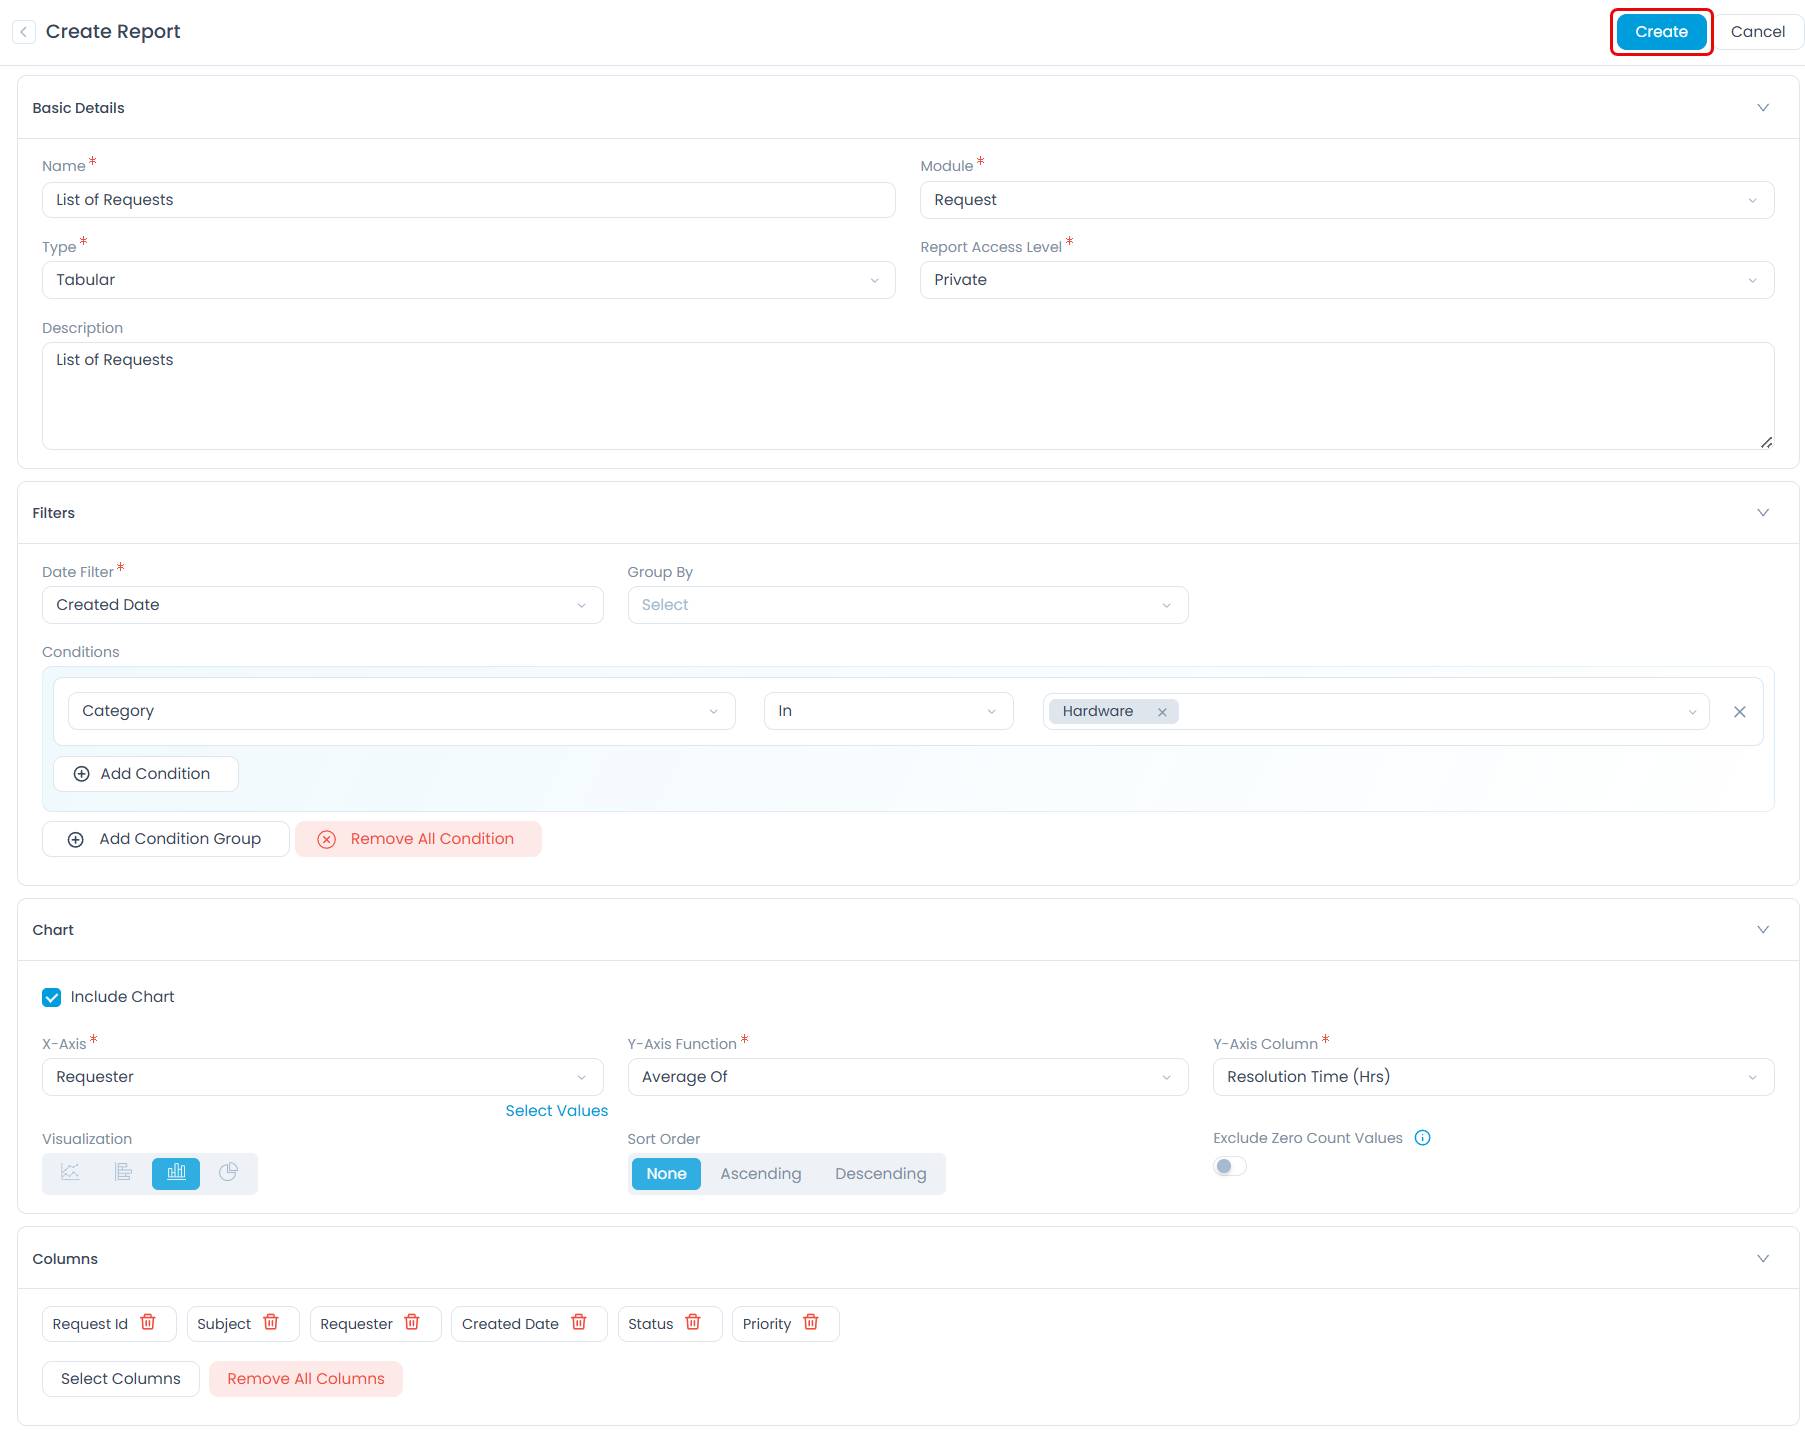
Enter the following details: Basic Details
- Name: Enter the name of the report.
- Module: Select the desired module for which you want to generate the report. Based on the module selected, the report identifies the relevant filters, and columns of the report. For example: If you select the Request module, all the filters, and columns related to the request will be displayed. Also, in case of the Release report, all the filters, and columns related to the Release module will be available.
- Type: Select the type of report as Tabular.
- Report Access Level: Select the visibility level for the report. New reports default to Private. The options are:
- Public: All Technicians can view the report.
- Private: Only the report creator can view the report.
- Restricted: Share the report with specific Technicians or Technician Groups. Selecting this option makes the Technician Group Access Level and Technician Access Level fields available.
- Technician Group Access Level: Select the Technician Groups to grant access to the report. This field appears only when Restricted is selected.
- Technician Access Level: Select the Technicians to grant access to the report. This field appears only when Restricted is selected.
- Description: Enter the description of the report.
Filters Select the filters that display only relevant data without any clutters.
- Date Filter: Select the date from which the data is to be extracted. The options are: Created Date, Resolved Date, Closed Date, Last Updated Date, and Last Approved Date.
- Group By: Select the fields based on which you want to group the data. Once selected, you can also select the options within the configured parameter of the Matrix report. Only parameters of type dropdown, dependent, and multi-select are supported.
- Conditions: Add conditions if you require more precise output. A report can have single filter condition for simple report or a combination of conditions for precise analysis of some records.
Chart Enable the flag Include Chart if you wish to include the chart in the report. If enabled, enter the following details:
- X-Axis: Select the field you want to display on the X-axis.
- Y-Axis Function: Select the function you want to display on the Y-axis. The functions are: Count of and Average Of.
- Y-Axis Column: Select the column you want to display on the Y-axis. Once selected, you can also select values related to the column as shown below.


- Visualization: Select the type of chart you want to display in the report. The options are Line chart, Bar chart, Column chart, and Pie chart.
- Sort Order: Select the order in which the details should be displayed. You can sort in ascending or descending order.
Columns Select the columns you want to view in the report output. The column fields are available based on the selected module. If required, you can also use the Remove All Columns button to delete all the columns.

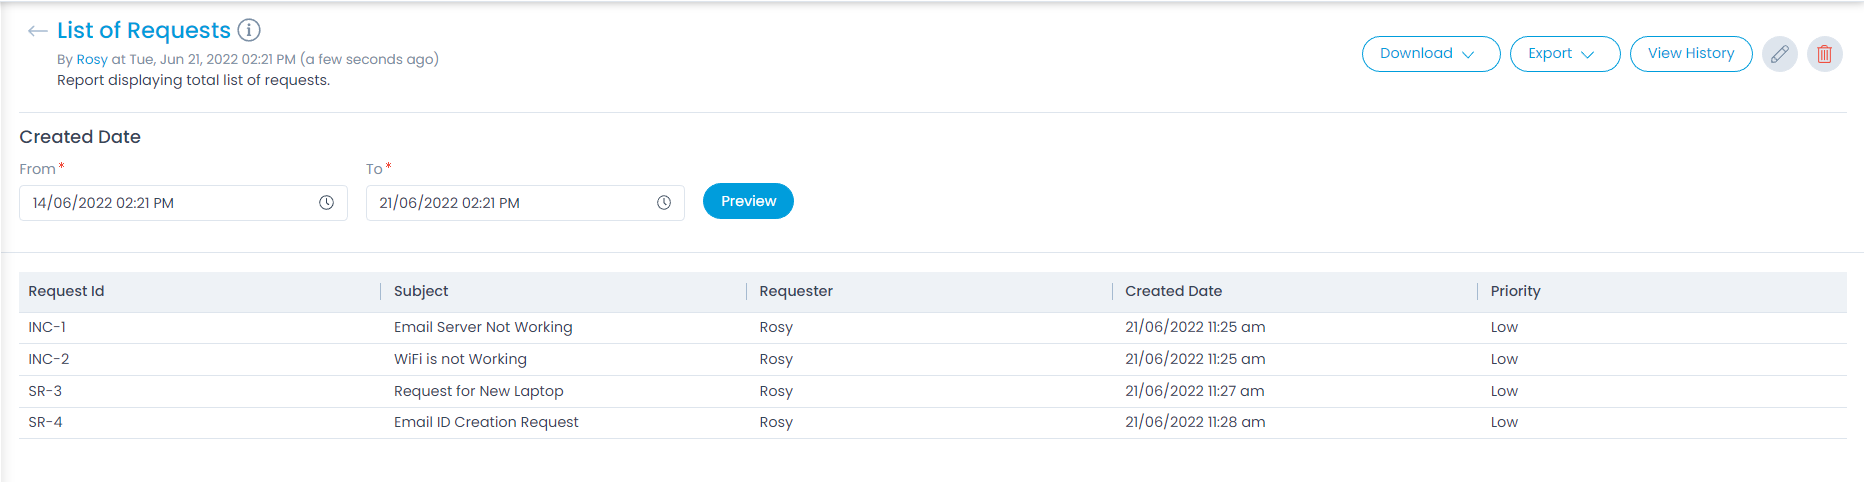
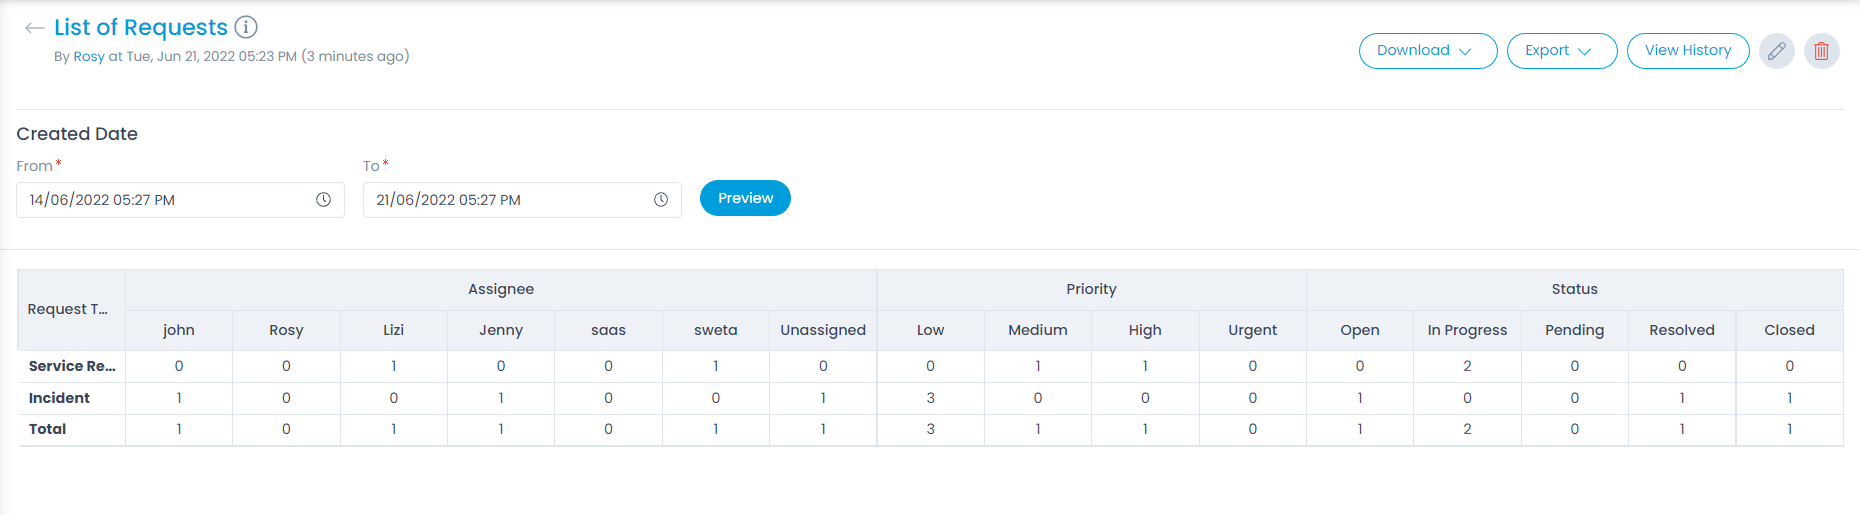
Once done, click Create and the report gets created. Now, select the date range, and click Preview to view the details in a tabular format as shown below. Later, you can also download or export the report if required.
Matrix Report
The matrix report displays the aggregated count of the column values.
To create a matrix report, Click Create on the top-right corner of the page and the Create Report page appears as shown below.

Enter the following details: For Basic Details, Filters, Chart, and Columns refer to the Tabular Report section. Sorting
- Sort Order: You can sort the report in ascending or descending order.
- Sort By: Select the column based on which the report data should be sorted.
- Column Value: Select the value as per the column selected for sorting.
- Top Value: Enter the top value.
Once done, click Create and the report gets created. Now, select the date range, and click Preview to view the details as shown below.
Summary Report
The summary report displays the summarized data of the column fields.
To create a summary report, Click Create on the top-right corner of the page and the Create Report page appears as shown below.

Enter the following details: For Basic Details, Filters, and Columns refer to the Tabular Report section.
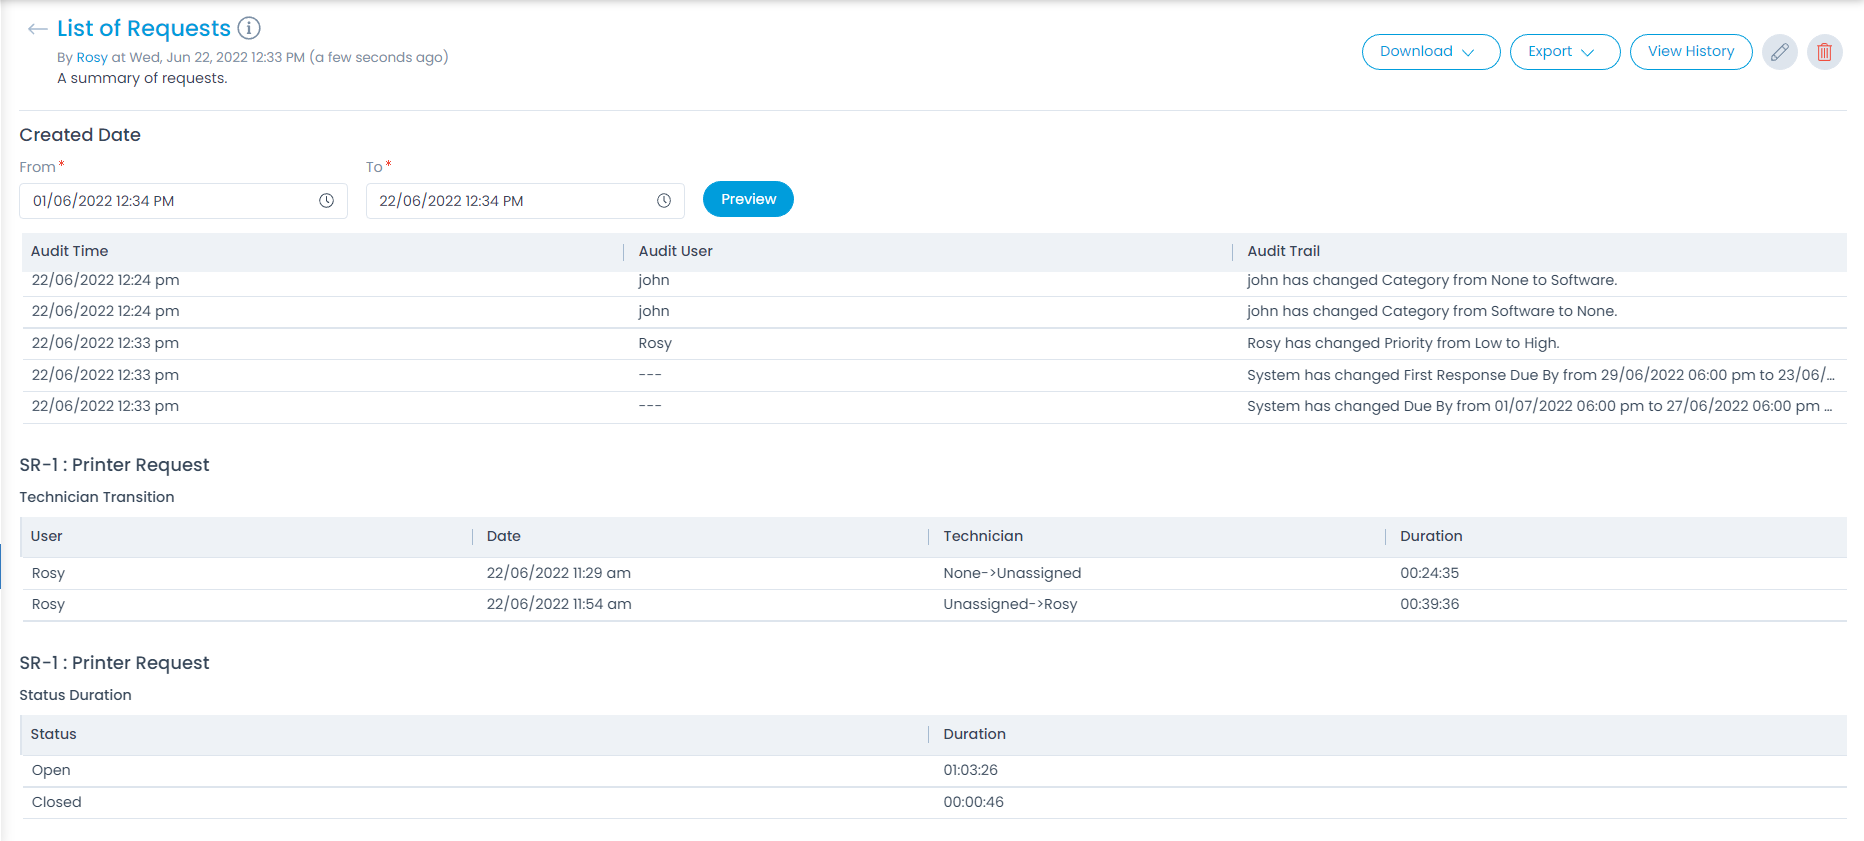
Once done, click Create and the report gets created. Now, select the date range, and click Preview to view the summary of the report.
Plugin Report
The plugin report displays the details as per the customer’s requirements.
To create a plugin report, Click Create on the top-right corner of the page and the Create Report page appears as shown below.
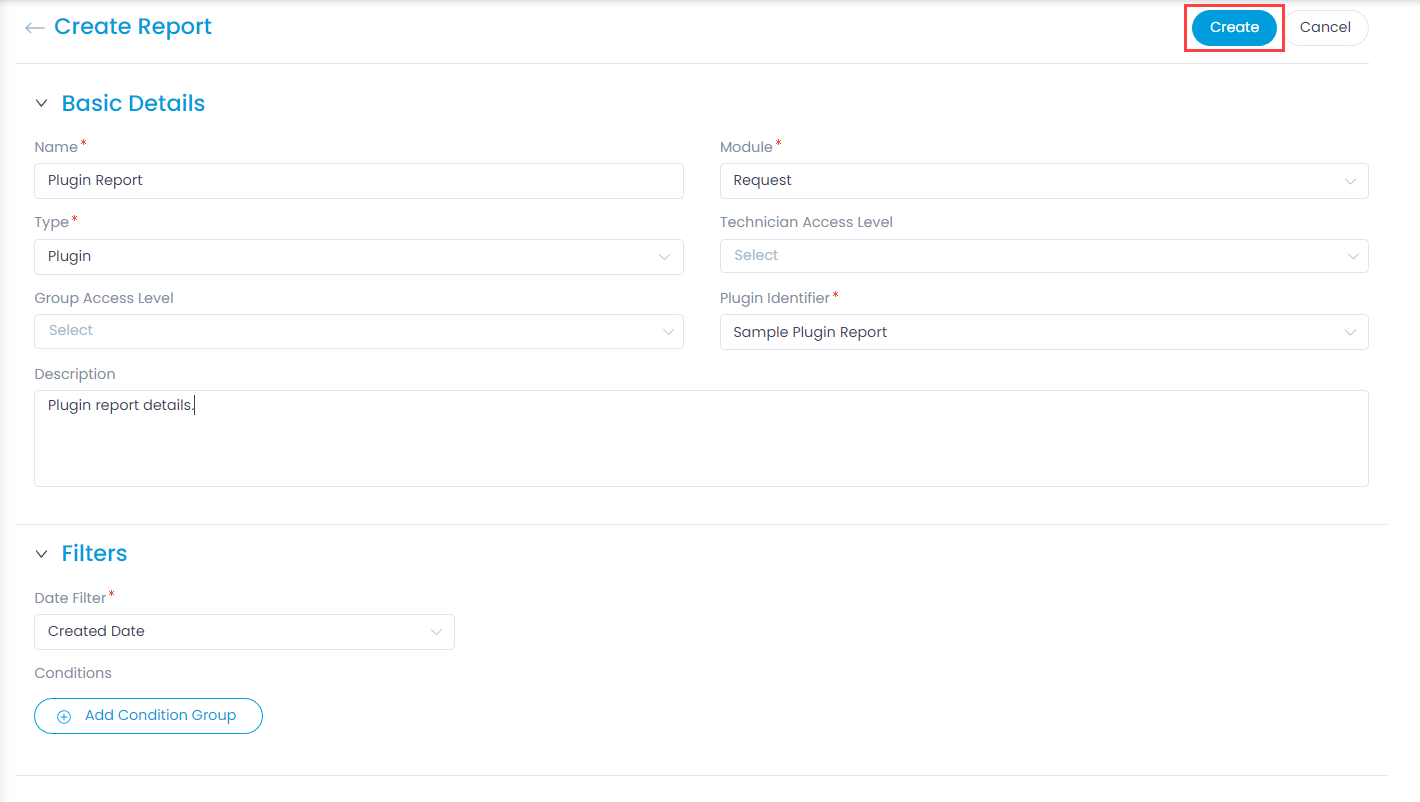
Enter the following details: Basic Details
- Name: Enter the name of the report.
- Module: Select the desired module for which the report is to be generated.
- Type: Select the report type as Plugin.
- Report Access Level: Select the visibility level for the report. New reports default to Private. The options are Public, Private, and Restricted. When Restricted is selected, the Technician Group Access Level and Technician Access Level fields appear.
- Technician Group Access Level: Select the Technician Groups to grant access to the report. This field appears only when Restricted is selected.
- Technician Access Level: Select the Technicians to grant access to the report. This field appears only when Restricted is selected.
- Plugin Identifier: Select the plugin which is to be used for generating the report.
- Description: Enter the description for the report.
Filters For Filters refer to the Tabular Report section.
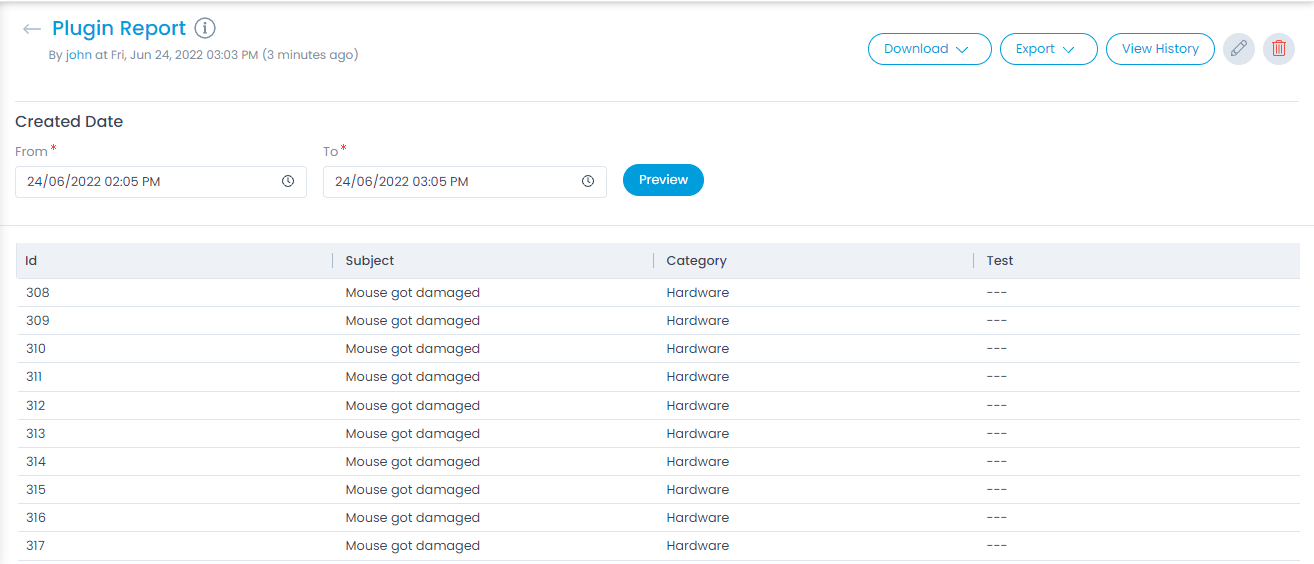
Once done, click Create and the report gets created. Now, select the date range, and click Preview to view the details.
Query Report
The report displays the details based on the queries. This supports PostgreSQL select queries and are helpful to retrieve data from more than one database tables.
To create a query report, Click Create on the top-right corner of the page and the Create Report page appears as shown below.
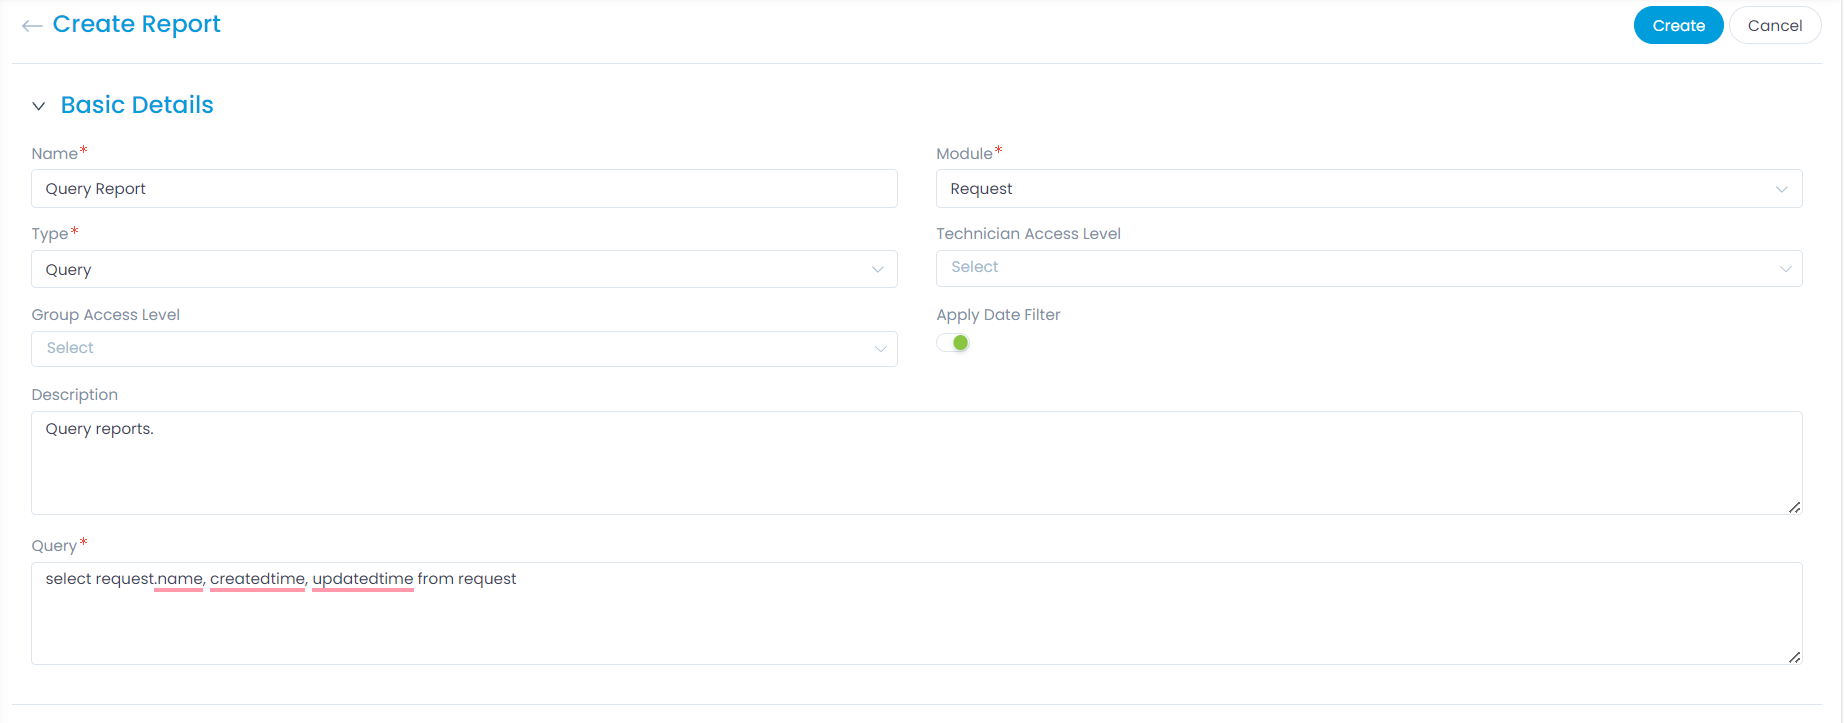
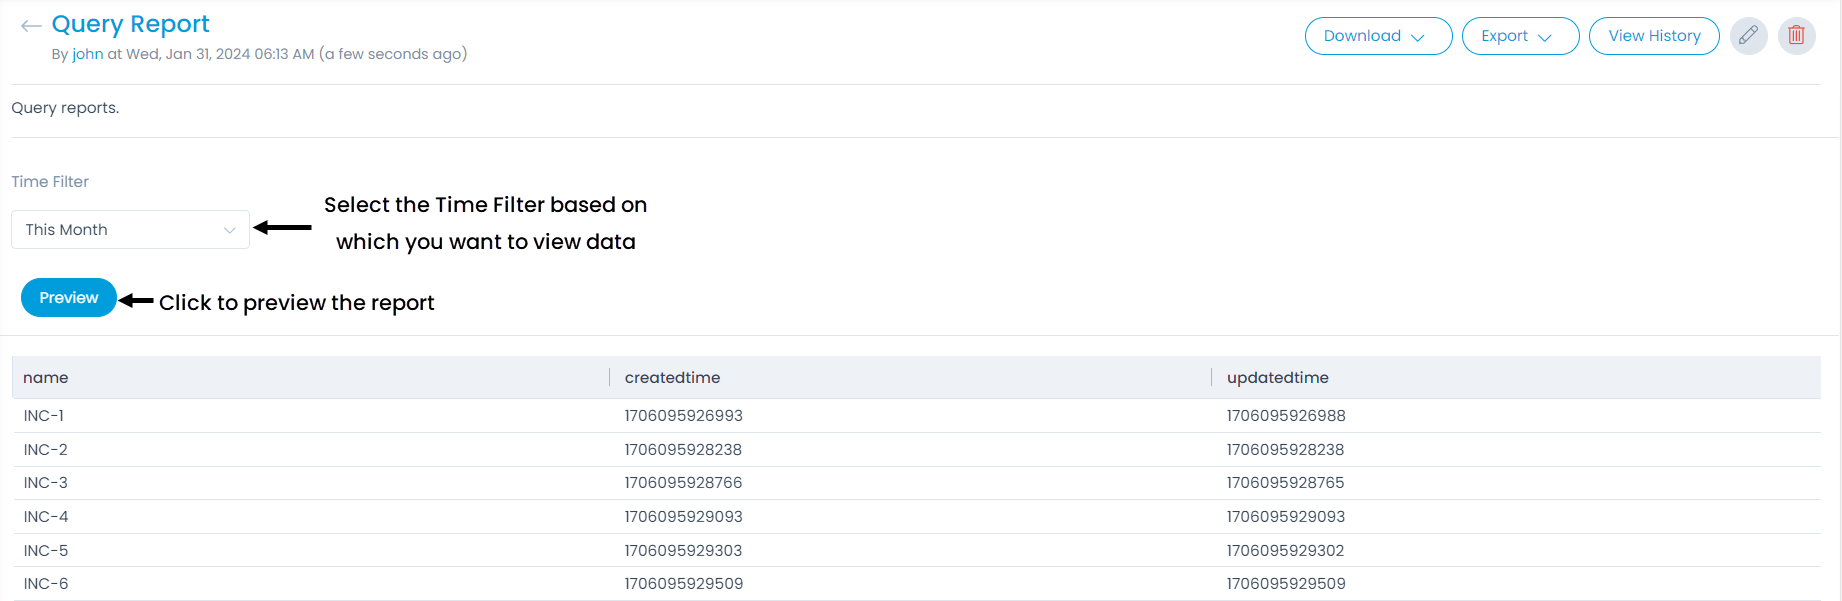
Enter the following details: The Basic Details are same as in the Tabular Report section except for the Apply Date Filter and Query field. If the Date Filter is enabled, the "Time Filter" will appear while previewing the report using which you can view the required data based on the Time Filter. In the Query field enter the required PostgreSQL select query.
Once done, click Create and the report gets created. Now, click Preview to view the details.