How to Set Up the ServiceOps and ObserveOps Bidirectional Integration
Connect ObserveOps and ServiceOps so that every critical alert automatically becomes a trackable request, and every resolved request automatically clears the originating alert, with no manual steps in between.
By the end of this guide, you'll have both directions of the integration fully configured:
- ObserveOps to ServiceOps: An ObserveOps alert at a configured severity automatically creates a request in ServiceOps with the correct priority.
- ServiceOps to ObserveOps: Closing that request in ServiceOps automatically moves the ObserveOps alert to the Clear state.
Prerequisites
Before you start, confirm the following for each system:
In ServiceOps:
- You have the Admin role.
- You have created a REST API integration and have the Client ID and Client Secret. Navigate to Admin > Automation > Integrations > Rest Integration to retrieve or create these.
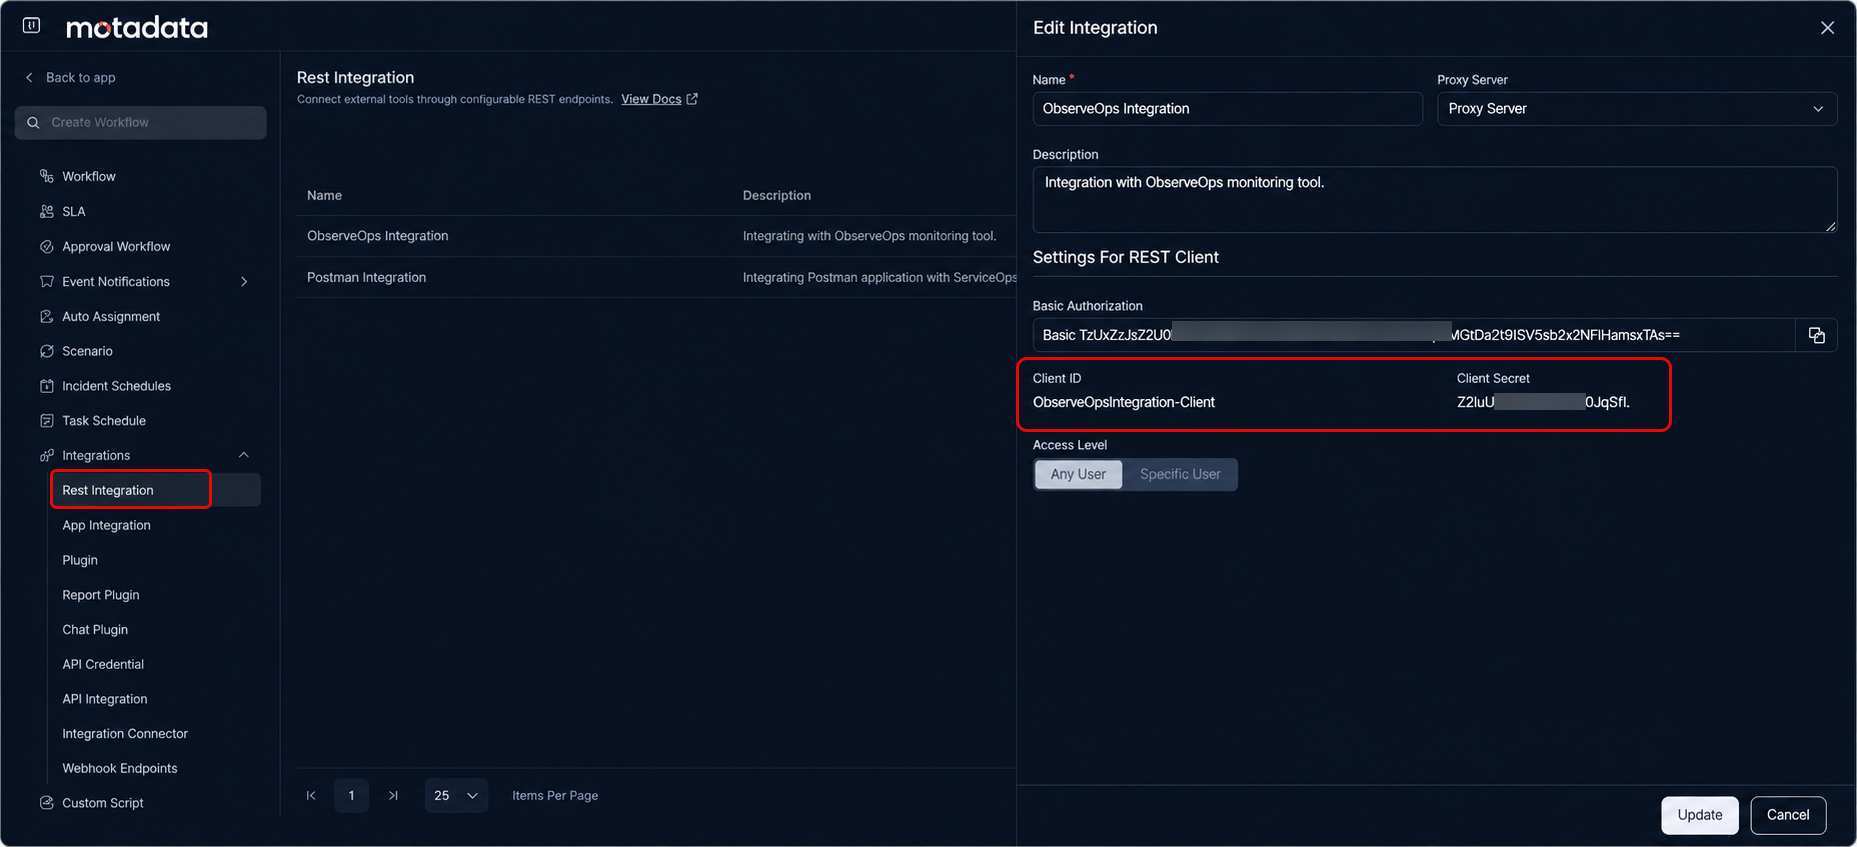
- You have registered a Source value (for example,
ObserveOps) in ServiceOps. ObserveOps uses this value to tag every request it creates. - You have the Access Key for the ServiceOps user account used for the webhook. Retrieve it from ObserveOps > Settings > User Settings > Personal Access Token, create token, and copy the value from the Personal Access Token field.
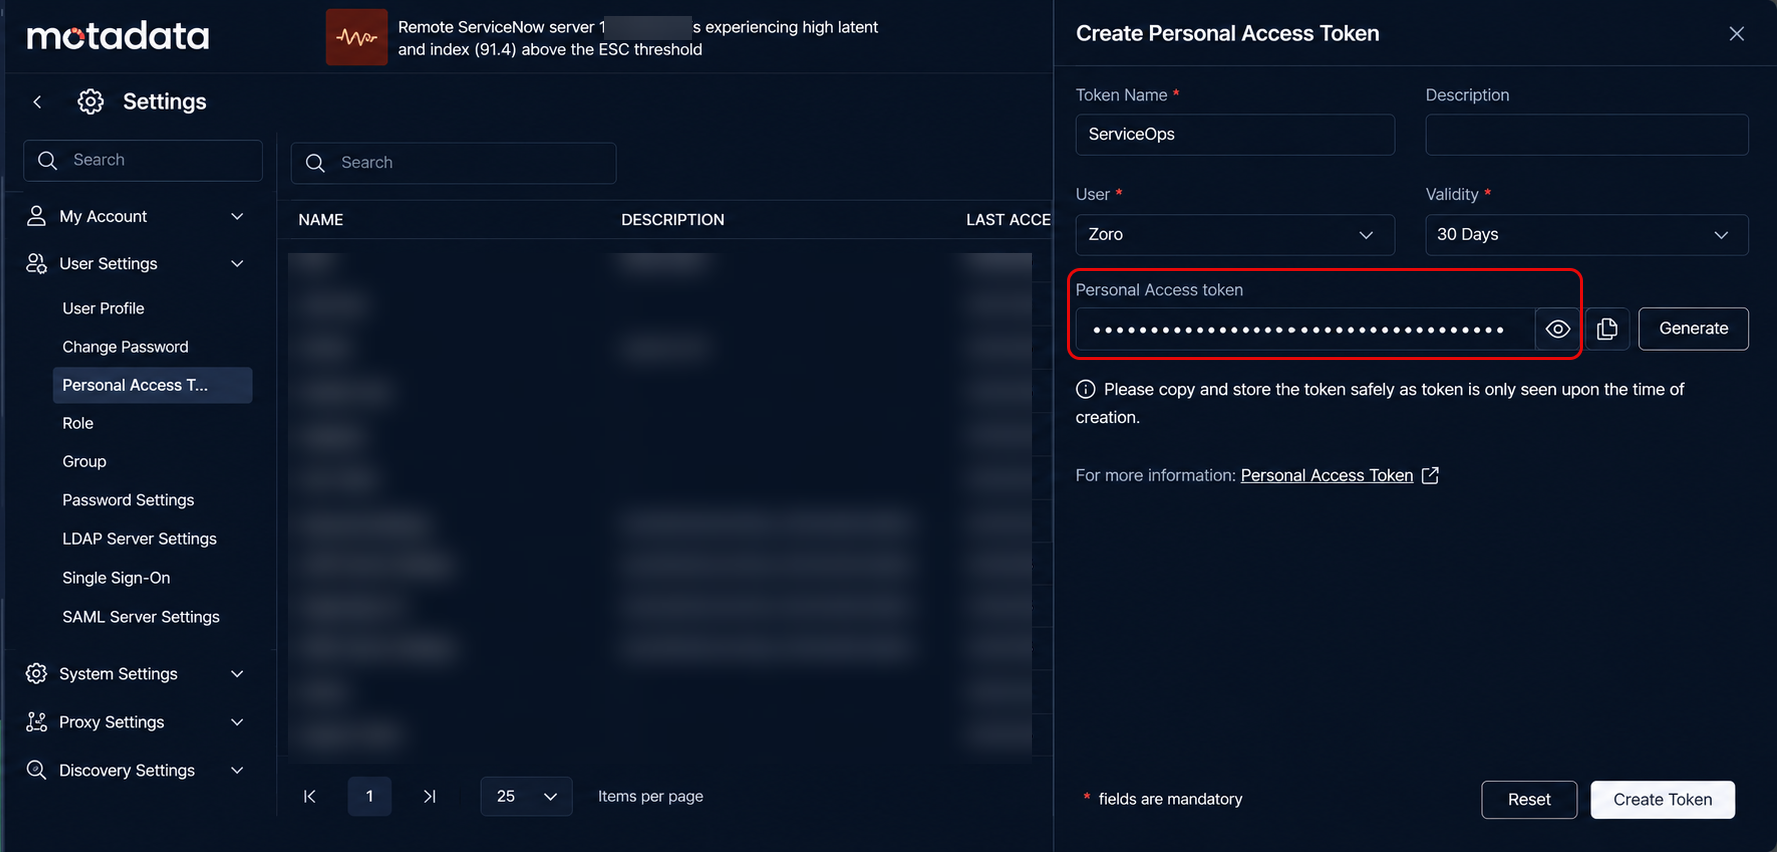
In ObserveOps:
- You have the Admin role.
- You have the IP address or hostname of the Motadata ObserveOps server.
- At least one alert policy exists in ObserveOps, or you are ready to create one.
The integration runs in two independent directions:
Direction 1 - ObserveOps creates a request in ServiceOps:
When an alert in ObserveOps reaches a configured severity, ObserveOps calls the ServiceOps API and creates a request. The request carries the alert name, ID, severity, and a Source field set to the value you registered (for example, ObserveOps).
Direction 2 - ServiceOps clears the alert in ObserveOps: When a technician closes that request in ServiceOps, a workflow fires and calls the ObserveOps API. ObserveOps receives the call and moves the corresponding alert to the Clear state.
The two directions work independently. You can configure them in either order, but both must be active for the full round-trip to function.
Why Configure This Integration?
Incident response teams often work across two consoles: an ObserveOps platform for monitoring, and an ITSM platform like ServiceOps for tracking and resolution. Without integration, the same event requires manual data entry in both systems. Alerts stay Active in ObserveOps even after technicians close the request in ServiceOps, creating a false picture of your operational health. This integration eliminates both gaps, keeping both platforms in sync automatically.
Part 1: Configure ObserveOps to Create Requests in ServiceOps
This part sets up Direction 1. You configure ObserveOps with the ServiceOps connection details and then configure which alert severity levels trigger request creation.
- Open the ServiceOps Integration Screen in ObserveOps.
In ObserveOps, navigate to Settings > Integration > Motadata ServiceOps to open the integration screen.
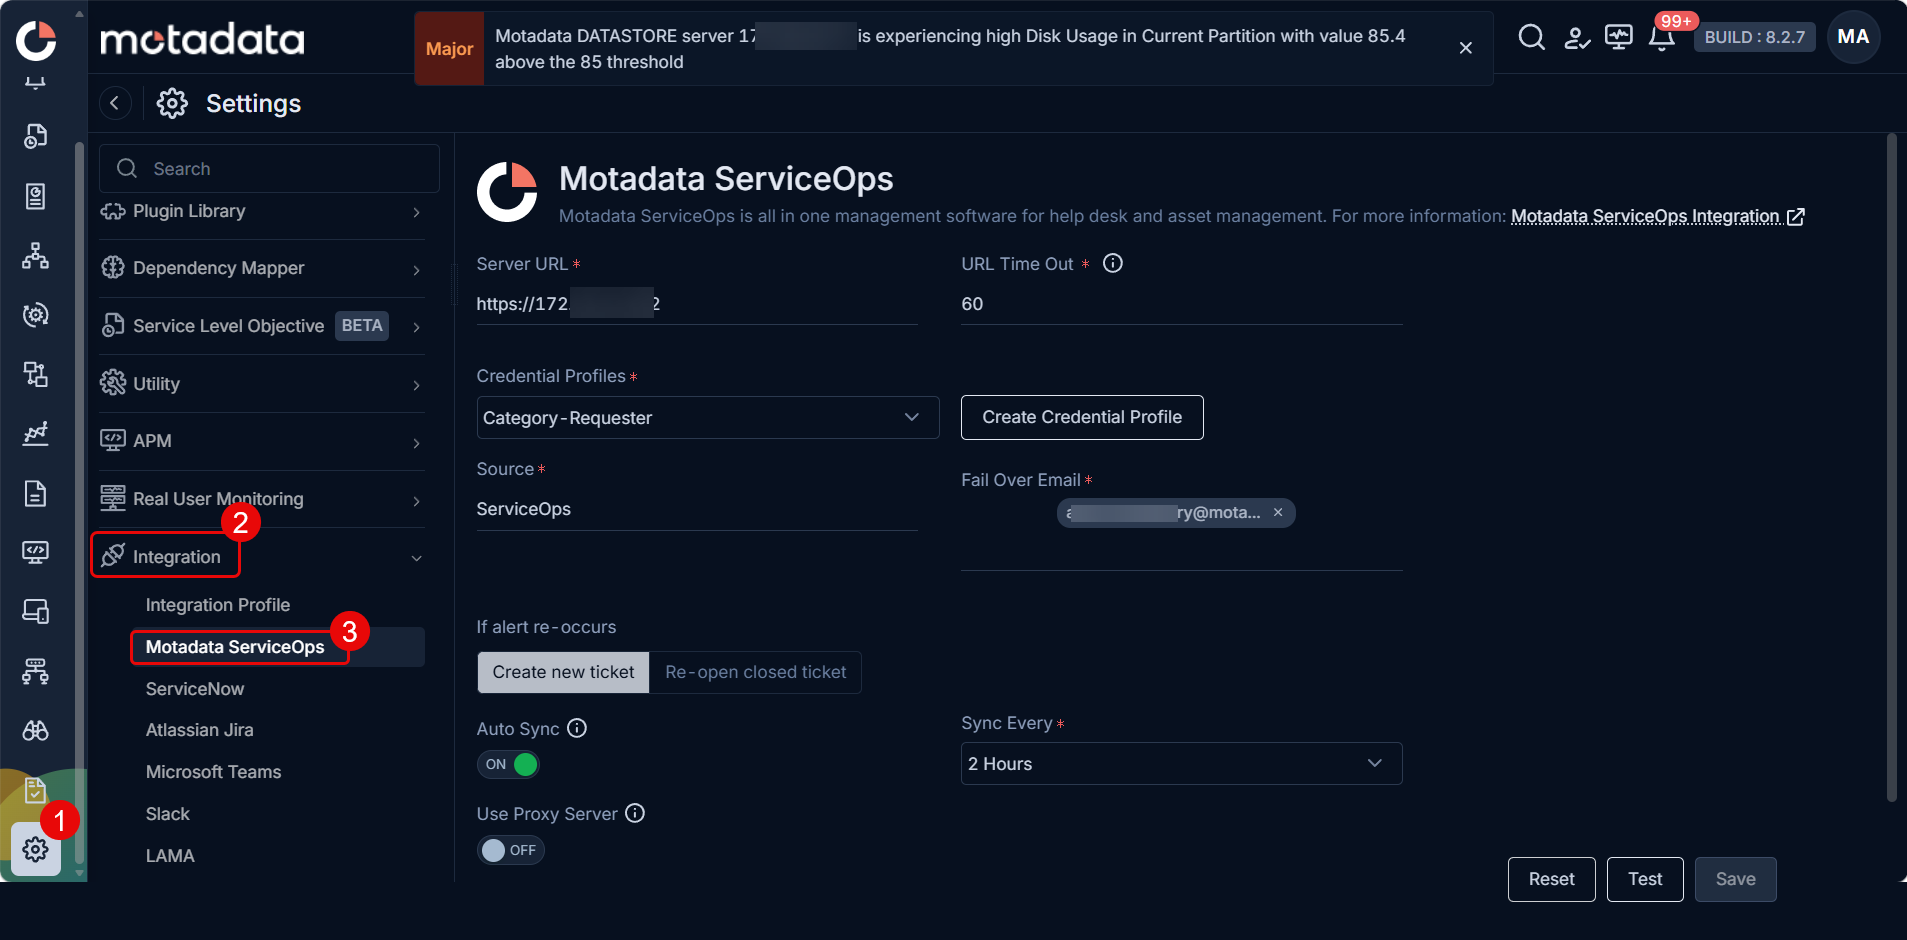
- Enter the Integration Configurations:
Fill in the following fields:
| Field | Description |
|---|---|
| Server URL | The URL of your ServiceOps server. |
| URL Timeout | The maximum wait time in seconds before the connection attempt times out. |
| Credential Profile | Select an existing credential profile from the drop-down, or click Create Credential Profile to create one using your ServiceOps Client ID and Client Secret. |
| Source | The source name you registered in ServiceOps (for example, ObserveOps). ObserveOps writes this value into the Source field on every request it creates in ServiceOps. |
| Failover Email | The email address that receives a notification if the integration disconnects. |
| If Alert Re-occurs | Controls what happens when an alert that already created a request occurs again: Create New Ticket opens a fresh request each time; Re-open Closed Ticket reopens the existing closed request instead. |
| Auto Sync | When enabled, ObserveOps automatically syncs ServiceOps metadata (Impact, Urgency, Category, Sub-Category, Technician) with the integration profile. Set the sync frequency using the Sync Every drop-down. Default is 2 hrs. |
| Use Proxy Server | Enable this if ObserveOps must connect to ServiceOps through a proxy. Confirm that proxy settings are configured under ObserveOps system settings before enabling. |
Click Test to verify the connection. Click Save to store the configuration.
Map Alert Severity to ServiceOps Priority
Go to Settings > Integration, open the ServiceOps integration profile you just saved, and locate the Field Mapping section. Under the Priority field, find the Severity → Impact & Urgency configuration.
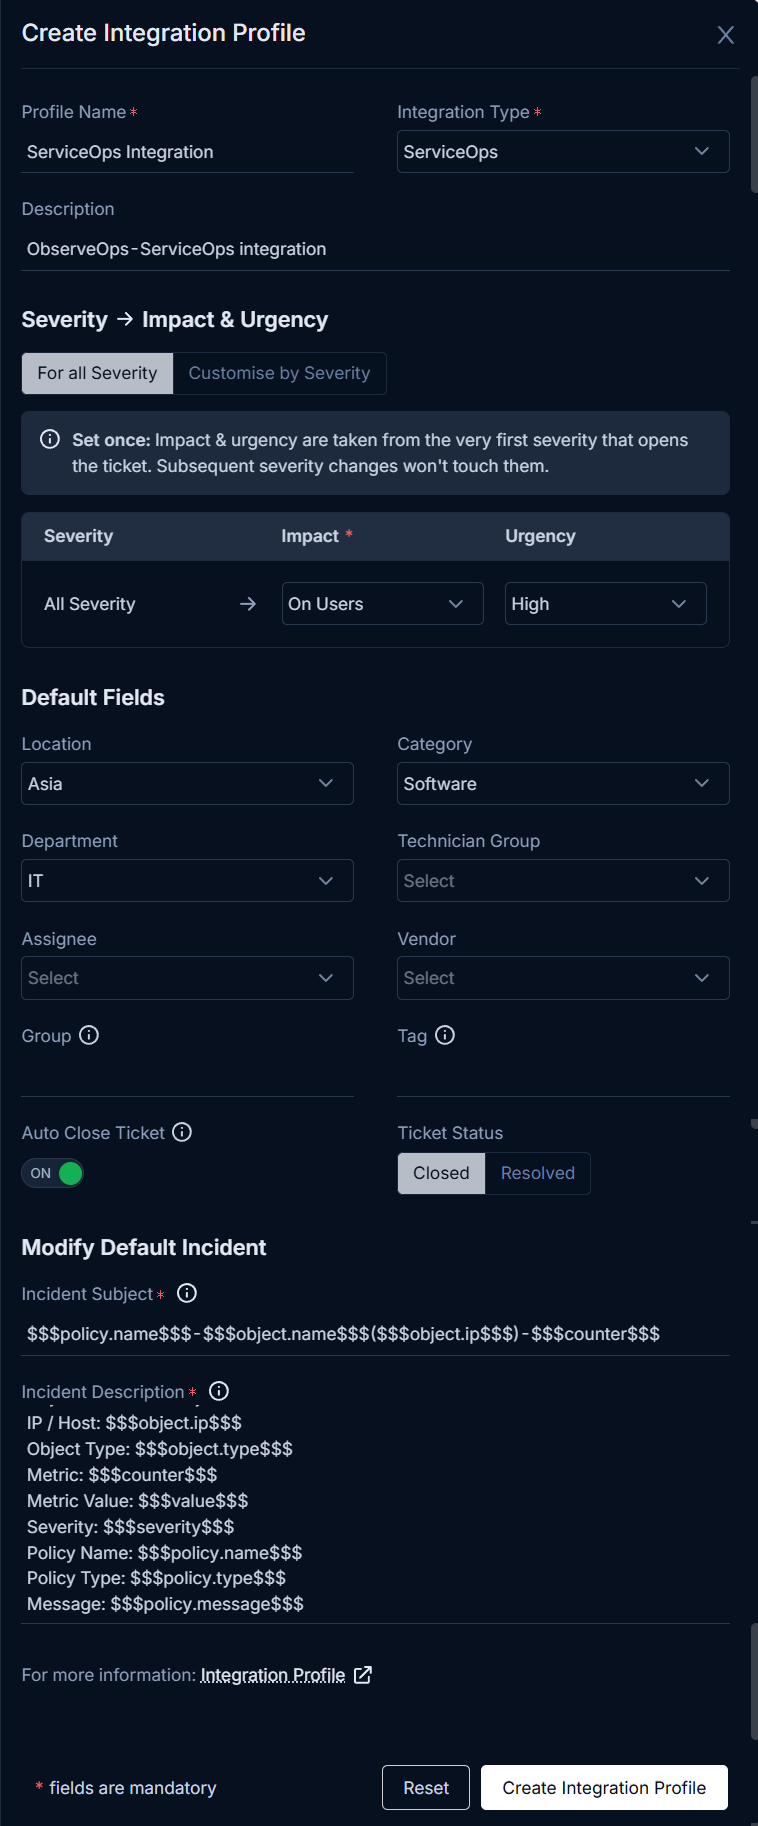
Choose how ObserveOps should set ticket priority using one of the two tabs:
Tab Behavior When to Use For all Severity Select Set now to lock Impact and Urgency at the values from the very first severity that opens the request. Subsequent severity changes do not update the ticket priority. Use when you want a stable priority regardless of alert fluctuation. Customise by Severity Define a different Impact and Urgency for each severity level. ObserveOps updates the ticket priority each time the alert severity changes, as long as the request remains open. Use when ticket priority should reflect real-time severity changes. In the Impact and Urgency columns, set a value for each ObserveOps severity level. Use the table below as a starting point and adjust it to match your organization's ServiceOps priority matrix:
ObserveOps Severity Suggested Impact Suggested Urgency Critical High High High High Medium Medium Medium Medium Low Low Low Click Save to apply the mapping.
If an alert severity flaps between levels (for example, toggling between Medium and Critical), Dynamic priority updates the request on every change. Use Lock if you want to prevent priority changes during unstable alert periods.
- Configure an Alert Policy to Declare Incidents
This step tells ObserveOps which alerts should create requests in ServiceOps and at what severity threshold.
In ObserveOps, navigate to Settings > Policy Settings. Open an existing policy or create a new one and locate the Declare Incident section.
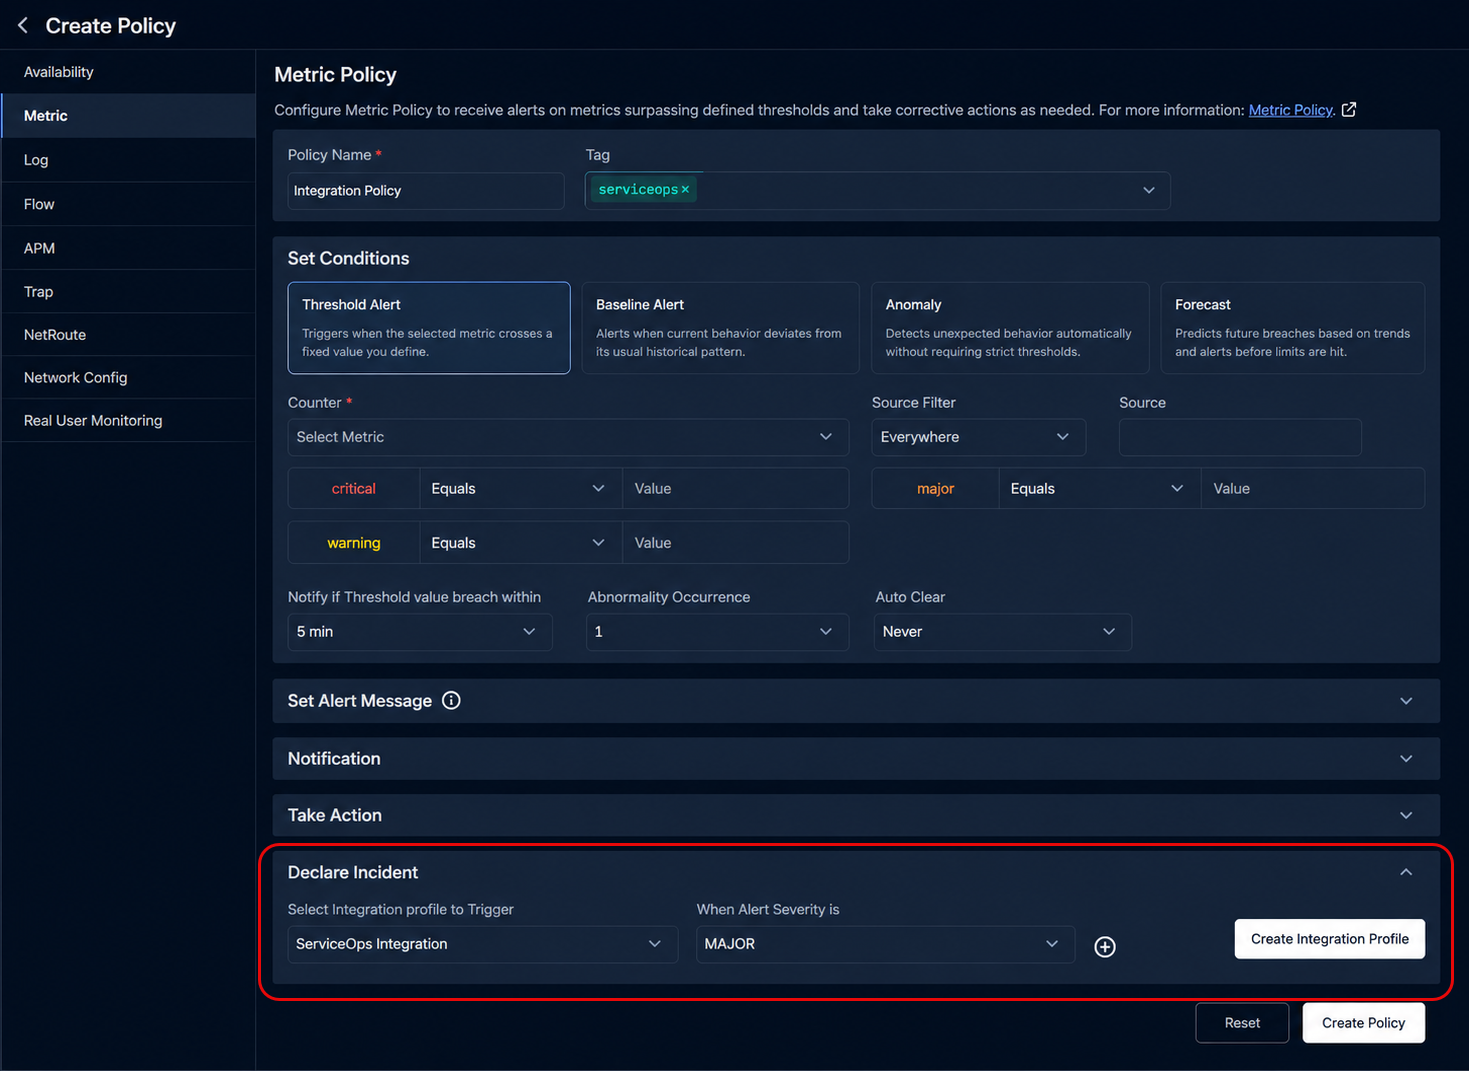
- Under Select Integration Profile to Trigger, select the ServiceOps integration profile you configured in Steps 1 and 2.
- Under When Alert Severity is, select the minimum severity level that triggers request creation. ObserveOps creates a request in ServiceOps when the alert reaches or exceeds this severity.
- Update or create the policy.
Example: If you set When Alert Severity is as Major and the profile as ServiceOps Integration, ObserveOps creates one ServiceOps request when the policy condition first triggers a Major alert and continues tracking it. It does not create a new request for every subsequent occurrence of the same alert. If the request is already closed or resolved in ServiceOps, you can configure ObserveOps to reopen the existing request or create a new one when the alert triggers again.
Direction 1 is now active. ObserveOps will create requests in ServiceOps whenever an alert meets your configured policy and severity conditions.
Part 2: Configure ServiceOps to Clear Alerts in ObserveOps
This part sets up Direction 2. You create a workflow in ServiceOps that calls the ObserveOps API whenever a technician closes a request that originated from ObserveOps.
Open the Workflow Configuration in ServiceOps.
Log in to ServiceOps as an administrator, navigate to Admin > Automation > Workflow, and click Create Workflow.
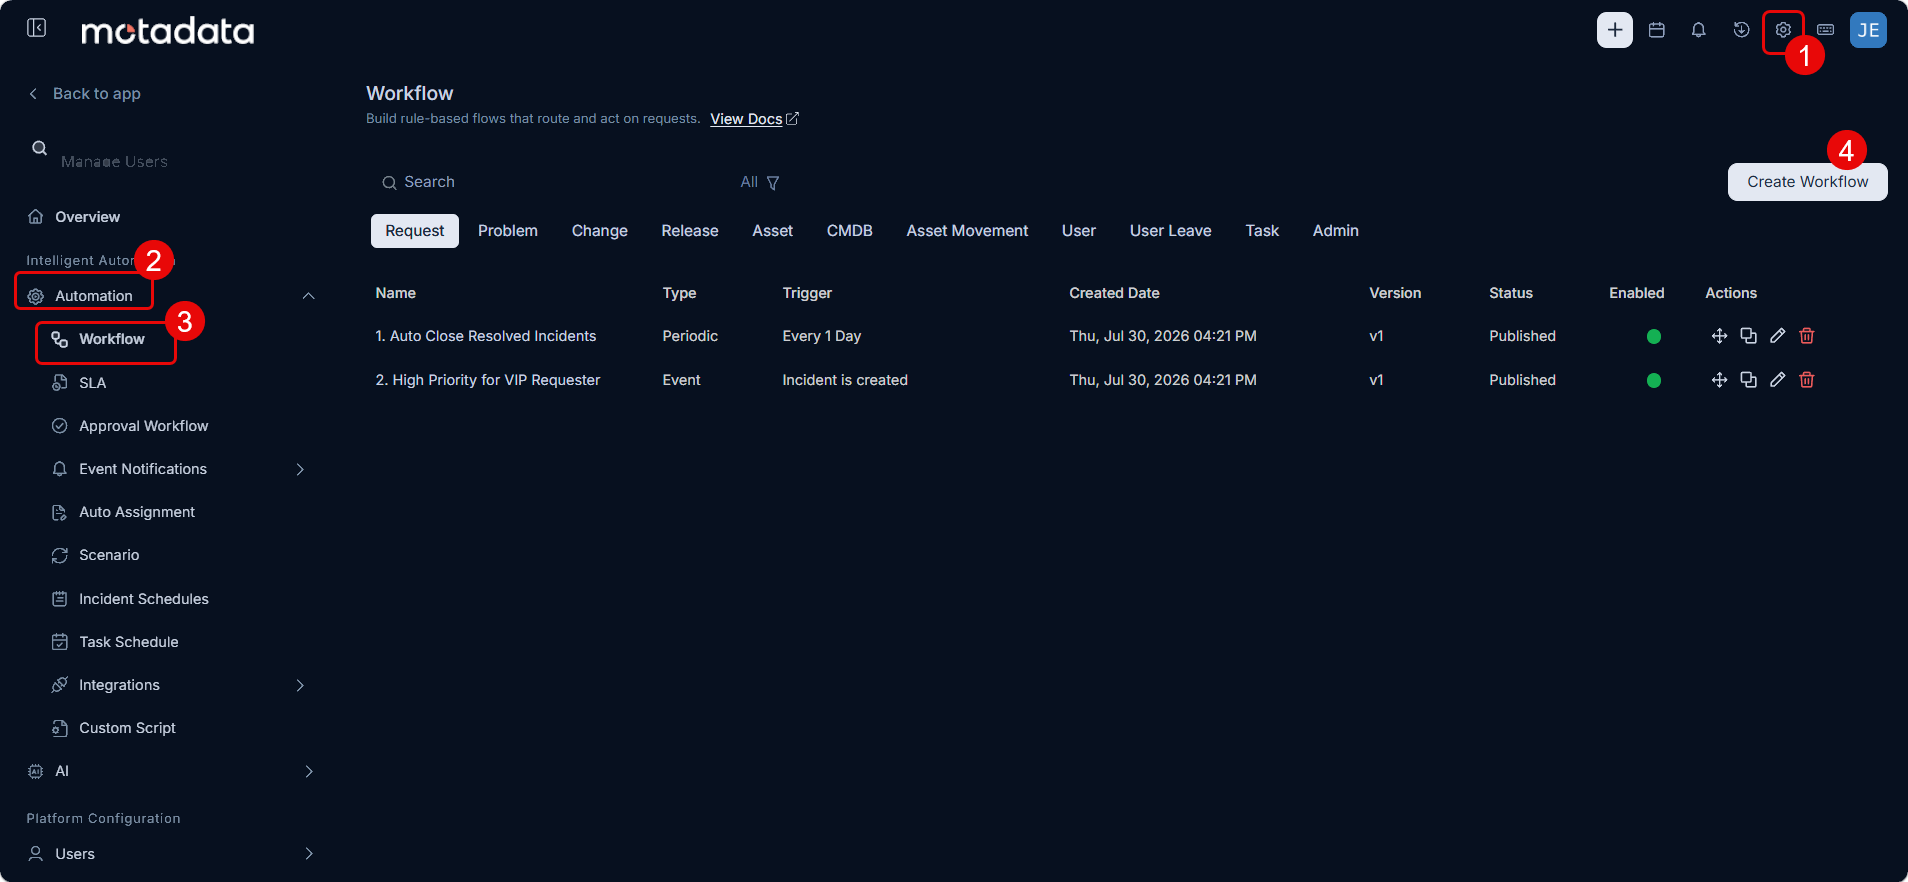
Name the Workflow and Configure the Trigger.
Enter a name for the workflow, such as
ObserveOps Alert Clear. In the Trigger panel on the right:- Set Select Workflow Type to Event. The Event type runs automatically when something happens, such as a status change.
- Set Select Module to Request.
- Under Trigger 1, set Select Attribute to Status is changed, set the From dropdown to Any, and set the To dropdown to Closed.
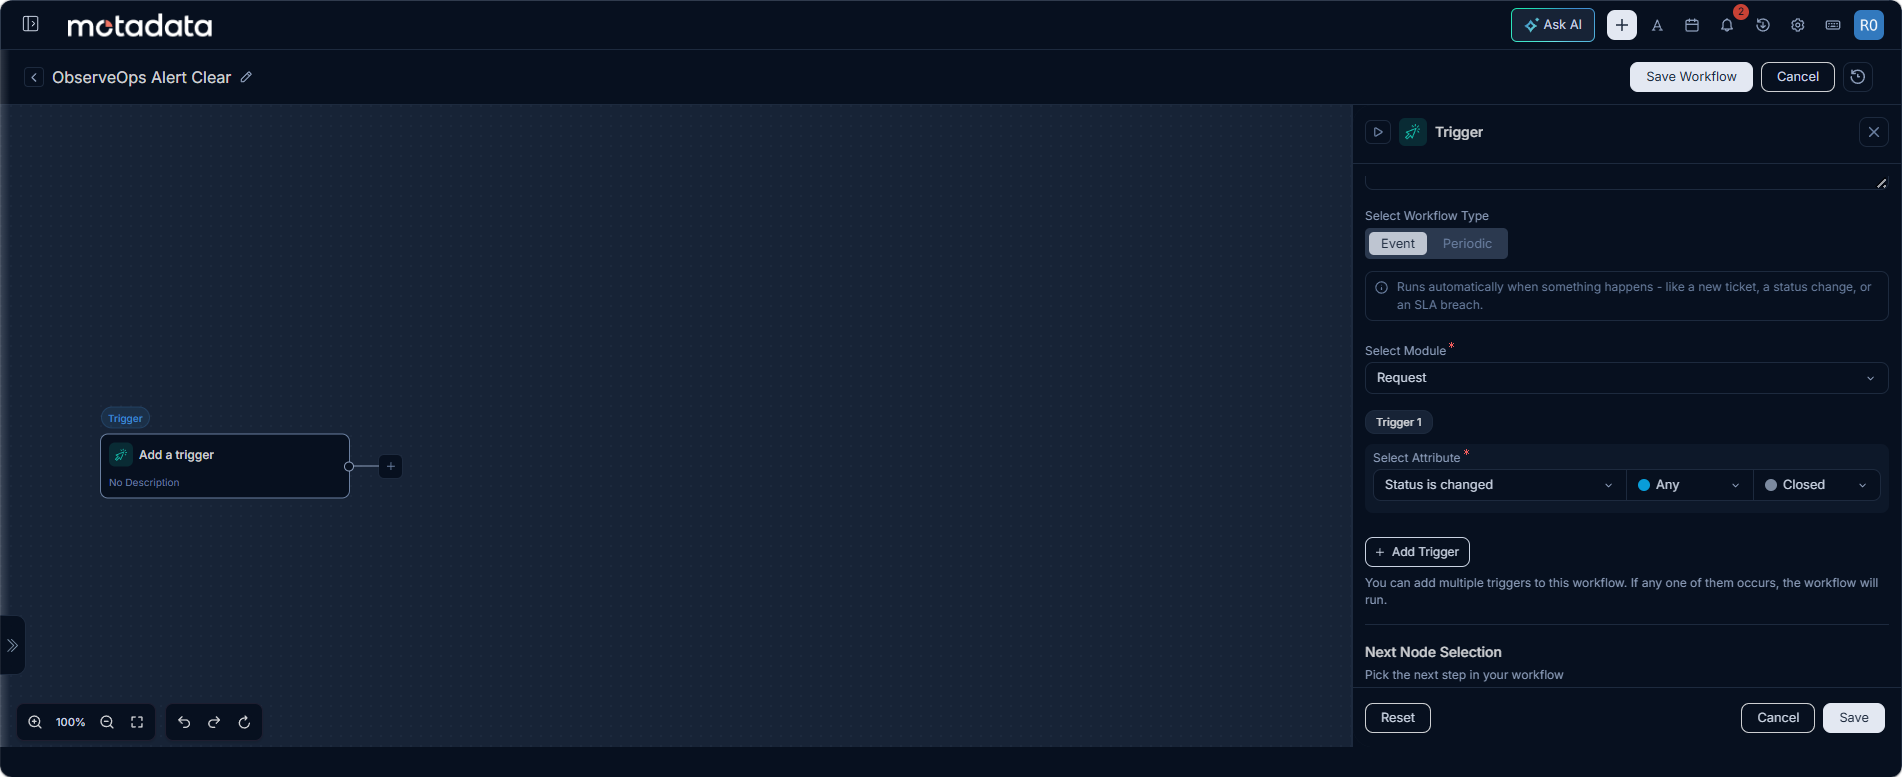
Click Save to confirm the trigger.
Add the Source Condition.
This condition limits the workflow to requests that ObserveOps created, so it does not fire on every closed request.
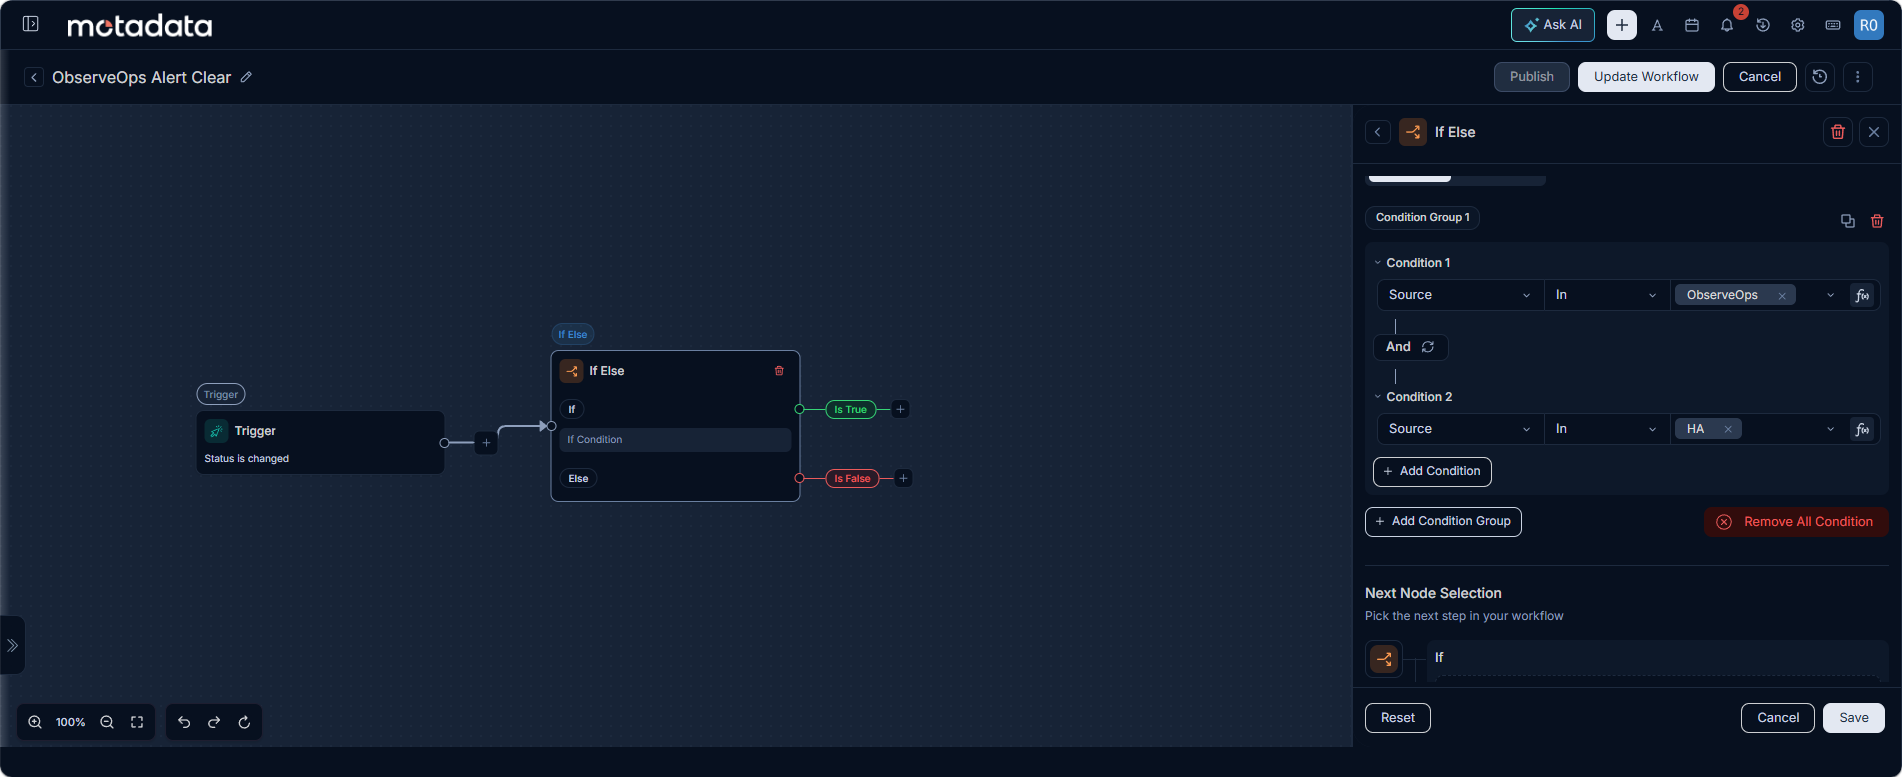
- Click the + icon on the workflow canvas and select Add Condition.
- In the Condition panel, set Condition to Source, Operator to In, and Value to ObserveOps and HA.
- Click Done.
Configure the Webhook Action.
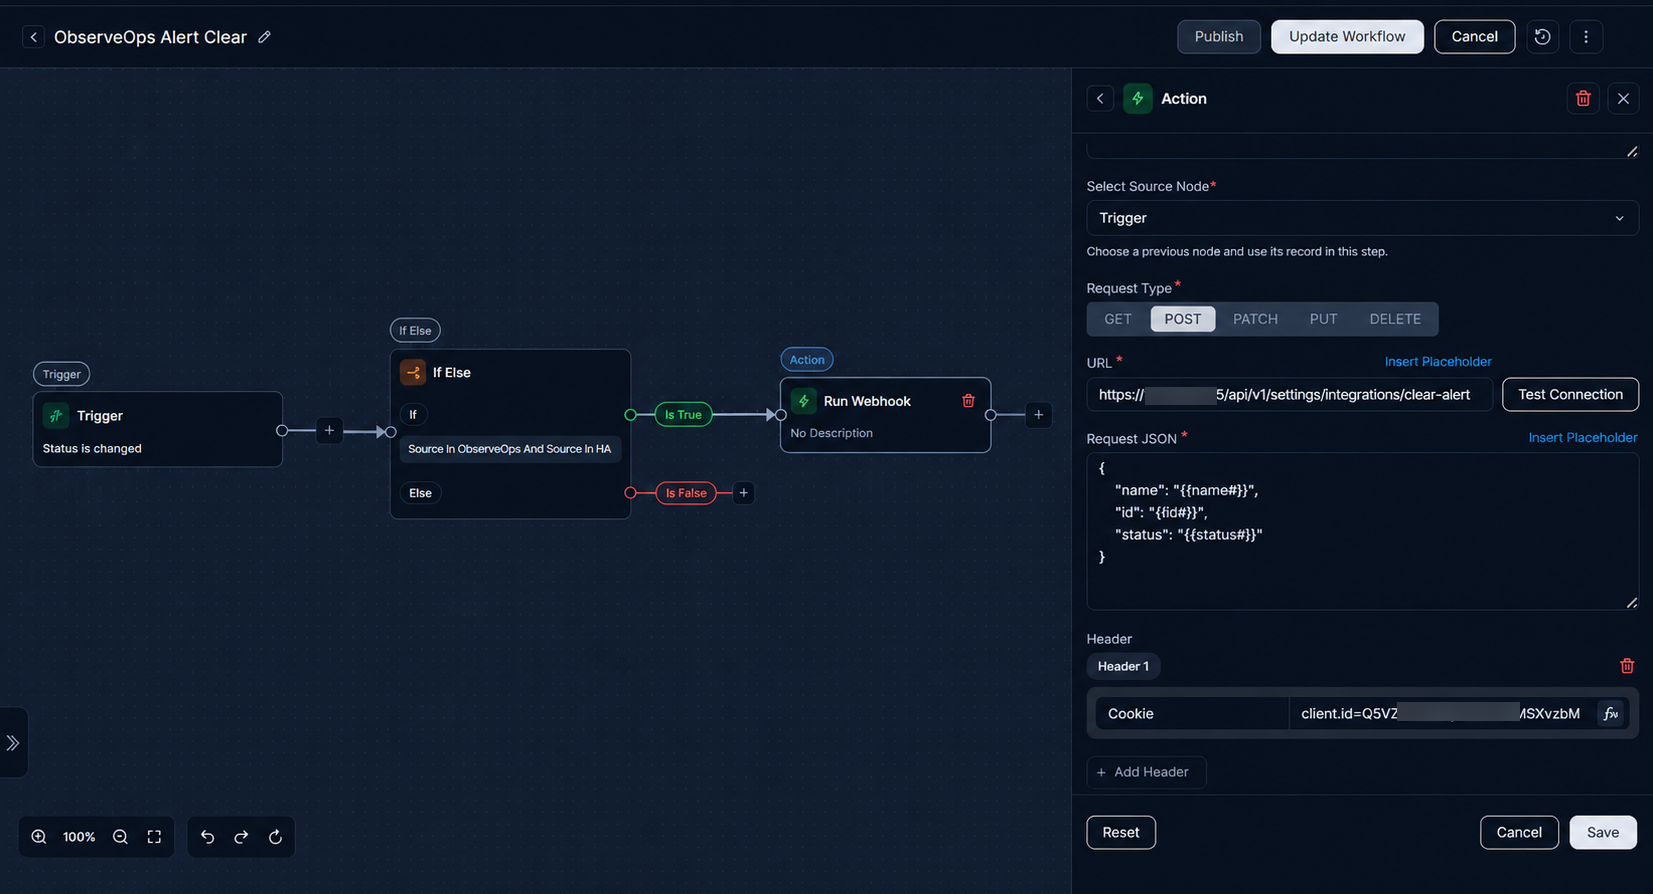
Click the + icon and select Action for Yes.
In the Action panel, select Run Webhook.
Set Request Type to POST.
Enter the webhook URL. Replace
MotadataServerIPwith your ObserveOps server IP address:https://MotadataServerIP/api/v1/settings/integrations/clear-alertOn-Premise DeploymentsFor on-premise ObserveOps installations, use the internal IP address of the ObserveOps server. For cloud-hosted ObserveOps, use the public hostname provided by your ObserveOps account.
In the Request JSON field, enter the following payload:
{
    "name": "{#name#}",
    "id": "{#id#}",
    "status": "{#status#}"
}
ServiceOps replaces each placeholder with the actual request values at runtime:
Placeholder Resolves To {#name#}The request name {#id#}The unique request ID {#status#}The request status at trigger time (Closed) Click Add Header. Set Key to
Cookieand Value to:client.id=Q5VZ97naQhyLIH0Vz4MSXvzbMyCYTjPwz+1hVJ643pA=Click Add Header again. Set Key to
Authorizationand Value to:Bearer <UserAccessKey>Replace
<UserAccessKey>with the access key from the Prerequisites section.Set Credential Type to No Auth.
Click Done.
Save and Activate the Workflow.
Review the trigger, condition, and action nodes on the canvas, then click Save Workflow.
Direction 2 is now active. Every time a technician closes a request with Source set to ObserveOps or HA, ServiceOps calls the ObserveOps API and the alert moves to Clear.
- Verify the Full Round-Trip
Run these verification steps to confirm both directions work correctly before using the integration in production.
- In ObserveOps, create a test alert that meets your policy severity threshold.
- Confirm a new request appears in ServiceOps with Source set to ObserveOps and the correct priority.
- Close the request in ServiceOps.
- Return to ObserveOps and confirm the alert status has moved to Clear.
If either direction fails, go to the Troubleshooting section below.
Real-World Scenario
A storage array at a branch office starts reporting disk errors. ObserveOps detects the issue and triggers a Critical alert. The alert matches the configured policy, so ObserveOps calls the ServiceOps API and creates a P1 Request with Source: ObserveOps, Impact: High, and Urgency: High. The on-call storage technician receives the request, investigates, replaces the faulty disk, and closes the request in ServiceOps. The ServiceOps workflow fires, calls the ObserveOps API, and the alert moves to Clear. Both platforms now show the incident as resolved. No one logged in to ObserveOps to manually update the alert.
Webhook Configuration Reference
| Field | Value | Description |
|---|---|---|
| Request Type | POST | Sends data to the ObserveOps clear-alert endpoint |
| URL | https://MotadataServerIP/api/v1/settings/integrations/clear-alert | ObserveOps API endpoint that transitions the alert to Clear |
| Request JSON | See Step 9 | Payload carrying the request name, ID, and status |
| Cookie Key | client.id | Session identifier specific to your ObserveOps instance |
| Authorization Key | Bearer <UserAccessKey> | Token identifying the ServiceOps integration user account |
| Credential Type | No Auth | Authentication is handled via the Authorization header |
Best Practices
- Test each direction independently before testing the full round-trip. Confirm Direction 1 works by checking that a test alert creates a request in ServiceOps. Confirm Direction 2 works by manually closing a test request and checking the ObserveOps alert status.
- Use a dedicated ServiceOps user account for the webhook. Avoid using a personal user's access key. Create a named service account, assign minimum required permissions, and rotate the access key on a schedule.
- Set the Source condition precisely. The workflow condition restricts Direction 2 to requests with Source = ObserveOps or HA. Do not change this to Any. Doing so causes the workflow to call the ObserveOps API on every closed request.
- Choose Lock priority for volatile alert environments. If your monitoring environment produces alerts that flap between severity levels, use Lock Priority to prevent unnecessary priority changes on open requests.
- Enable Auto Sync. Turning on Auto Sync in the ObserveOps integration profile keeps ServiceOps metadata (Category, Sub-Category, Technician groups) in sync automatically. Set the sync interval to match your change management cadence.
- Configure a Failover Email. Enter a monitored email address in the ObserveOps integration profile. If the integration disconnects, the Failover Email is your first notification that the automated flow has stopped.
- Monitor workflow execution logs. Go to Admin > Automation > Workflow in ServiceOps and check the execution log for the ObserveOps Alert Clear workflow regularly to detect failed API calls.
Known Limitations
- Direction 2 only fires on request closure. Reopening a request in ServiceOps does not reopen the alert in ObserveOps. The workflow trigger is Status Changed to Closed only.
- No bidirectional priority sync. When a technician updates the priority of a request in ServiceOps, the change is not reflected in ObserveOps. Priority flows only from ObserveOps to ServiceOps at creation time (or on severity change if Dynamic is enabled).
- The
client.idcookie is instance-specific. Each ObserveOps installation has a uniqueclient.idvalue. Using the wrong value causes the webhook to fail silently. Obtain the correct value from your ObserveOps administrator. - Alert matching uses the request ID. The ObserveOps API matches the incoming request to an alert using the
{#id#}field in the JSON payload. If the request ID changes (for example, after a re-import or data migration), the alert-to-request link breaks. - The workflow fires once per closure event. If a request is closed, reopened, and closed again, the webhook fires a second time and sends a second clear-alert call to ObserveOps.
- Auto Sync does not cover all ServiceOps fields. The Auto Sync feature syncs Impact, Urgency, Category, Sub-Category, and Technician metadata. Custom fields and SLA rules are not synced automatically.
Troubleshooting
This section covers common issues in both directions of the integration.
ObserveOps is not creating requests in ServiceOps when alerts fire
Cause: The integration profile in ObserveOps is misconfigured, the credential profile has an invalid Client ID or Client Secret, or the alert policy is not mapped to the ServiceOps integration profile.
Fix: Open the ServiceOps integration screen in ObserveOps (Settings > Integration > Motadata ServiceOps) and click Test. If the test fails, verify the Server URL and regenerate or re-enter the credentials in the Credential Profile. Also confirm the alert policy's Declare Incident section references the correct integration profile and severity level.
Requests created in ServiceOps have the wrong priority
Cause: The Impact and Urgency mapping in the ObserveOps Field Mapping section does not align with the ServiceOps priority matrix, or the Priority behavior is set to Lock when Dynamic was intended.
Fix: Open the integration profile in ObserveOps and go to Field Mapping. Adjust the Impact and Urgency values for each severity level to match your ServiceOps priority matrix. If priority should update as severity changes, switch the Priority behavior from Lock to Dynamic and save.
The ServiceOps webhook fires but the ObserveOps alert does not clear
Cause: The Authorization header contains an incorrect or expired access key, the client.id cookie value is wrong, or the ObserveOps server IP address in the URL is invalid.
Fix: Open the workflow in Admin > Automation > Workflow and check the Run Webhook action. Confirm the URL uses the correct ObserveOps server IP. Retrieve the latest access key from Admin > User Management > Users and update the Authorization header value. Confirm the client.id cookie value with your ObserveOps administrator.
The ServiceOps workflow fires for all closed requests, not just ObserveOps ones
Cause: The Source condition is missing or incorrectly configured on the workflow.
Fix: Open the workflow in Admin > Automation > Workflow and go to the Condition tab. Confirm Condition is set to Source, Operator is In, and Value includes ObserveOps and HA. Add the condition if it is absent and save the workflow.
The webhook returns a 401 Unauthorized error
Cause: The access key in the Authorization header has expired or the user account it belongs to has been deactivated.
Fix: Navigate to Admin > User Management > Users in ServiceOps and open the integration user account. Regenerate the access key, update the Authorization header in the workflow action, and save the workflow.
The integration disconnects intermittently and the Failover Email is not receiving alerts
Cause: No email address is configured in the Failover Email field of the ObserveOps integration profile, or the email address is incorrect.
Fix: Open the ServiceOps integration profile in ObserveOps (Settings > Integration > Motadata ServiceOps) and enter a valid, monitored email address in the Failover Email field. Save the configuration. Confirm the email address belongs to a monitored inbox, not an unmonitored alias.
Next Steps
- Review the Workflow Automation guide to add additional conditions or actions to the ObserveOps Alert Clear workflow.