Traceroute — Hop-by-Hop Path Analysis in ObserveOps
Traceroute maps the network path from the assigned Collector to any target device in ObserveOps . You see every hop, its IP address, and its response time — helping you pinpoint exactly where latency or packet loss occurs in the path.
Prerequisites
- You must have the Admin or NOC role.
- The Collector must have network access to the target device.
- An IPv4 address, IPv6 address, or resolvable hostname is required.
How It Works
ObserveOps sends probe packets with incrementing TTL values from the Collector toward the target. Each router that drops a packet due to TTL expiry sends back an ICMP Time Exceeded message, revealing its IP and response time. ObserveOps collects these responses hop by hop and displays the full path in sequence.
Navigation
Go to Main Menu > Settings > Utility > Traceroute.
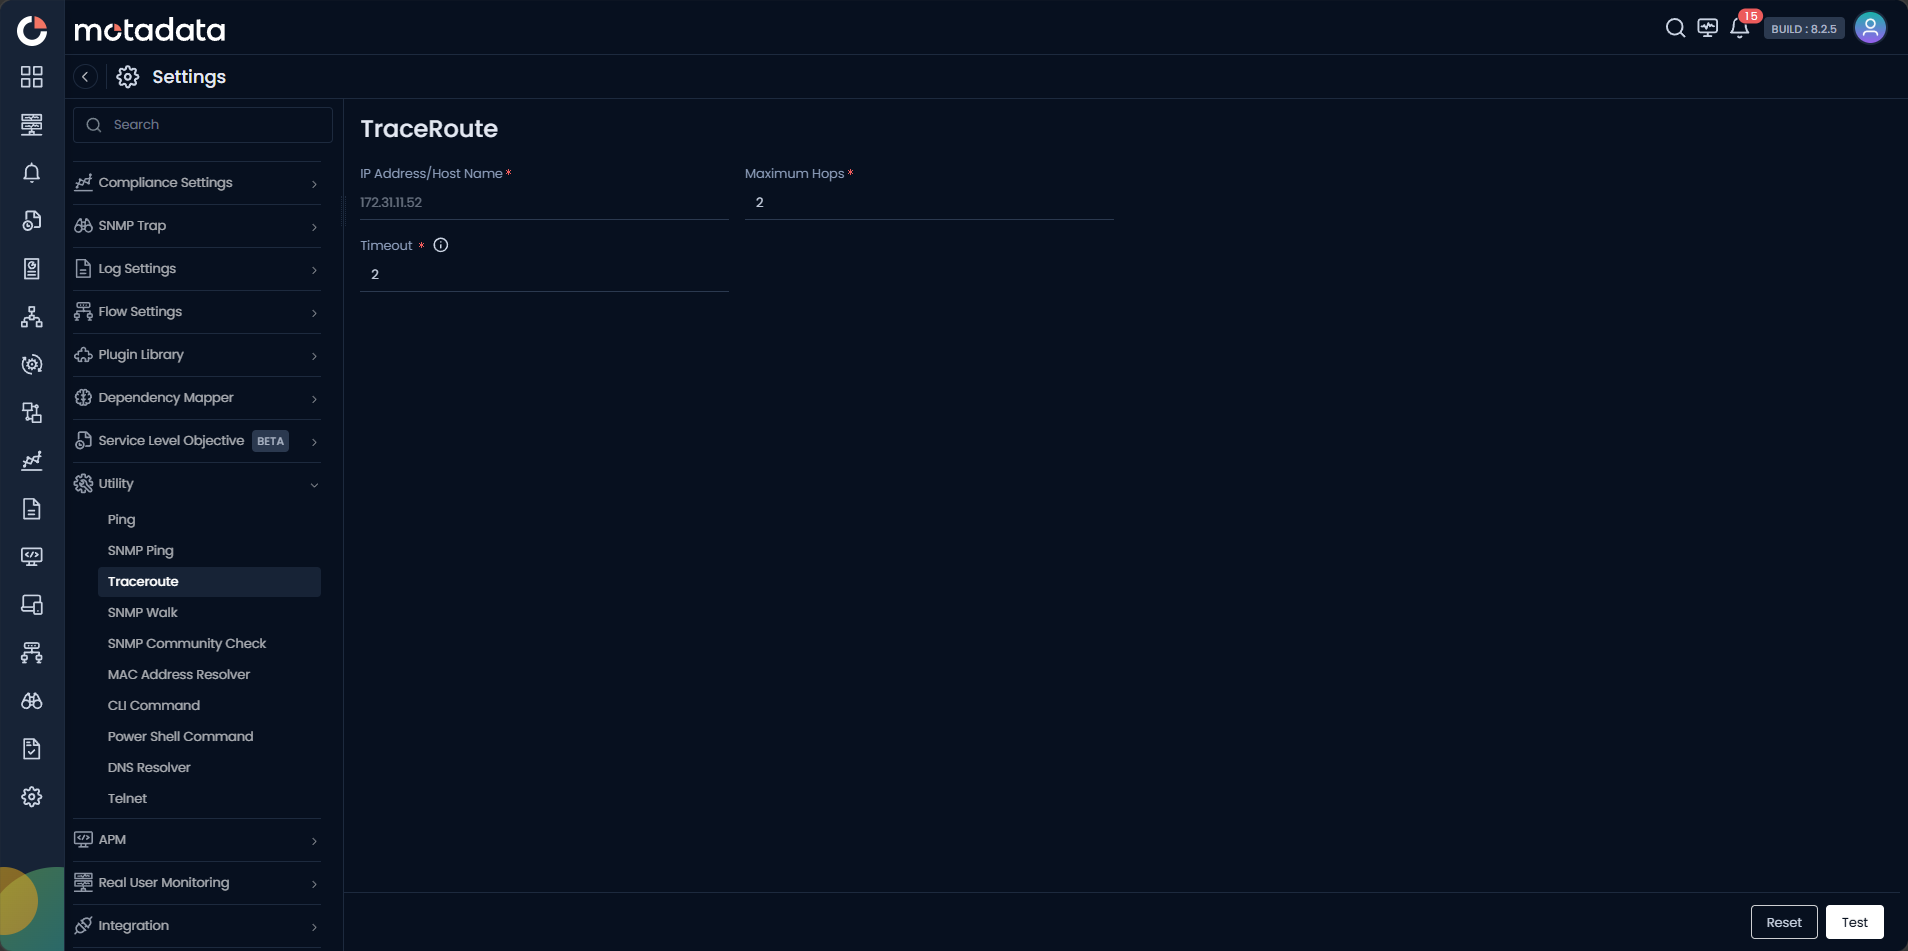
Running a Traceroute
| Field | Description |
|---|---|
| IP Address / Host Name | Enter the IPv4 address, IPv6 address, or FQDN of the destination device. |
| Maximum Hops | Set the maximum number of hops before the trace stops. |
| Timeout | Set how long to wait for each hop's response before marking it as a timeout. |
Click Test to start the trace. Click Reset to clear the form.
A * * * at an intermediate hop does not always indicate a problem. Many routers are configured to drop probe packets silently. Check whether hops after it respond normally before concluding there is an issue at that point.
Example
An alert triggers showing high latency to a branch office firewall. A NOC engineer runs Traceroute from the Collector nearest to the branch. Hops 1 through 4 respond with under 5 ms each, but hop 5 shows 280 ms and subsequent hops time out. The engineer identifies the ISP handoff at hop 5 as the bottleneck and opens a ticket with the carrier.