SLO Explorer in ObserveOps
SLO (Visualization)
The SLO Visualization module in Motadata AIOps provides a comprehensive view of all configured Service Level Objectives. It helps track real-time compliance status, visualize historical trends, and monitor individual device-level performance against defined objectives.
This screen enables users to understand the overall health of services through multiple visual elements such as compliance scores, error budgets, violation timelines, and burn rate graphs. Both Availability and Performance SLOs are supported with dedicated widgets and filters.
Card View
Upon navigating to the SLO module from the main menu tray, the default view shows a card view displaying key SLO metrics in a condensed widget format for faster visual assessment.
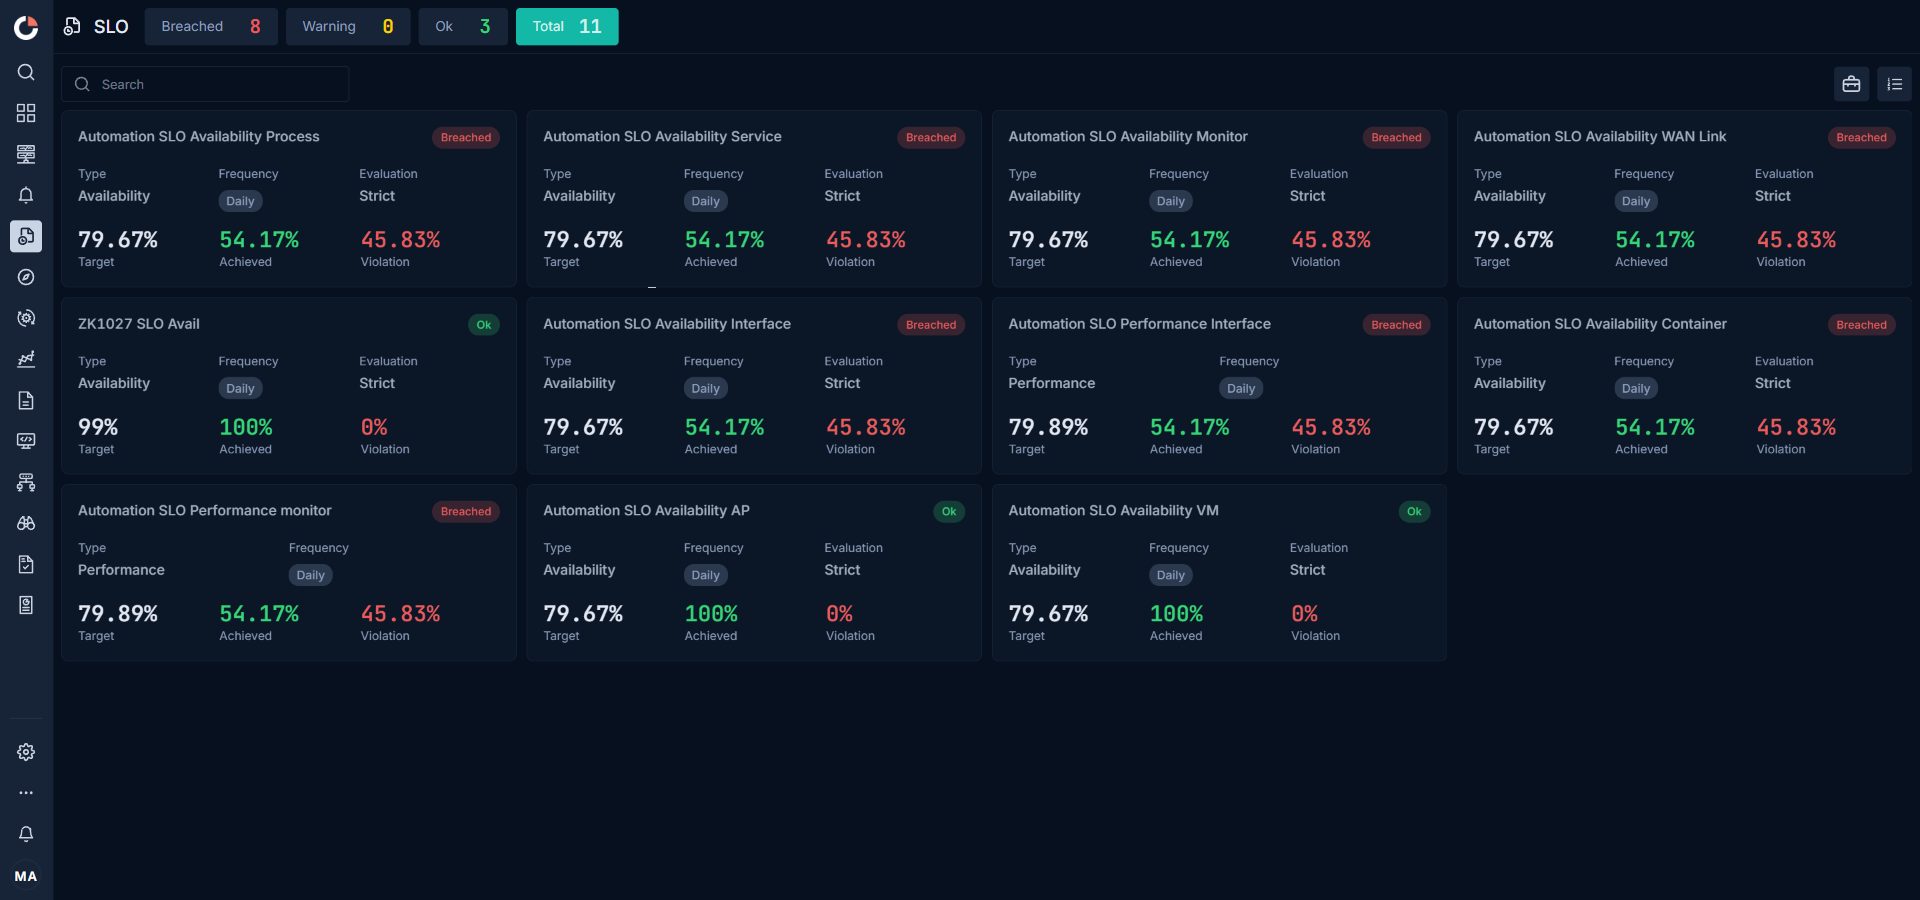
Each card lists:
- Name and Status (OK, Warning, Breached).
- Type — Availability or Performance.
- Frequency — Daily, Weekly, Monthly, Quarterly.
- Evaluation — Strict or Redundant. Shown only for Availability SLOs; Performance cards omit this row.
- Target, Achieved, and Violation percentages.
Select Group by Business Service in the toolbar to group all cards under their business service, with a header showing the business service name, the SLO count, and the rolled-up status. Select Ungroup to flatten the layout.
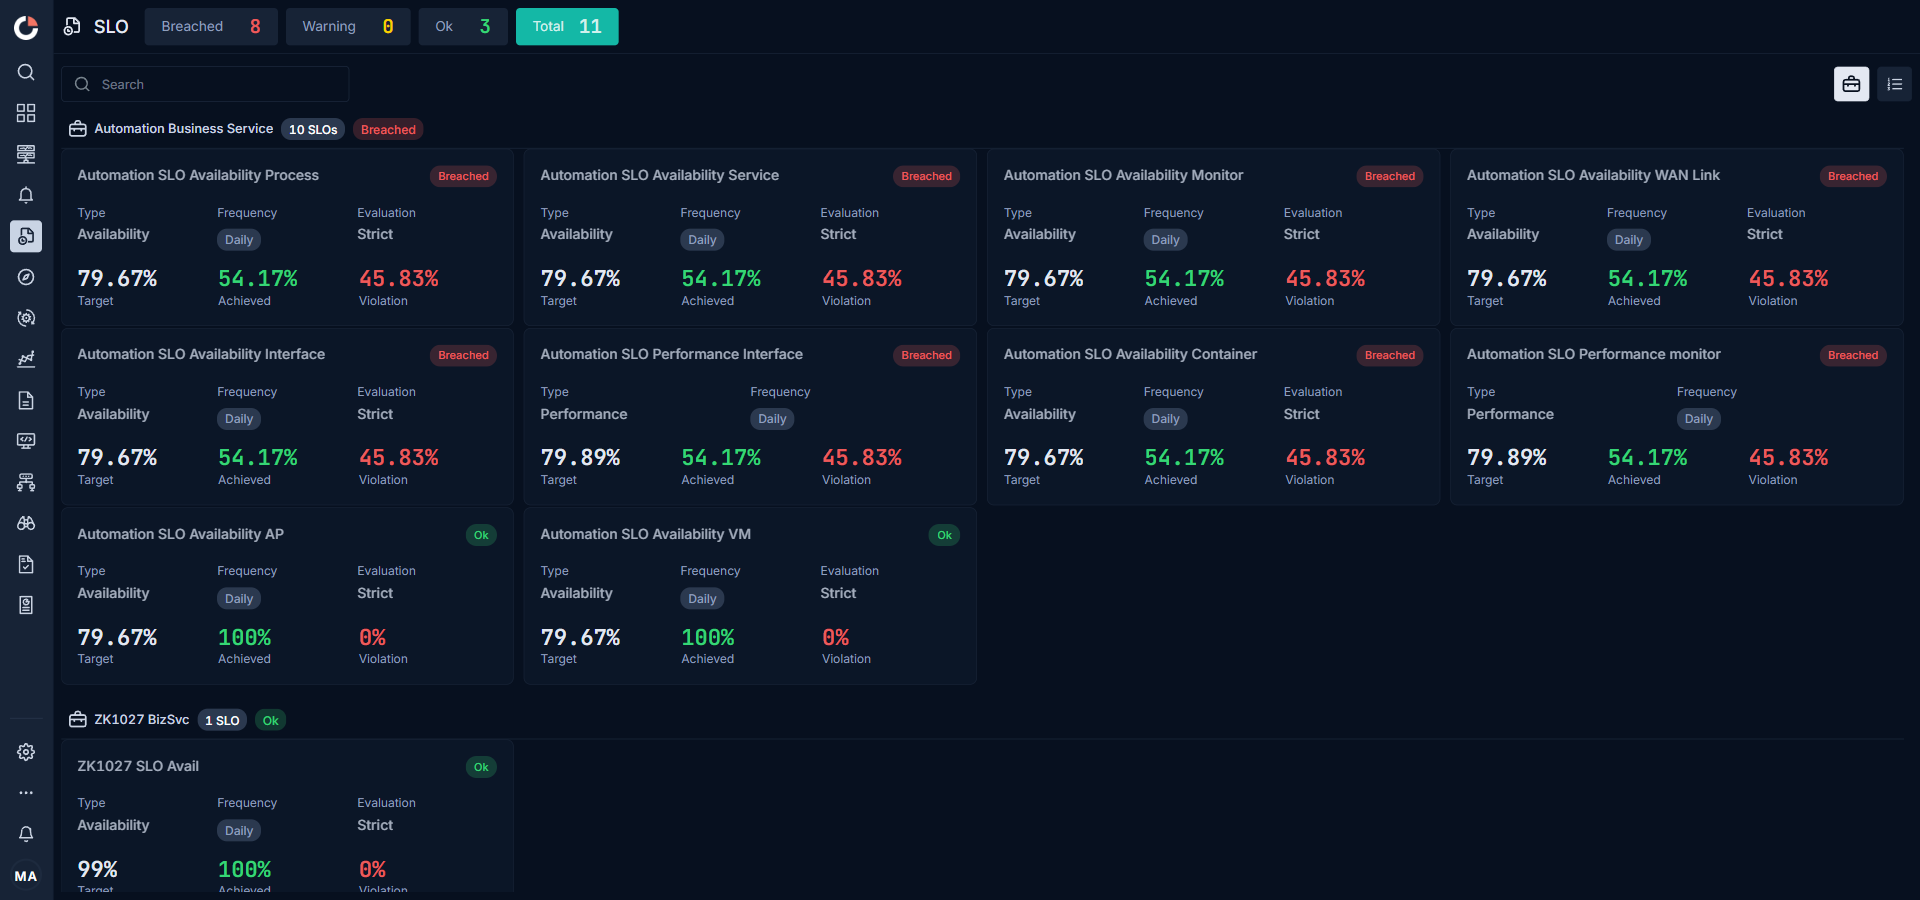
The number next to the business service header is the total count of SLOs under that business service, and the status shown is the most severe severity across every SLO inside that group: Breached if any SLO is breached, otherwise Warning if any is warning, otherwise OK.
Grid View
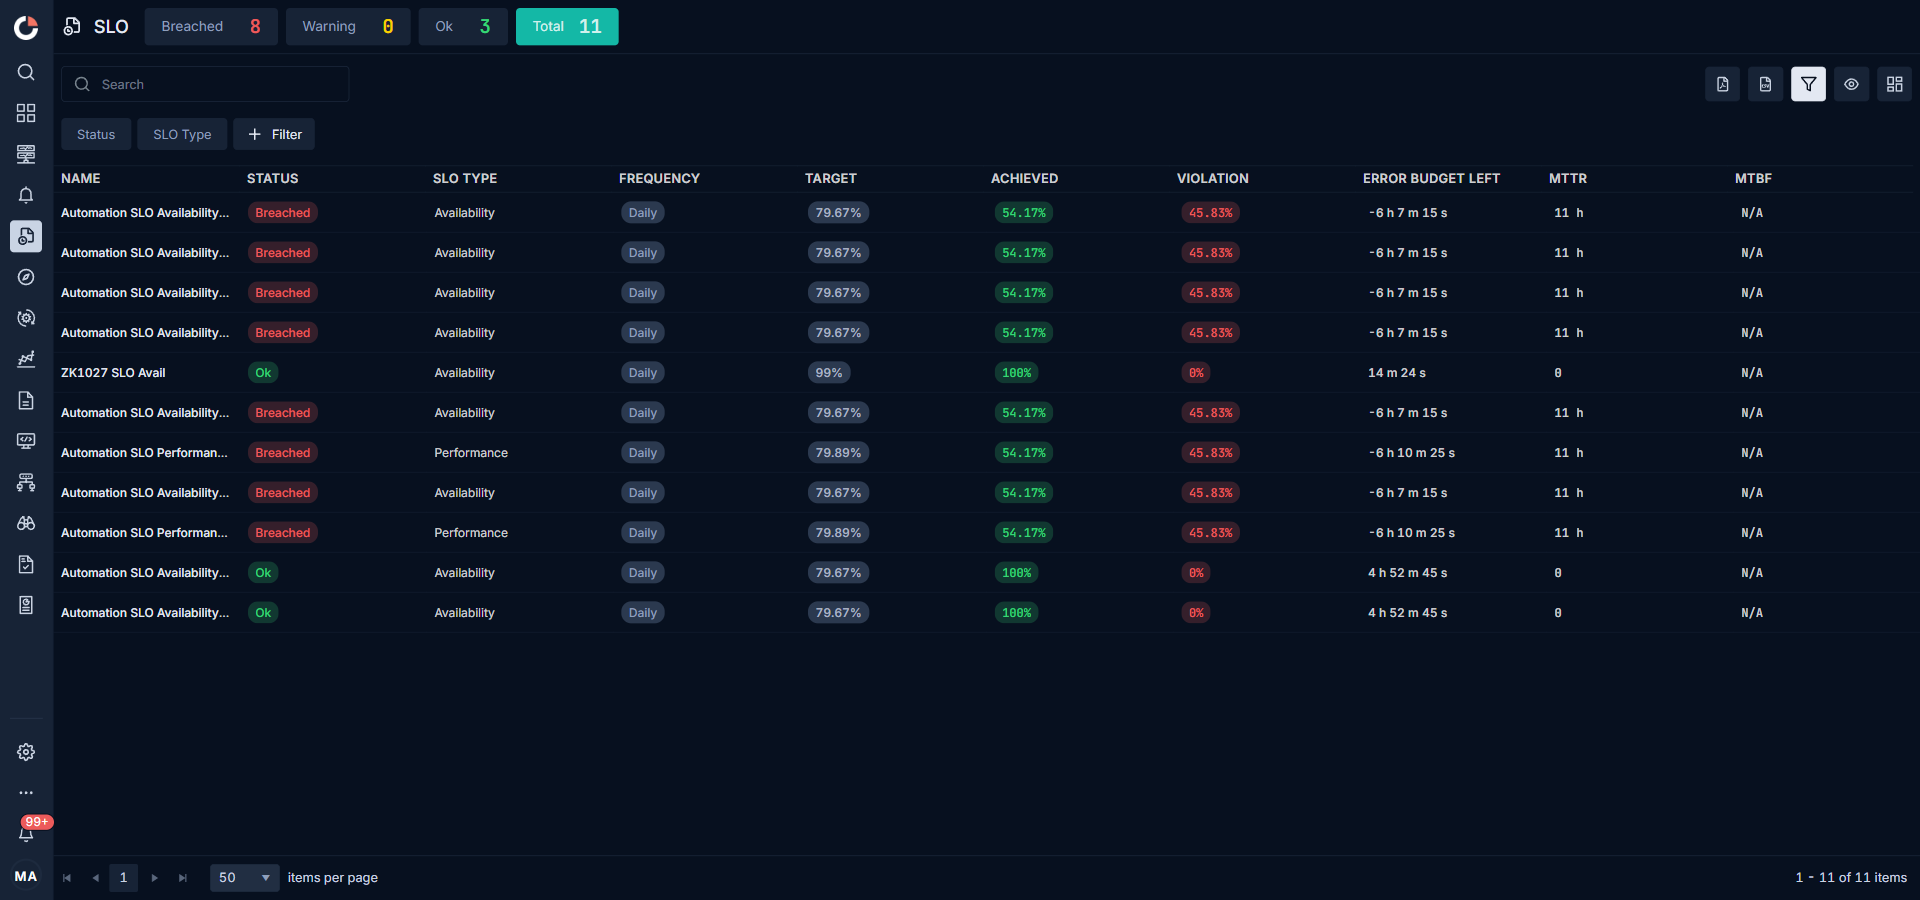
Switch from the Dashboard (card) layout to the Grid layout using the Grid button on the top-right side of the toolbar above the module content. In Grid view, the same toggle is labelled Dashboard, and you can switch back at any time.
Grid View Toolbar
The toolbar above the grid provides these controls:
| Control | Purpose |
|---|---|
| Search | Search across all SLOs in the grid by any visible column value. |
| Export As PDF | Export the current filtered grid to a PDF file. |
| Export As CSV | Export the current filtered grid to a CSV file. |
| Filter | Show or hide the filter chip row above the grid. Applied filter chips appear here along with the option to add more. |
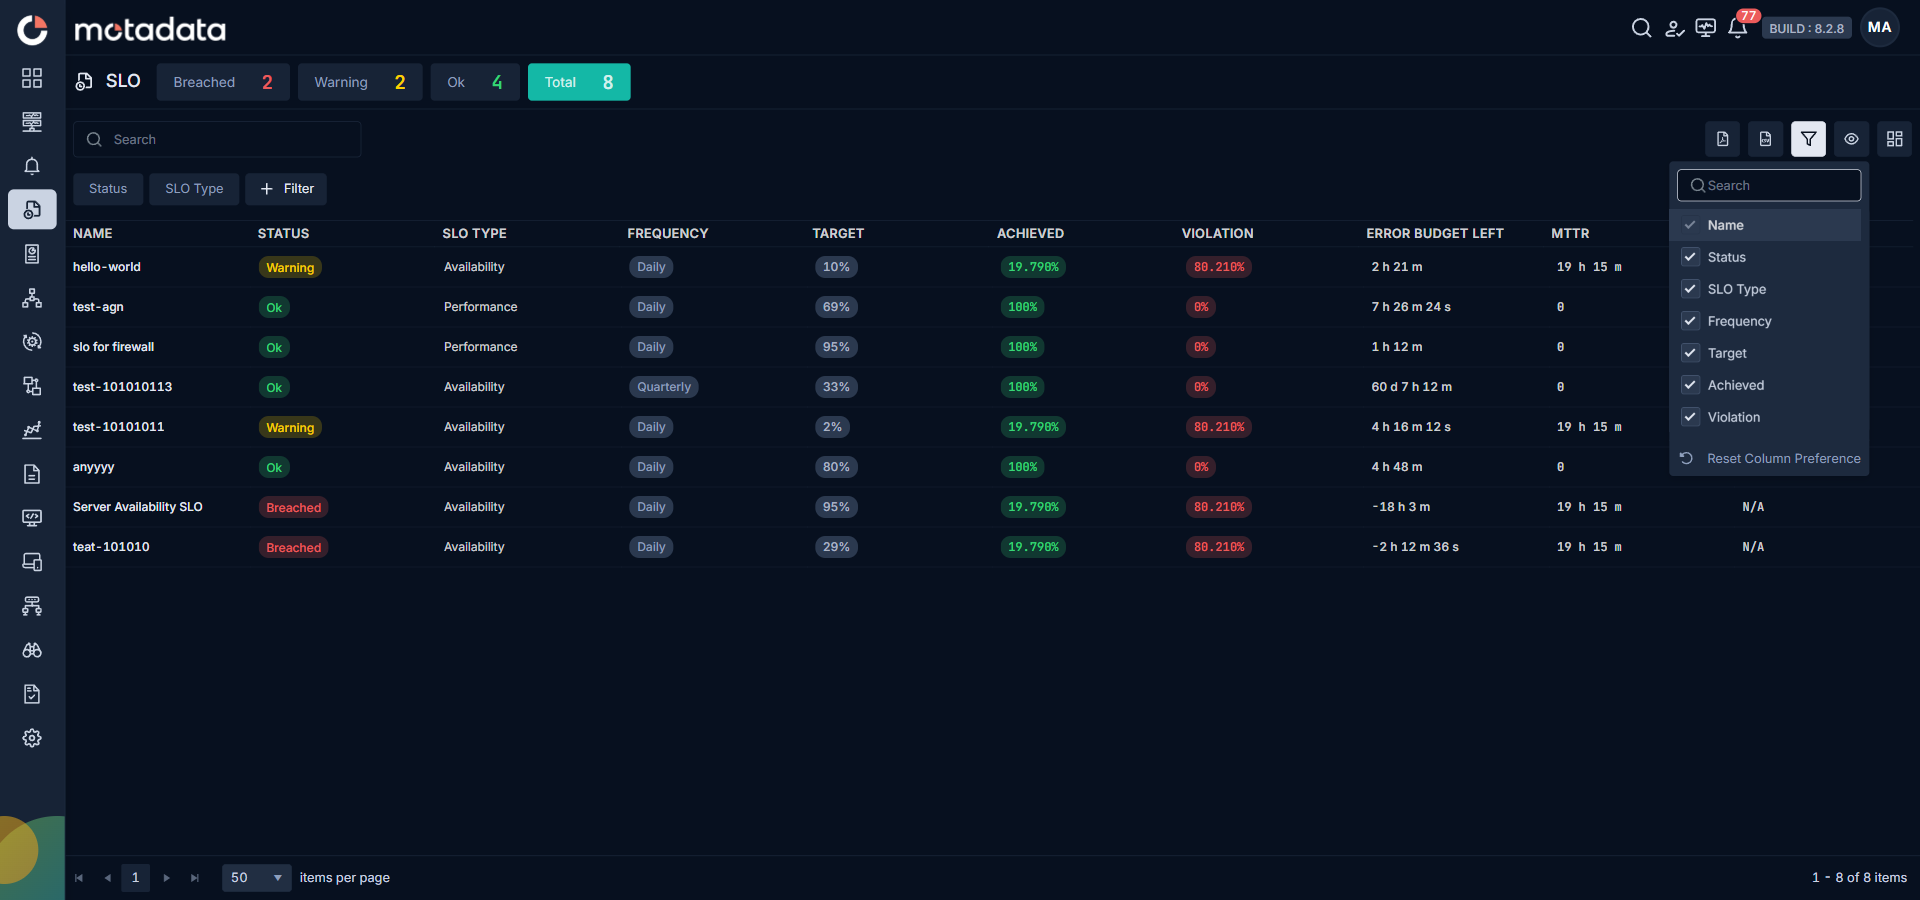
| Column Customizer | Show or hide individual grid columns. Includes a Reset Column Preference option to restore the default column set. |
| Dashboard | Switch the view back to the Dashboard (card) layout. |
Grid View Fields
The following fields are displayed in the grid view of the SLO module:
| Field | Description |
|---|---|
| Name | Name of the Service Level Objective (SLO). |
| Status | Indicates the current status of the SLO. Possible values: OK, Warning, Breached. |
| SLO Type | Type of the SLO. Possible values: Availability or Performance. |
| Frequency | Evaluation frequency of the SLO. Supported options: Daily, Weekly, Monthly, Quarterly. |
| Target | The defined SLO threshold percentage that must be achieved. |
| Achieved | The actual percentage achieved within the current evaluation window. |
| Violation | Percentage of time the SLO target was not met. |
| Error Budget Left | Remaining value of allowed failure time within the SLO period. |
| MTTR | Mean Time To Recovery for the SLO (shown for Availability SLOs). |
| MTBF | Mean Time Between Failures for the SLO (shown for Availability SLOs). |
You can filter SLOs by status using the buttons (Breached, Warning, Ok or Total) above the grid.
Filtering SLOs
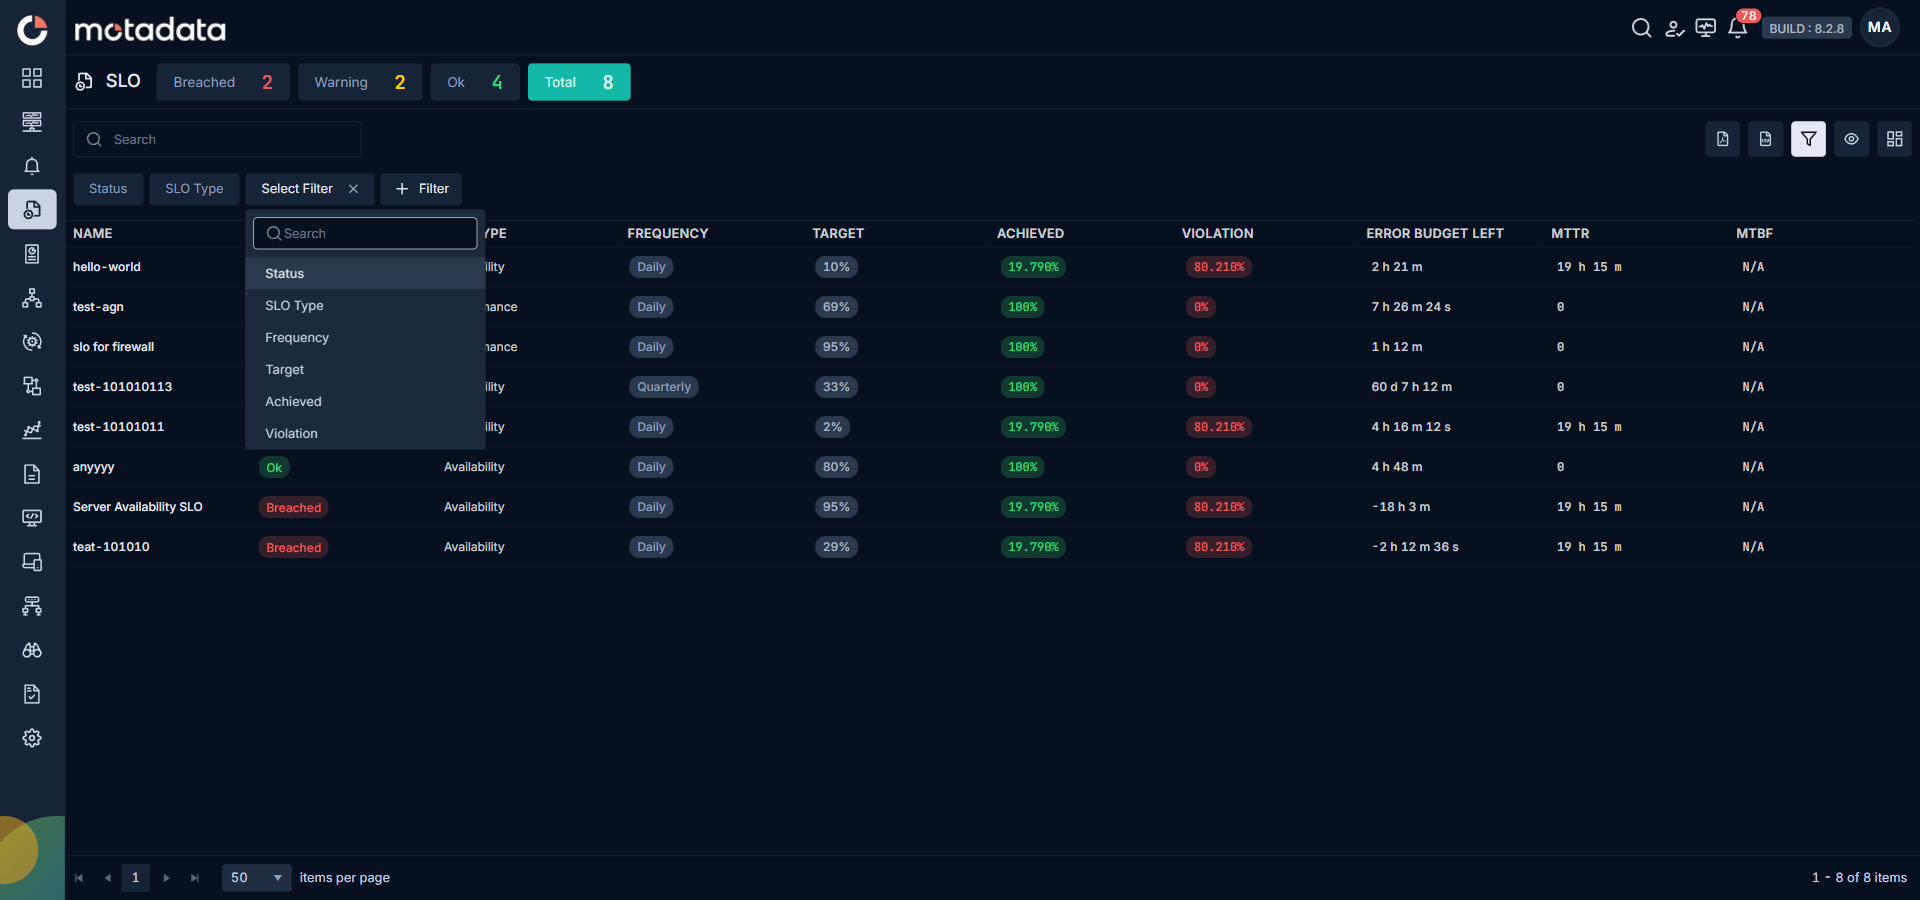
Select Filter in the toolbar to open the filter chip row above the grid. Any filters you already applied are shown as chips. Select the Filter button in that row to open the attribute picker and choose a column to filter on. Available attributes include Status, SLO Type, Frequency, Target, Achieved, Violation, Error Budget Left, MTTR, and MTBF.
Customising Grid Columns
Select the Column Customizer icon in the toolbar to show or hide individual columns. Turn a column off to remove it from the view, or select Reset Column Preference to restore the default column set.
Exporting the Grid
Use Export As PDF or Export As CSV in the toolbar to download the current grid as a PDF or CSV file. The exported file reflects any active filters and the columns you have chosen to display.
The SLO landing page does not use a top-right timeline picker. SLO status is evaluated on the SLO's configured frequency (Daily, Weekly, Monthly, or Quarterly), so the grid always reflects the current evaluation window for each SLO.
SLO Details View
Clicking on any SLO card or name from the grid, it opens a detailed screen with two tabs: Overview and SLO History.
Overview Tab
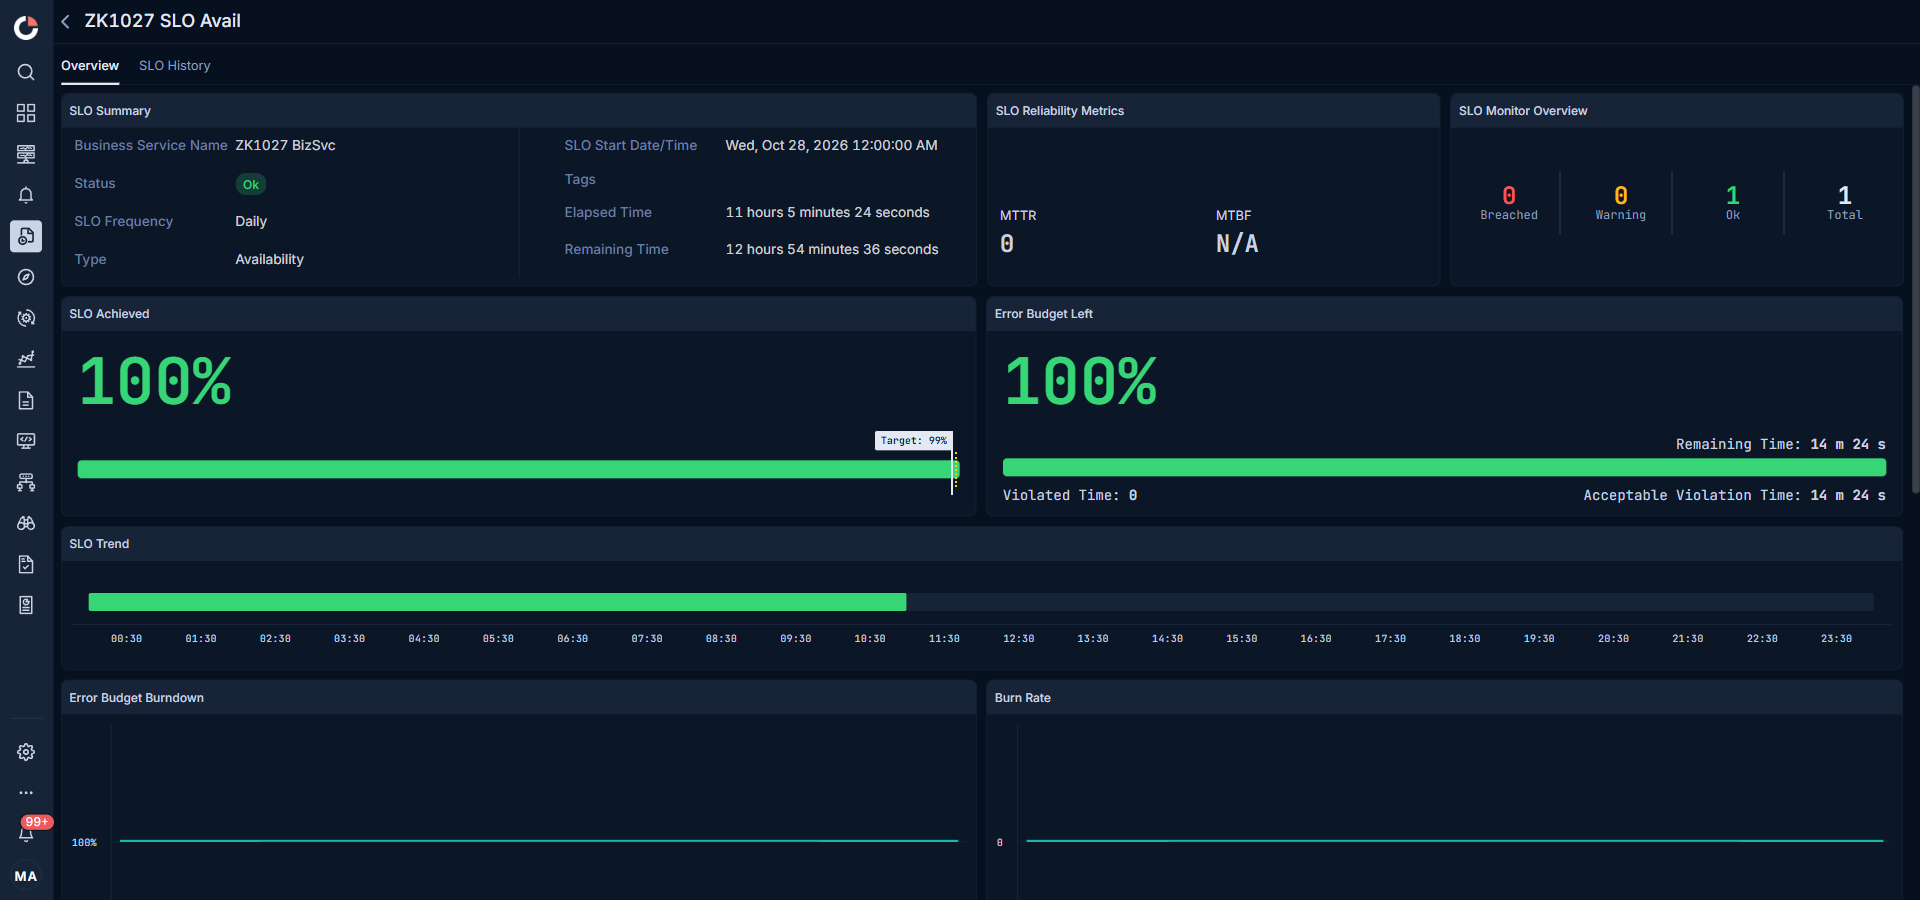
Includes the following widgets:
| Field | Description |
|---|---|
| SLO Summary | Displays key metadata of the SLO: Business Service Name, Status, SLO Frequency, Type, SLO Start Date/Time, Tags, Elapsed Time, and Remaining Time in the current evaluation window. |
| SLO Reliability Metrics | Shows MTTR (Mean Time To Recovery) and MTBF (Mean Time Between Failures) for Availability SLOs. |
| SLO Monitor Overview | Summarizes monitor distribution by status (OK, Warning, Breached) for the selected SLO. |
| SLO Achieved | Shows a trend bar visualizing the achieved percentage. Includes static markers for Target (Blue) and Warning (Yellow). |
| Error Budget Left | Displays remaining allowable violation time, total violation time, and acceptable violation time using a percentage-based trend bar. |
| SLO Trend | A time-series line chart displaying SLO status transitions over the frequency interval. Status includes Healthy, Degraded, Not Calculated and Corrected. Clicking the Degraded status displays a drill-down menu to understand it further. |
| Error Budget Burndown | A line graph starting at 100%, showing the consumption of the error budget over time. |
| Burn Rate | Visualizes the rate of budget consumption — higher burn rate indicates faster depletion. |
| Configured Entities | Lists all monitors contributing to the SLO with columns Monitor Name, IP, Metric, Tag, Status, Achieved %, and Violated %. Select a row to open the monitor drill-down side panel. |
The SLO Trend status is dependent on the system status configured for SLO. If the SLO Type is selected as Availability then the status displayed are as below:
| System Status | SLO Trend |
|---|---|
| Up | Healthy |
| Down | Degraded |
| Unreachable | Degraded |
| Disable | Not Calculated |
| Maintenance | Not Calculated |
| Unknown | It will persist the Last Status |
If the SLO Type is selected as Performance then if the system status is Clear then the SLO Trend displays Healthy or if the threshold is breached then it displays Degraded.
Clicking on any monitor displays the drill-down menu. The drill-down provides details such as:
Monitor Drill-down (Side Panel)
| Field | Description |
|---|---|
| Monitor Name | The name of the monitor contributing to the SLO. |
| SLO Achieved (%) | Achieved performance specific to the selected monitor. |
| Error Budget Left (%) | Remaining error budget specific to this monitor. |
| SLO Trend | Time-series trend status of the monitor over the SLO period. |
| SLO Metric | Metric associated with the performance SLO (shown only for Performance SLOs). |
| Error Budget Burndown | Line chart showing the consumption of error budget over time. |
| Burn Rate | Graph representing the rate at which error budget is being consumed. |
| Timestamp Grid | Aggregated time-wise view based on frequency, showing Achieved %, Violation %, and Error Budget Used for each time bucket. |
SLO History Tab
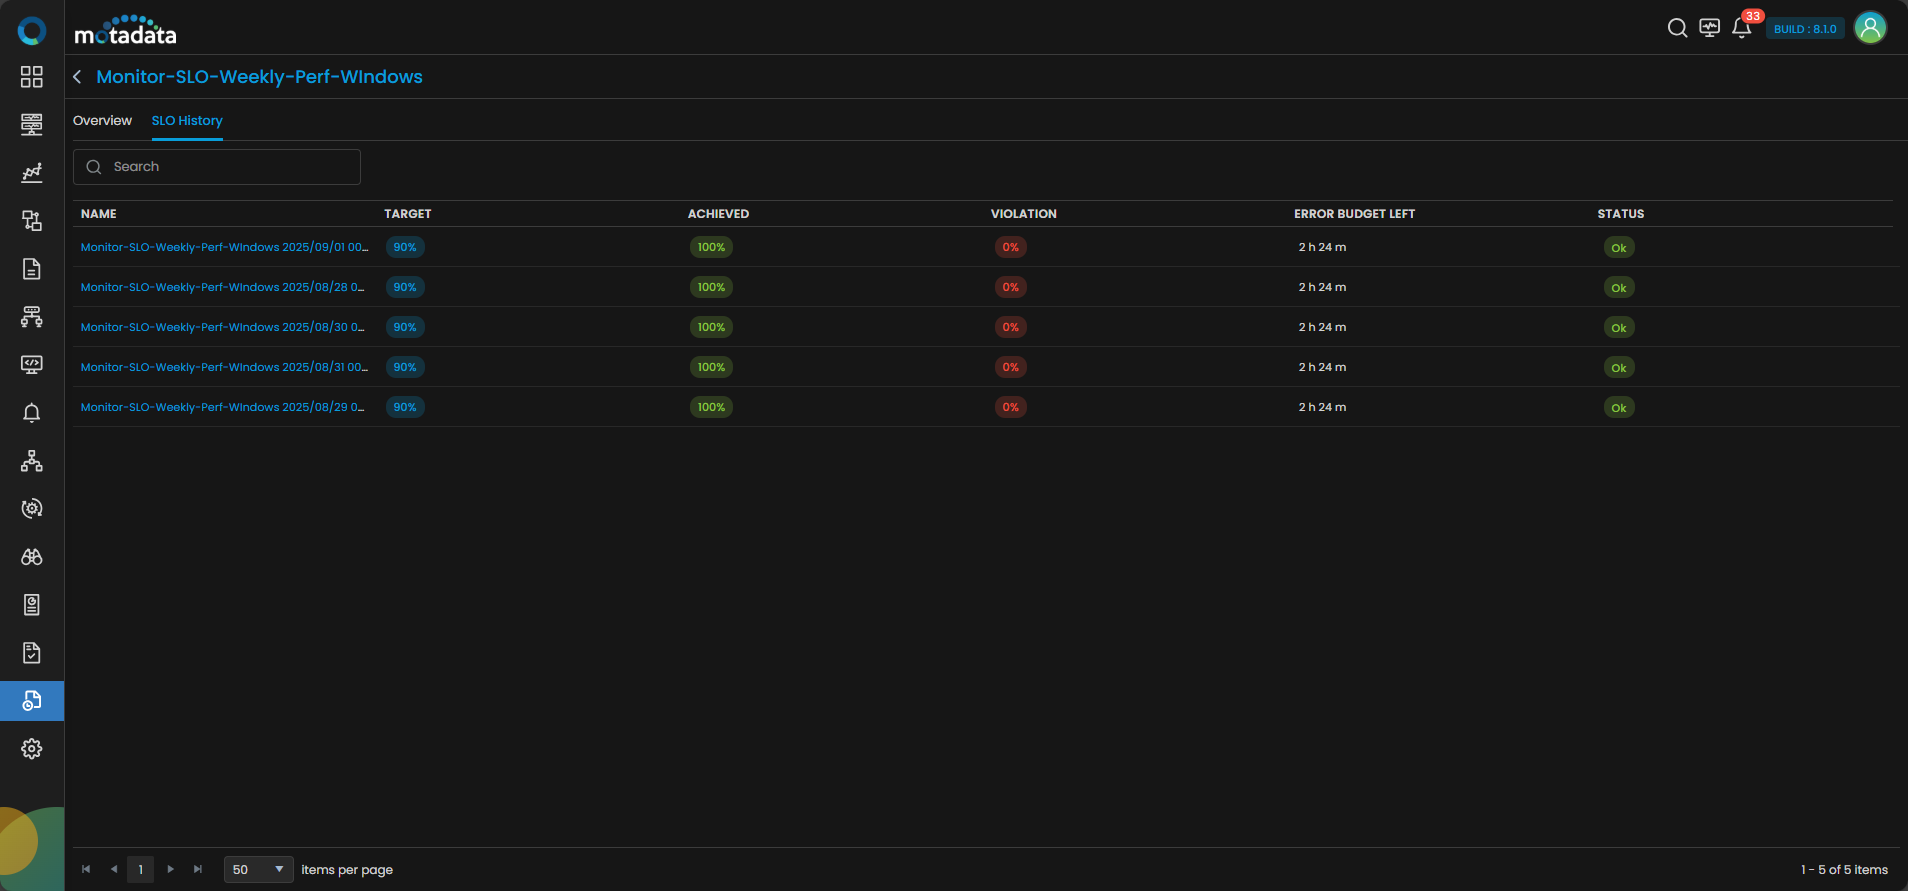
Displays historical compliance data per evaluation window. Columns include:
| Field | Description |
|---|---|
| Name | Indicates the SLO name in the concatenated format <SLO Name><Frequency Start Date & Time>. |
| Target | Target performance threshold set for the SLO in percentage. |
| Achieved | Actual percentage achieved during the given period. |
| Violation | Total percentage of time the SLO was violated. |
| Error Budget Left | Remaining error budget after accounting for violations. |
| Status | Indicates SLO status: OK, Warning, or Breached. |
Clicking on any history-entry opens a detail screen showing the same widgets as in the Overview tab.
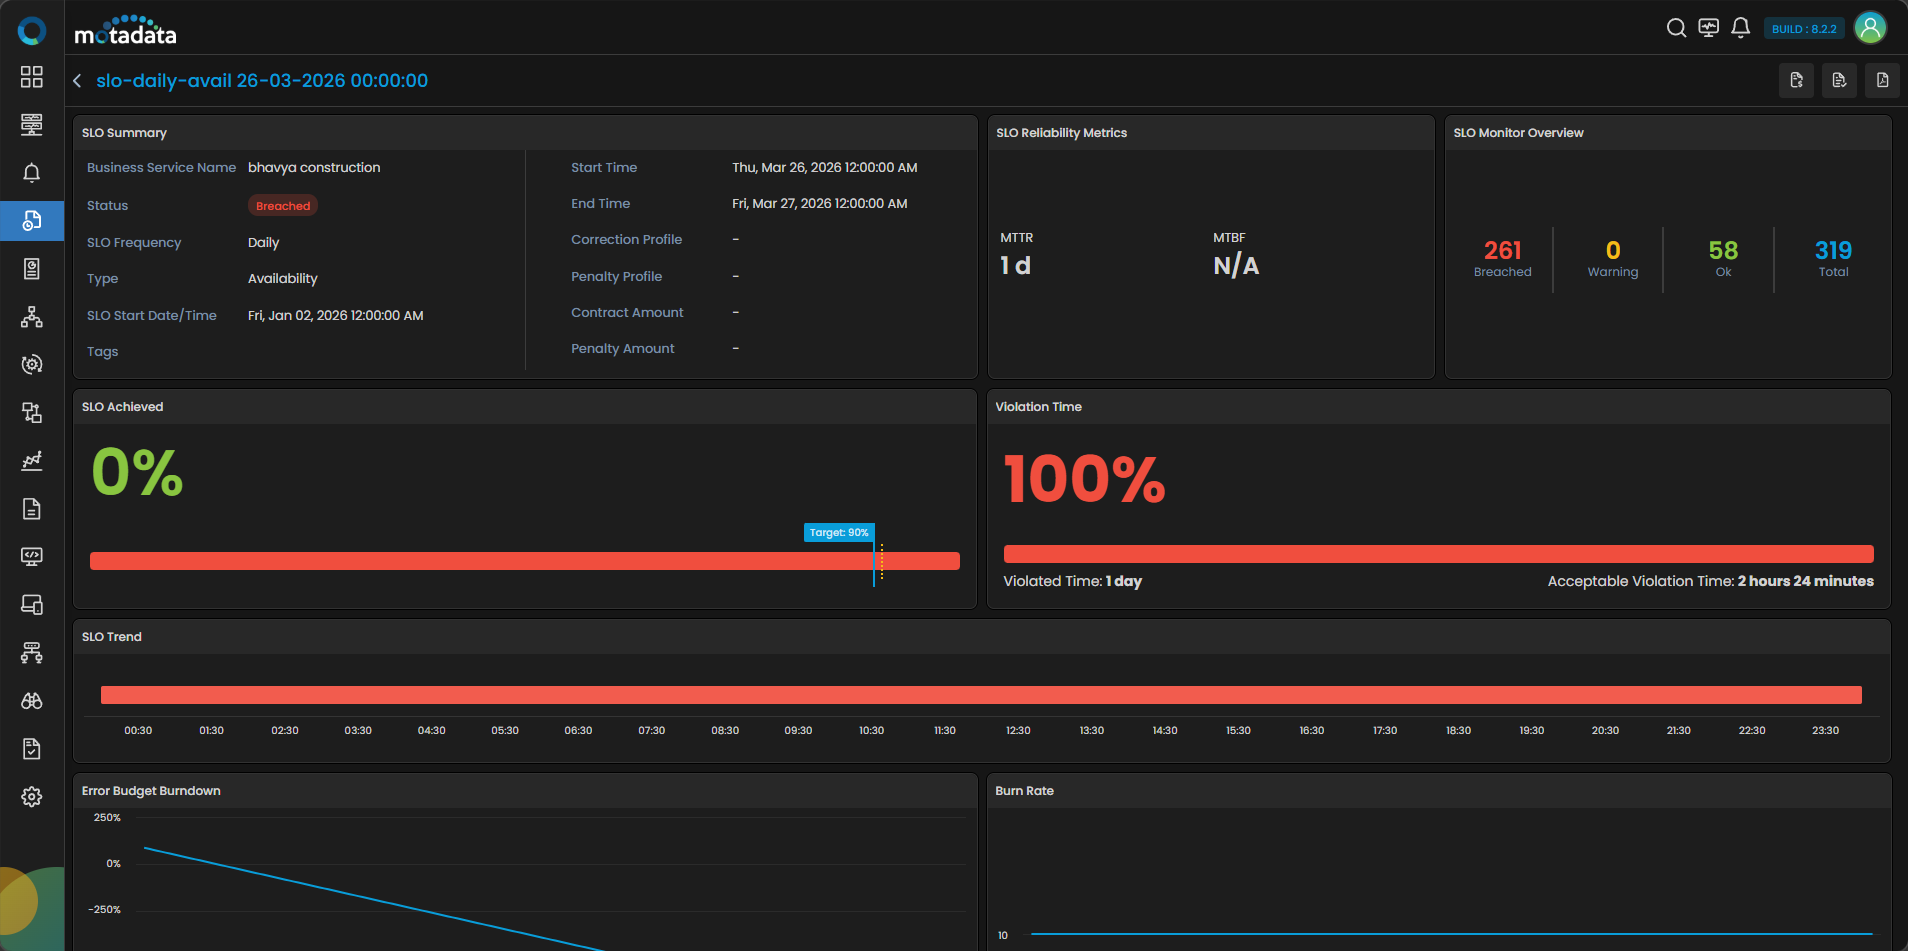
You can use the Attach Penalty Profile and Attach Correlation Profile icons to associate the respective profiles with the selected history.
Clicking the Export as PDF icon initiates the SLO report download. Initiating it displays a side notification indicating the file will be downloaded once ready.
- Notifications are triggered when an SLO moves to Warning or Breached.
- You will also receive an email once an SLO frequency cycle completes.
- Data retention policies are updated to reflect SLO-related records.
- Performance SLOs include all widgets except Service Reliability Metrics and include a SLO Metric widget instead.
Multi-Monitor Timeline Grid and SLO Status
Let's take an example and understand the multi-monitor timeline and its effect on SLO status individually for the device as well as for the system from the below table:
| Monitor | T1 | T2 | T3 | T4 | T5 | Status |
|---|---|---|---|---|---|---|
| Monitor 1 | UP | UP | UP | UP | UP | 100% |
| Monitor 2 | UP | UP | Down | UP | UP | 80% |
| Monitor 3 | UP | Down | UP | UP | UP | 80% |
| Overall Status | OK | Breached | Breached | OK | OK | 60% |
As per the above table, there are three monitors Monitor 1, Monitor 2 and Monitor 3 and Timezones are T1, T2, T3, T4 and T5. It is observed that Monitor 1 SLO status is 100% as for each time zone it is in UP state, but Monitor 2 and Monitor 3 are at 80% for individual SLO status as for different Time zones it is in Down state. Thus, the over all status is concluded as 60% because for T2 and T3 it is considered as Breached.
Now consider T1 is the timezone for 10:00 AM to 10:25 AM.
| Monitor | 10:00 AM to 10:05 AM | 10:05 AM to 10:10 AM | 10:10 AM to 10:15 AM | 10:15 AM to 10:20 AM | 10:20 to 10:25 AM | Status |
|---|---|---|---|---|---|---|
| Monitor 1 | UP | UP | UP | UP | UP | 100% |
| Monitor 2 | UP | Down | Down | UP | UP | 60% |
| Monitor 3 | UP | Down | UP | UP | UP | 80% |
| Overall Status | OK | Breached | Breached | OK | OK | 60% |
As per the above table, there are three monitors Monitor 1, Monitor 2 and Monitor 3. It is observed that Monitor 1 SLO status is 100% as for each time section it is in UP state, but Monitor 2 and Monitor 3 are at 60% and 80% respectively in individual SLO status. Thus, the over all status is concluded as 60%.