Configuring SLOs in ObserveOps
Overview
This section guides you through the process of creating and managing Service Level Objectives (SLOs) in ObserveOps. SLOs allow you to define performance or availability targets for your business services based on specific metrics and evaluation frequency.
Each SLO Profile includes parameters like service name, objective type (Availability or Performance), frequency, threshold values, filters, and tags. These SLOs help monitor service health and ensure compliance with defined service expectations.
By configuring SLOs, you can proactively detect service degradation, measure real-time performance against defined targets, and enable alerting or automation based on breaches.
Navigation
To access the SLO configuration page:
Go to Settings from the main menu. Select the Service Level Objectives category. Click on SLO Profile to view the list of existing SLOs.
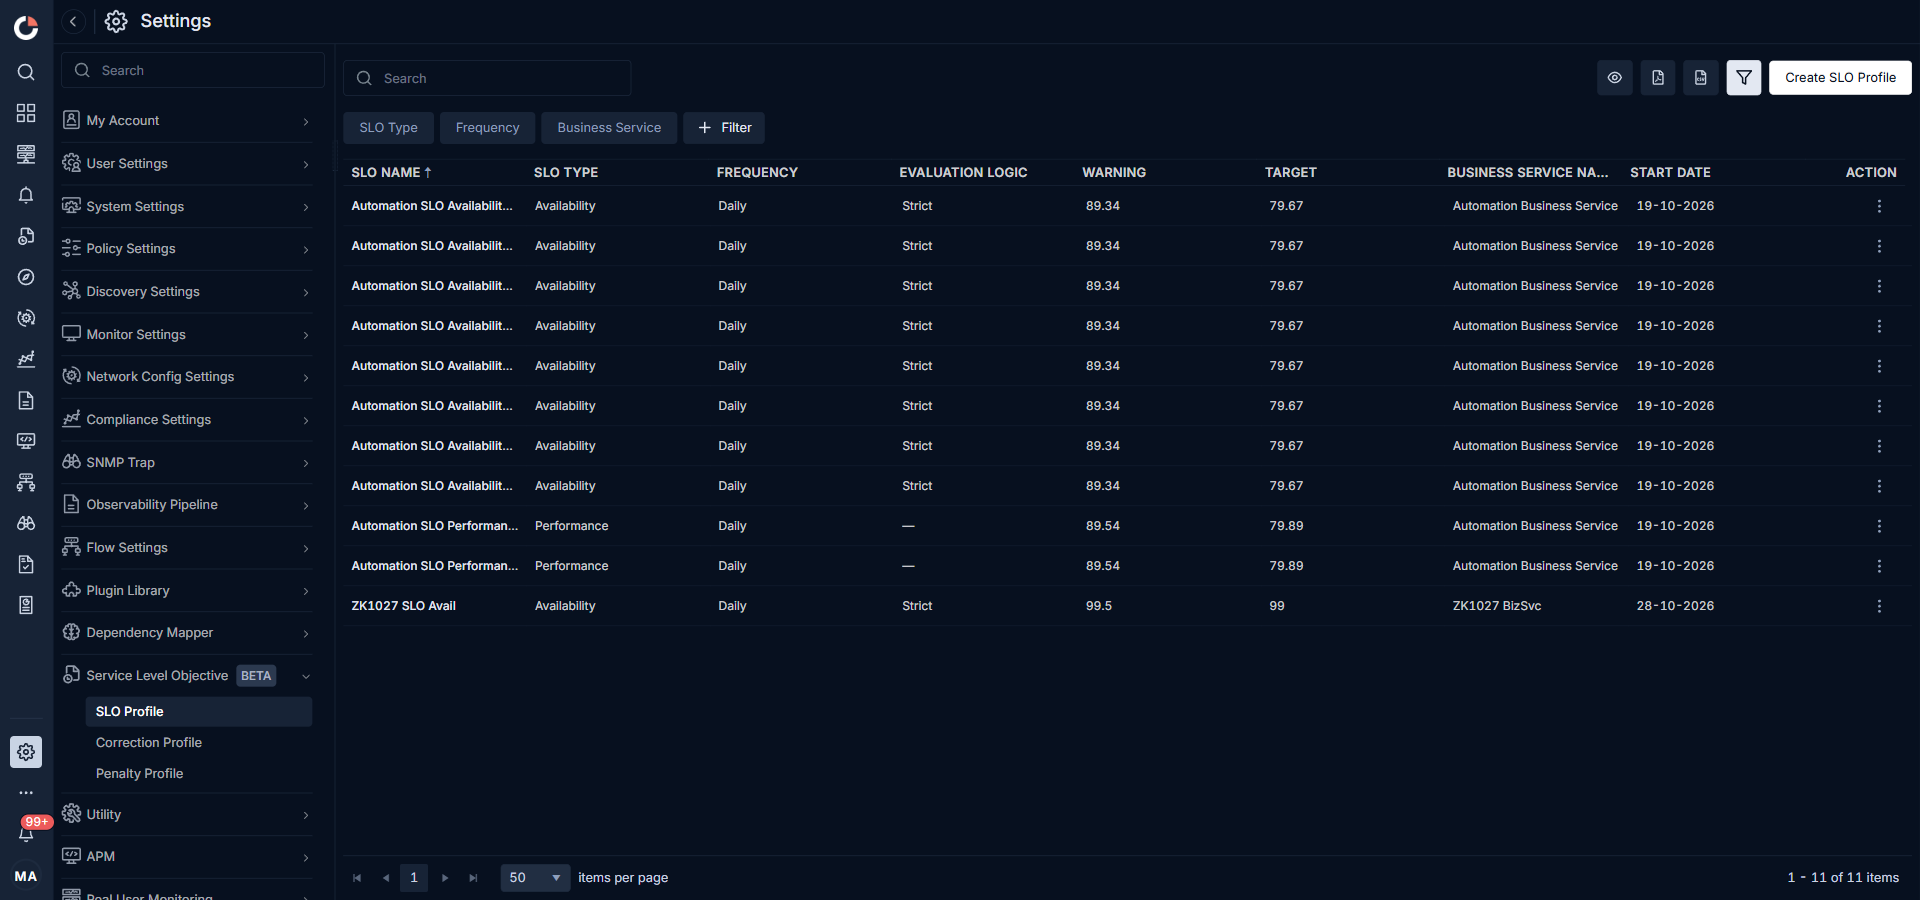
The SLO Profile grid displays the following information for each profile:
| Field | Description |
|---|---|
| SLO Name | The unique name assigned to the SLO profile. Click the name to view profile details in read-only format. |
| SLO Type | The type of SLO: Availability or Performance. |
| Frequency | The evaluation window used by the profile: Daily, Weekly, Monthly, or Quarterly. |
| Evaluation Logic | It shows how the SLO rolls up the sources it is tied to. Strict marks the SLO as degraded when any single source fails. Redundant marks the SLO as degraded only when the number of healthy sources drops below the minimum configured on the profile (shown as "at least N of total"). Only populated for Availability SLOs; blank for Performance SLOs. |
| Warning | The threshold, in percent, that moves the SLO into the warning state before the target is breached. |
| Target | The minimum acceptable percentage the SLO must achieve within the frequency window. |
| Business Service Name | The business service the SLO is attached to. Every SLO belongs to exactly one business service, and the SLO Explorer rolls up status under this value. |
| Start Date | The date on which the SLO starts evaluating. |
| Action | Opens the action menu for the profile. See below. |
Use the action menu on any profile row to perform the following actions:
| Action | Description |
|---|---|
| Edit | Opens the profile in edit mode. Only SLO Description, Tags, and Notify Team can be modified after creation. |
| Clone | Creates a copy of the profile and opens it in edit mode with the name pre-filled. Edit the name and any fields as needed, then click Create SLO Profile to save the clone as a new independent profile. |
| Delete | Permanently removes the SLO profile. |
Configuration
Click on Create SLO Profile to configure a new objective. While creating a new SLO Profile, fill out the following fields:
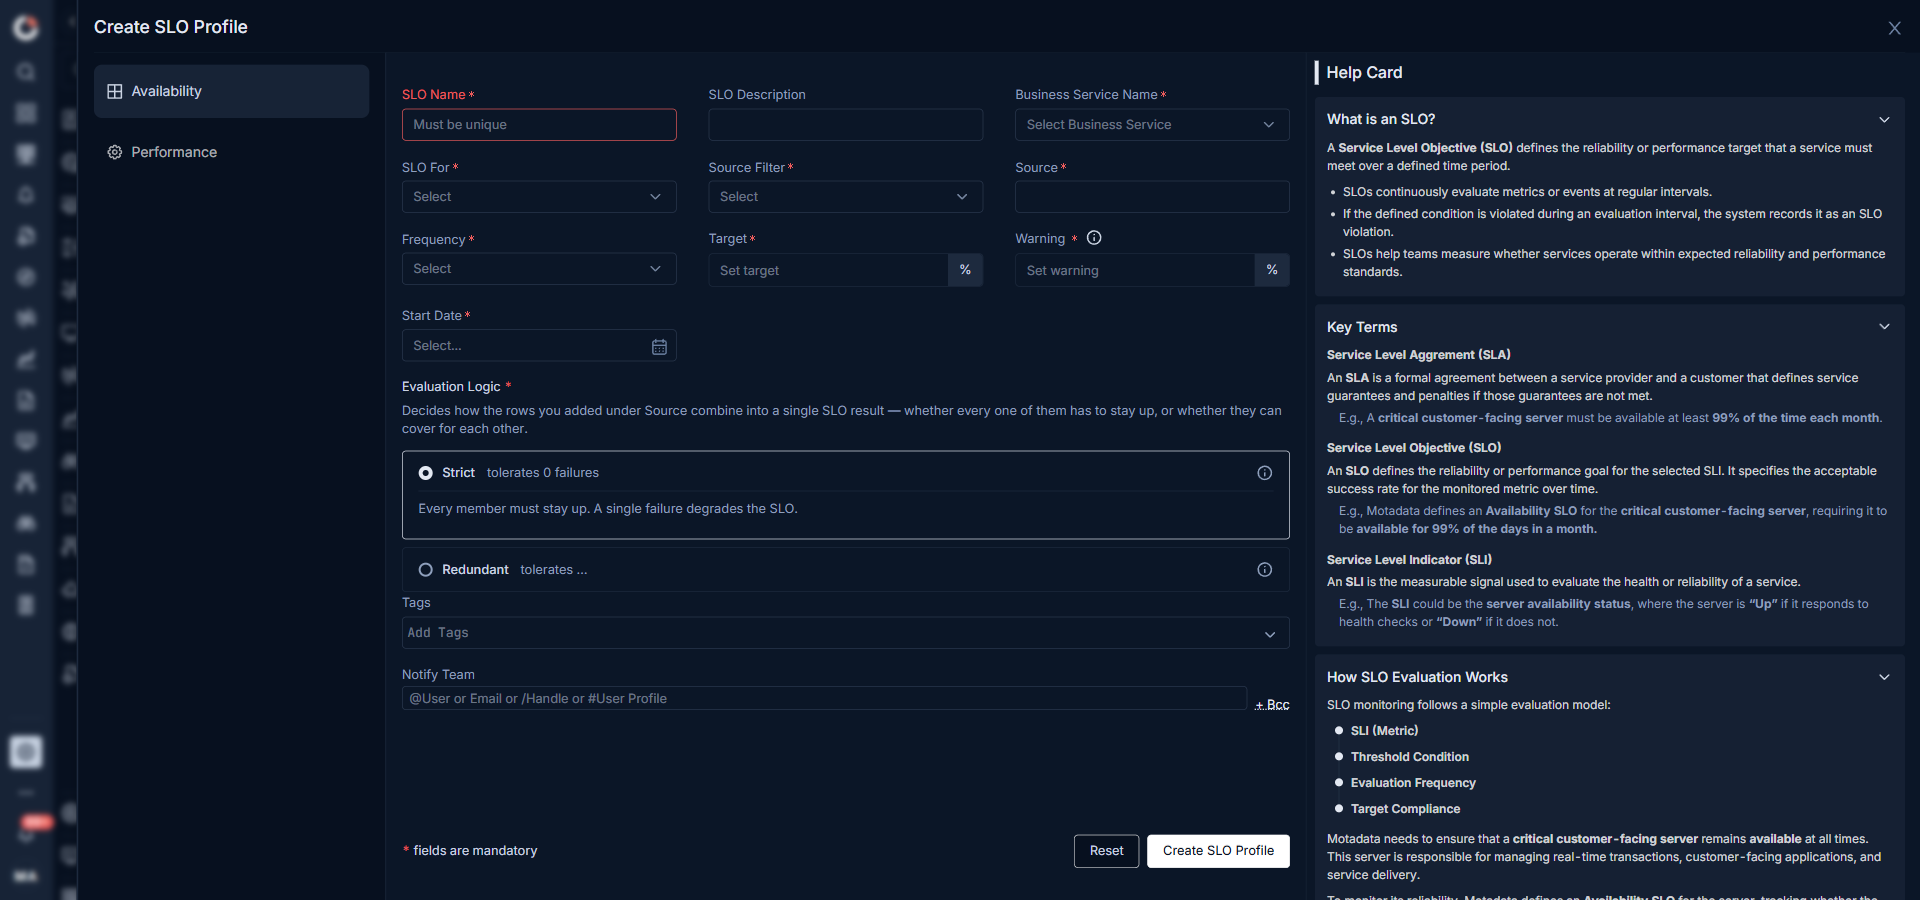
| Field | Description |
|---|---|
| SLO Name | A unique name to identify the SLO profile. |
| SLO Description | Brief explanation of the objective. |
| SLO Type | Choose Availability or Performance. When you select Performance, four sub-tabs appear: Metric, APM, RUM, and NetRoute. Select the sub-tab that matches your monitoring source. |
| Business Service Name | Required. Select the business service the SLO belongs to from the Select Business Service dropdown. Every SLO must be attached to exactly one business service, so the SLO Explorer can roll up status, warning, and breached counts under that business owner. |
| Frequency | Select the evaluation window: Daily, Weekly, Monthly, or Quarterly. SLO Evaluation Frequency Windows are considered as below: - Daily: 00:00 to 23:59 of the same day - Weekly : 00:00 of start day to 23:59 of 7th day from the start date - Monthly : 00:00 of the 1st day to 23:59 of the 30th day from the start date - Quarterly : 00:00 of 1st day to 23:59 of 90th day from the start date |
| Target (%) | The minimum acceptable threshold for the selected metric. |
| Warning (%) | The value which triggers early alerts. It must always be higher than the Target value. |
| Start Date | Select the SLO starting date from the calender. We support only forward dated SLO. |
| Evaluation Logic | Shown only for Availability SLOs. Configure it in the Availability tab below. |
| Tags | Add custom tags for grouping and identification (not the same as monitor tags). |
| Notify Team | Select the teams (using user or email/ handle) to be notified in case of violations or warning thresholds. |
The start time to store the new data is considered at 12:00 AM and the time interval to refresh the data depends on the frequency you choose. i.e., For Daily it is every 15 min, For Weekly it is every 30 min, For Monthly and Quarterly it is 1 hour.
After filling in the common fields, configure the type-specific settings based on the SLO Type you selected:
- Availability
- Performance
Use the Availability type to measure whether a service or infrastructure component remains operational during the selected evaluation period.
| Field | Description |
|---|---|
| SLO For | Define the scope of the SLO (Monitors, Groups, Tags, etc.). |
| Source Filter | Filter by Monitor, Group, or Tag. |
| Source | Specific monitor(s), group(s), or tag(s) based on the filter selected. |
| Filters | This option gets displayed after selecting the SLO For to apply pre or post filters. |
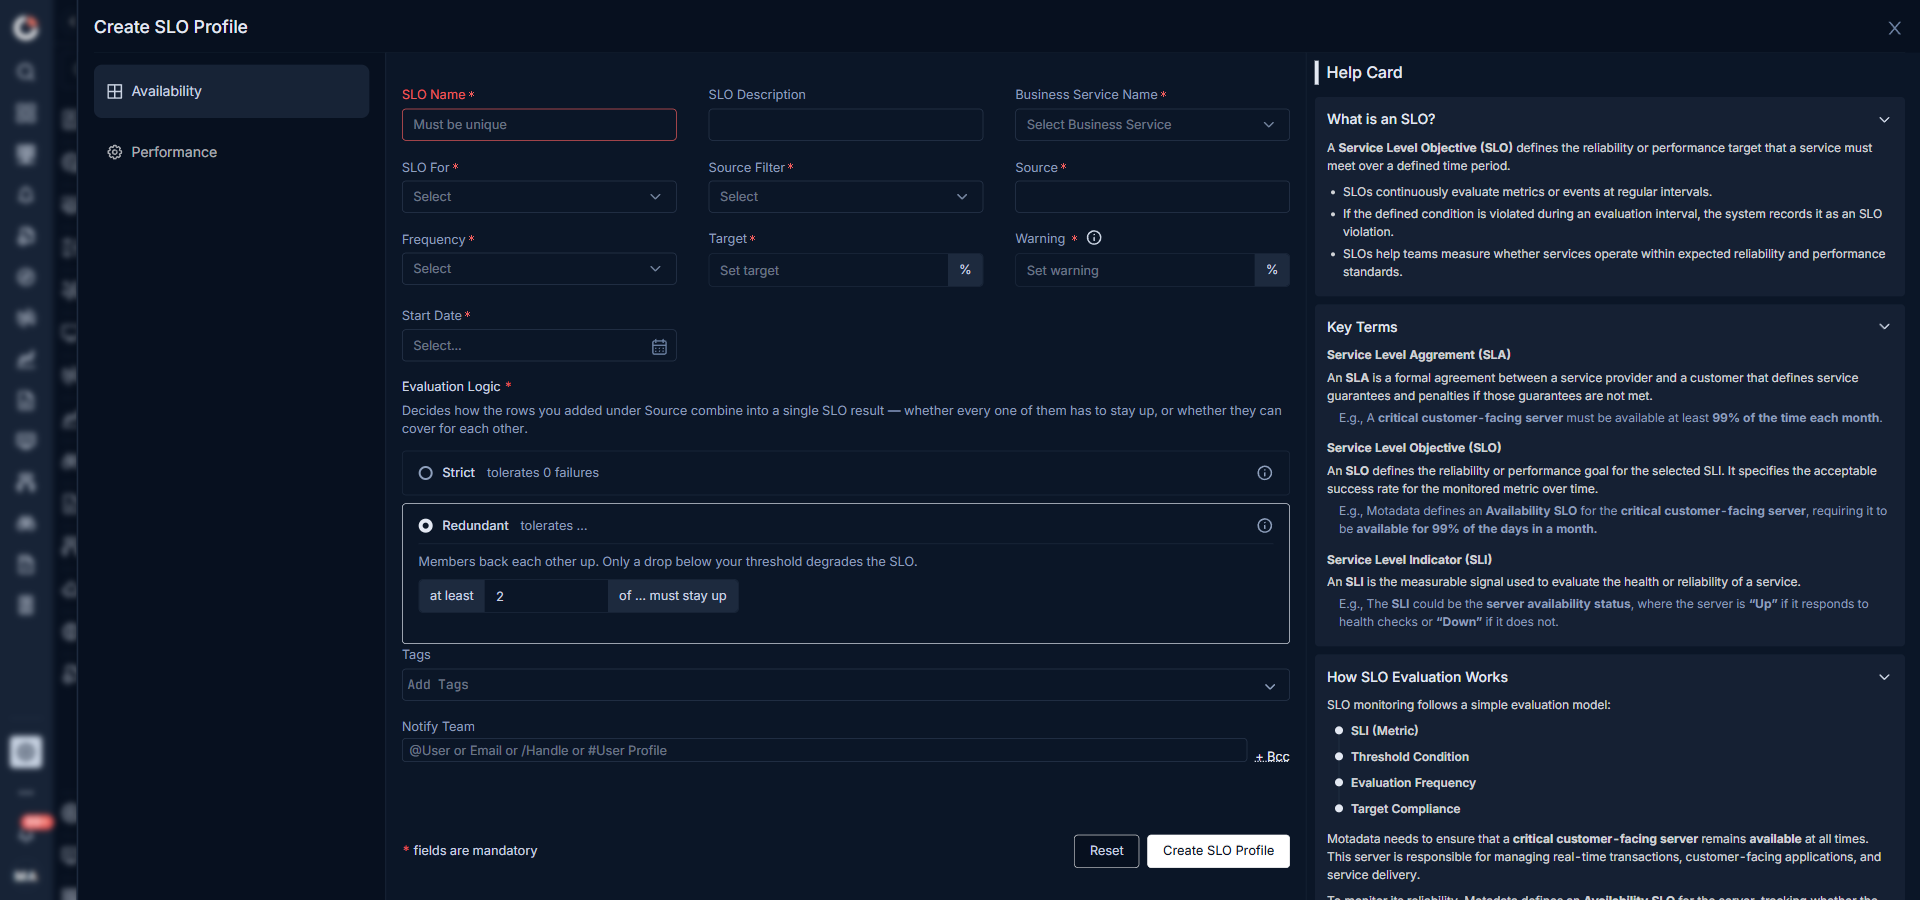
| Evaluation Logic | Choose how the rows you added under Source combine into a single SLO result — whether every one of them has to stay up, or whether they can cover for each other. - Strict (default) — tolerates 0 failures. Every member must stay up. A single failure degrades the SLO. - Redundant — tolerates failures. Members back each other up. Only a drop below your threshold degrades the SLO. When you pick Redundant, the form shows an inline control: at least [N] of [total] must stay up. Set N to the minimum number of members that must stay up for the SLO to remain healthy. |
Use the Performance type to measure whether a service meets a defined performance threshold. When you select Performance, four sub-tabs appear: Metric, APM, RUM, and NetRoute.
| Field | Description |
|---|---|
| SLO For | Define the scope of the SLO (Monitors, Groups, Tags, etc.) in case you have selected Metric as Performance SLO. |
| Counter | Select the metric to evaluate — for example, response time or throughput. Available counters depend on the selected source. |
| Operator | Choose the comparison parameters like Equals, Not Equals, Contains, etc. |
| Value | Enter the threshold number. Units update automatically based on the selected counter. |
| Source Filter | Filter the available sources by monitor, group, or tag. |
| Source | Select the specific monitor to evaluate. Only active monitors appear here. |
You can click the +AddNew Condition to add another SLO Condition(s).
Value fields automatically append appropriate units based on the selected metric.
For other Performance sub-tabs, see:
Click Create SLO Profile to save the SLO. To reset the configurations click the Reset button.
The new SLO appears in the SLO Profile grid with Status set to ON by default.