Log Policy in ObserveOps

Overview
The log policy feature in ObserveOps empowers you to effectively monitor and analyze log events in real-time, enabling proactive identification and resolution of potential issues in your IT infrastructure. With log policies, you can define rules and conditions to generate alerts based on log data, ensuring the smooth operation of your systems and applications.
Use-Case
Security Monitoring: Configure log policies to detect and alert on security-related events, such as failed login attempts, suspicious access patterns, or potential breaches.
Error and Exception Tracking: Create log policies to identify critical errors or exceptions occurring within your applications, enabling you to quickly respond and resolve issues before they impact users.
Compliance and Audit: Set up log policies to monitor specific compliance requirements, such as tracking access to sensitive data or ensuring adherence to regulatory guidelines.
Performance Optimization: Utilize log policies to identify performance bottlenecks, anomalies, or resource-intensive activities in your infrastructure, allowing you to optimize system performance and enhance user experience.
Create Log Policy
Navigation
Select Settings  . After that, Go to Policy Settings
 . Select Metric/Log/Flow policy. The list of the created policies is now displayed.
Click on  to start creating a policy. From the panel on the left side of the screen, click on the Log tab to start creating a metric policy. The screen to create a Log Policy is now displayed.
From the policy list, you can Edit, Delete, or Clone any Log policy. Clone copies the source policy's configuration into a new policy so you can adjust a few fields instead of building the policy from scratch. See Policy List Actions for details.
Enter the details of the following parameters to create a Log Policy:
| Field | Description |
|---|---|
| Policy Name | Enter a unique name of the policy you want to create. |
| Tag | Add key-value tags to logically categorize the policy. Reserved tags like source (for example, source:Windows, source:Linux, source:Cloud), tactic, and technique are rendered as separate badges on the Alert Explorer and the Alert Details page. |
Evaluation Type
Pick how the policy evaluates incoming logs. The configuration options under Set Conditions change based on the selection.
| Evaluation Type | When to use |
|---|---|
| Threshold | Raises an alert when an aggregated value (count of logs, sum of a field, etc.) over an interval crosses the configured limit. Suited for trend-based detection, for example "more than 50 failed logins in 5 minutes". |
| Critical Event | Raises an alert in real time on a single log event that matches the filter conditions. Suited for critical security detections where every occurrence matters, for example a MITRE ATT&CK technique match on a single Windows or Cloud event. |
Scenario
Suppose we want to create a log policy to trigger an alert whenever an activity by a root user is detected.
In the filter condition shown in the diagram below, we have specified the condition to identify any log messages that contain the word 'sudo', 'su', and 'root'. This helps to identify the messages indicating activity related to root user.

Once we have identified the messages(if any) indicating activity by a root user, we now configure the policy to trigger an alert whenever the count of such messages goes above 1 i.e., we raise an alert even if a single message comes up with the words 'sudo', 'su', and 'root'.
In this way, we can configure a log policy to raise an alert whenever an activity from a root user is detected.
Critical Event Policy
Select Critical Event under Evaluation Type to raise an alert in real time on a single matching log event. Each incoming event that satisfies the configured filters produces an alert, so build Critical Event policies with care and keep the filters tight.
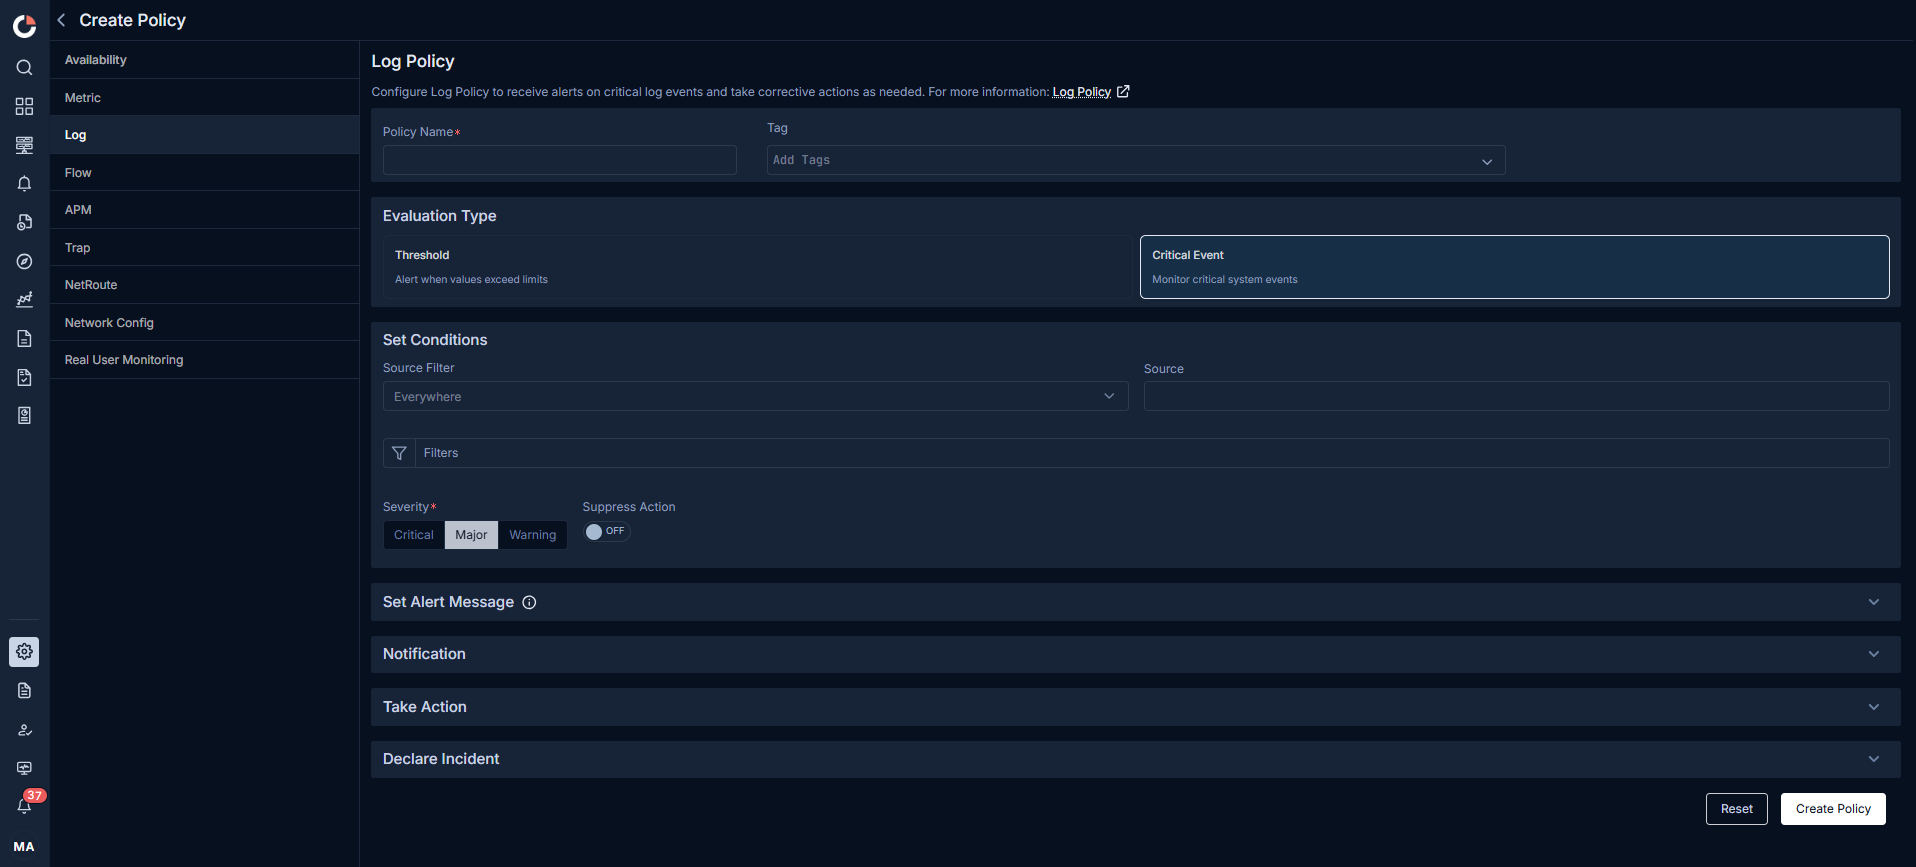
Configure the following fields under Set Conditions:
| Field | Description |
|---|---|
| Source Filter | Scope the policy to the log sources you want to monitor. Options: Everywhere, Source Host, Log Type, or Group. |
| Source | Pick the specific source host, Log Type, or group that matches the chosen Source Filter. Leave blank when Everywhere is selected. |
| Filters | Define pre-filter conditions on fields in the log event (for example, event.id = 1102, user.name = SYSTEM). Keep the filter tight enough to isolate the single event you care about. |
| Severity | Select Critical, Major, or Warning for the alert raised by the policy. |
| Suppress Action | Toggle on to execute actions and notifications once, then suppress them for the duration configured under Suppress Window. |
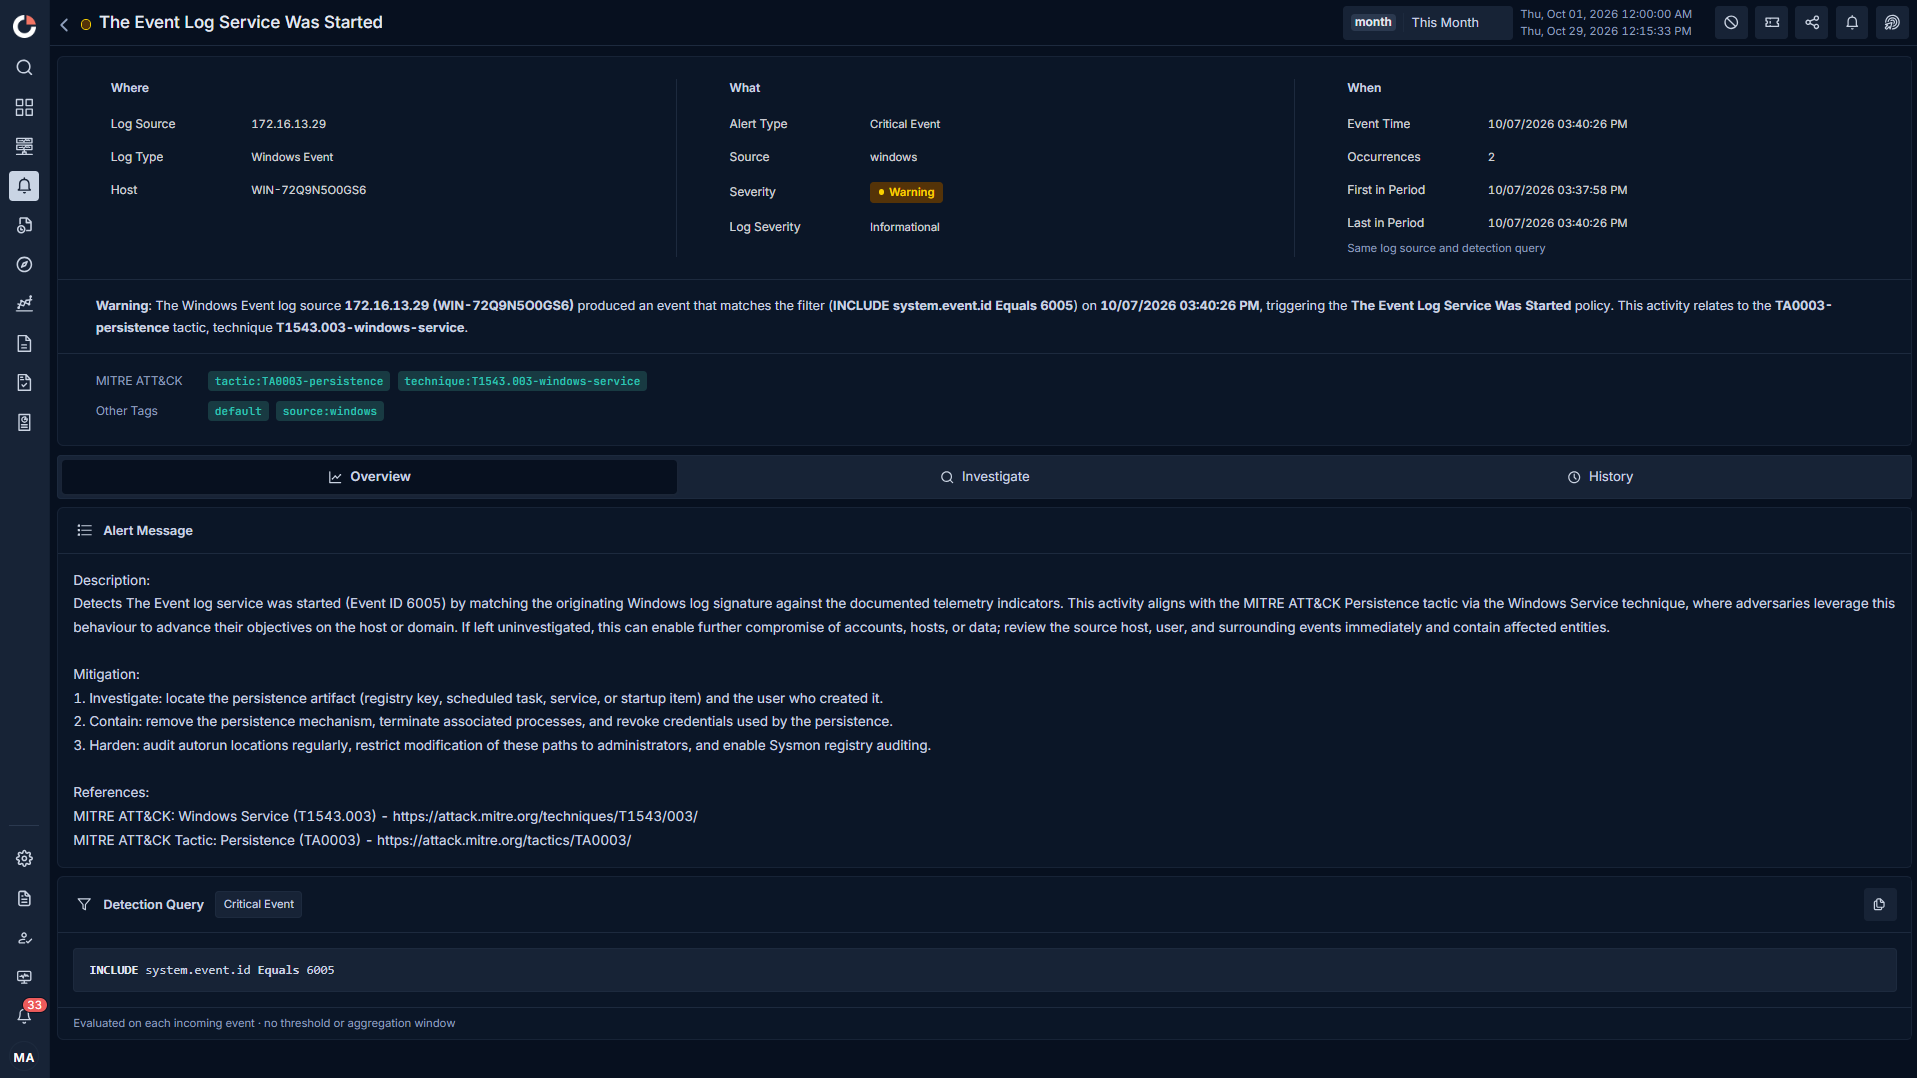
Alert grouping behaviour. One matching event produces one alert, scoped to its source. If the same source matches the same policy again, the subsequent events are added to the existing alert instead of creating new alerts. Notifications and configured actions still fire for every occurrence. The alert list shows the current count of events per policy per source.
Out-of-the-box policies. A large catalogue of Critical Event policies ships with the release, covering MITRE ATT&CK tactics and techniques for Windows, Cloud, Linux, and other sources. Each OOB policy is pre-tagged with the matching tactic and technique values and includes a detailed alert message that documents the attack, the detection strategy, mitigation steps, and reference URLs. Clone an OOB policy and adjust it in place rather than writing a policy from scratch.
Threshold Policy Options
The following options apply when Threshold is selected under Evaluation Type.
| Field | Description |
|---|---|
| Counter | Choose the specific counter you wish to create a policy for by selecting from the available options in the dropdown menu. This counter will be the basis for monitoring and generating alerts. |
| Aggregation | Determine the aggregation function that best suits your monitoring needs for the selected counter. This function allows you to consolidate and analyze the metric data over a defined period. |
| Operator | Select the operator that will be applied to the aggregated counter values to define the triggering condition for the alert. You can read more on global operators to understand each operator type. |
| Start Value & End Value | (Only available when Range operator is selected) Specify the threshold values against which the aggregated counter values will be compared. Once the counter value meets the specified range, an alert will be triggered, notifying you of the issue. |
| Source Filter | - Select Source Host if you want to create the policy for specific log source(s). - Select Log Type if you want to create the policy for log sources that belong to specific log types. - Select Group if you want to create the policy for log sources that belong to specific groups. - Select Everywhere if you want to create the policy for all the log sources in the system. This option is selected by default. |
| Source | Select the specific Source Host, Log Type, or Group for which you want to create the policy. This dropdown will show results based on the option you have selected in the previous option. You can leave this field blank if you have selected 'Everywhere' in the previous option. |
| Result By | Specify the grouping criteria for the aggregated values. This field allows you to define how the log data will be grouped for evaluation of the policy. |
Set Alert Message
| Field | Description |
|---|---|
| Subject | Modify the subject-line for the alert message. |
| Message | Modify the detailed alert message. The same content is rendered on the Alert Details page and sent out through every configured notification channel (email, Microsoft Teams, Slack, declared incidents). Use this field to document the incident context, the detection strategy, mitigation steps, and reference URLs so the responder has everything in one place when the alert arrives. |
For a list of default supported Macros to modify the default set message, Please visit: Alert Macros
Notification
| Field | Description |
|---|---|
| To | Add every recipient that should receive the alert. Type an entry, then select from the picker or press Enter to add it as a tag. Supported entry formats: @User for a registered ObserveOps user (delivered by their profile channels), @email@example.com for a direct email address, /Handle for a Microsoft Teams or Slack handle from a saved integration profile, #UserProfile for a saved user profile that fans out to every user inside it, !Profile for a Syslog Forwarder or SNMP Trap Forwarder integration profile that forwards the alert to an external destination. |
| + Bcc | Select + Bcc at the end of the To field to open a BCC field below it. Recipients you add in the BCC field stay hidden from every other recipient. Applies to email notifications only. |
| Play Sound | Activate this toggle to enable sound notifications when an alert is triggered. |
| If Severity is | Choose the severity level at which the sound notification should be triggered. This option becomes visible only when the Play Sound toggle is switched ON. |
The first recipient in To goes into the email To header and is visible to every other recipient. Set it to a team or distribution address such as noc@company.com for privacy. See Notification for the full BCC behaviour.
Take Action
| Field | Description |
|---|---|
| Action to be taken | Select a runbook from the dropdown to be executed when the alert is triggered. |
| Create New | Select this button to start creating a new runbook which you might want to assign to the policy you are creating. |
When you select a Top 10 Process runbook (Linux, Windows, or Solaris variant) in Action to be taken, ObserveOps first sends the standard alert notification email using the current template, then sends a separate follow-up email that contains the Top 10 Process details returned by the runbook. Both emails go to the recipients listed under Notification.
Declare Incident
| Field | Description |
|---|---|
| Select Integration Profile to Trigger | Choose an Integration profile to be executed from the dropdown when the chosen alert severity is triggered. |
| When Alert Severity is | Select an Alert severity from the dropdown. |
| Create Integration Profile | Select this button to start creating a new Integration profile that you might want to assign to the policy you are creating. |
You can click on  to define a new Alert severity and Integration Profile combination. You can have separate Integration profile triggered at different levels of Alert severity.
Select the Create Policy button to create the policy based on the details entered.
Select the Reset button to erase all the current field values, if required.