Availability Flap Summary Reports in ObserveOps
Select the data to be displayed on the report
The custom availability flap summary report allows you to analyze past availability flap alerts triggered within your monitoring environment. This report provides insights into the different states of availability alerts, including Unknown, Up, and Down, for the selected entity. By customizing the report parameters, you can focus on specific monitored entities and monitor the historical availability status to identify availability trends.
Select the data to be displayed in the report
To create an availability flap summary report, follow the steps below and configure the fields according to your monitoring needs:
| Field | Description |
|---|---|
| Alert By | Select the specific entity(Monitor and Interface) from the dropdown for which you want to view the past availability alerts. |
| Source Filter | Narrow down the scope of the monitors that you want to include in the report by selecting either Monitor or Group from the dropdown. This helps you focus on specific subset of monitors based on your selection. |
| Source | Select the specific monitors or groups to include in the report. Based on the selection made in the previous field, this dropdown will display relevant options to narrow down the source of data for the report. For example, if you selected Monitor in the previous field, the Source dropdown will display a list of all available monitors for you to select from. |
| Status | Select the flap history status for which you want to generate the report. |
By configuring these fields, you can create a custom availability flap summary report that aligns with your monitoring requirements and delivers crucial insights into your flap summary data.
Report Layout
When the report is generated, ObserveOps opens the Status flap report page with the report metadata at the top and one grouped table per monitor.
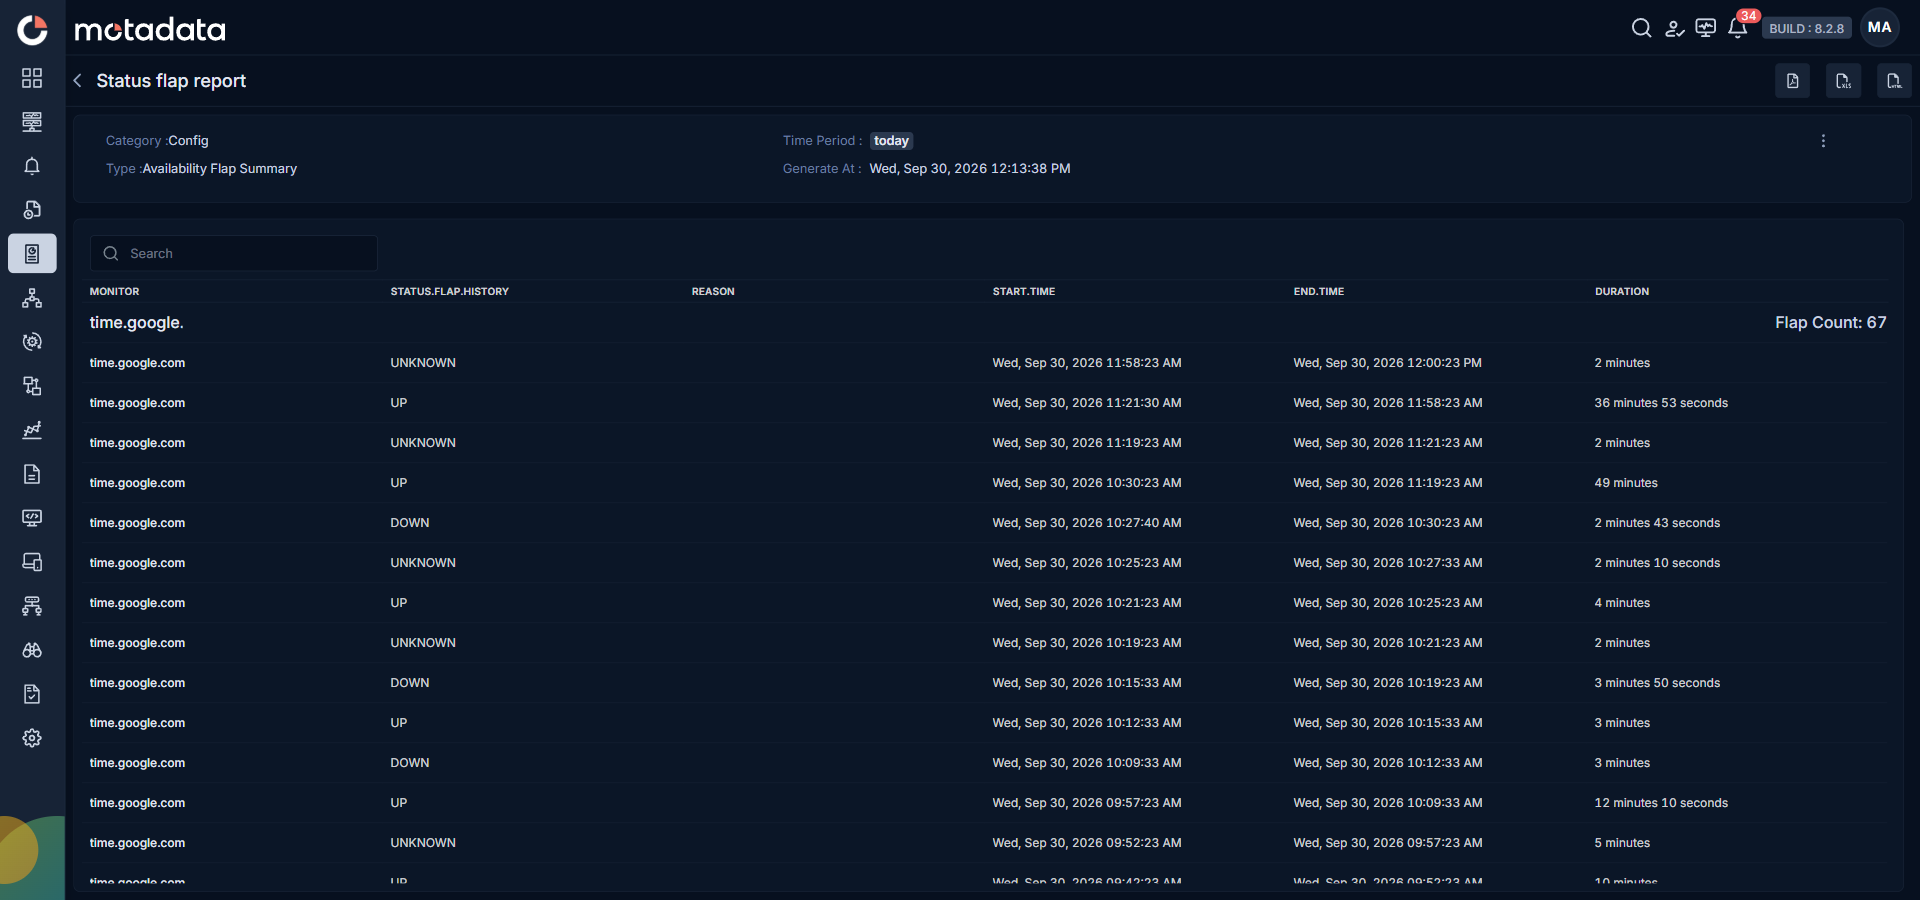
Report Header
The header bar at the top of the report shows the following metadata.
| Field | What It Shows |
|---|---|
| Category | The report category. Availability Flap Summary belongs to Config. |
| Type | The report type — Availability Flap Summary. |
| Time Period | The reporting window you selected, such as today, last 7 days, or a custom range. |
| Generate At | The timestamp at which ObserveOps generated the report. |
Use the icons on the top-right to export the report as PDF, CSV, or XLS.
Monitor Group
Each monitor you selected appears as its own group in the report. The group heading shows the monitor name and its Flap Count total for the reporting window on the right.
The rows inside each group are the individual state transitions for that monitor. Each row uses the following columns.
| Column | What It Shows |
|---|---|
| Monitor | The monitor whose state changed. |
| Status.Flap.History | The status the monitor entered at the start of this row — UP, DOWN, or UNKNOWN. |
| Reason | A short explanation of why the state changed, when ObserveOps has one. Often blank when the change is a plain availability transition. |
| Start Time | The timestamp when the monitor entered this status. |
| End Time | The timestamp when the monitor left this status. |
| Duration | How long the monitor stayed in this status, expressed in minutes and seconds. |
Default Sort Order
Monitor groups are ordered by their Flap Count in descending order by default, so the most unstable monitors appear at the top of the report. Within each monitor group, transitions are shown newest first based on the Start Time. You can still sort the report by any other column after it opens.