Motadata Release Notes Version 8.2.7
Release Date: July 31, 2026
What's New?
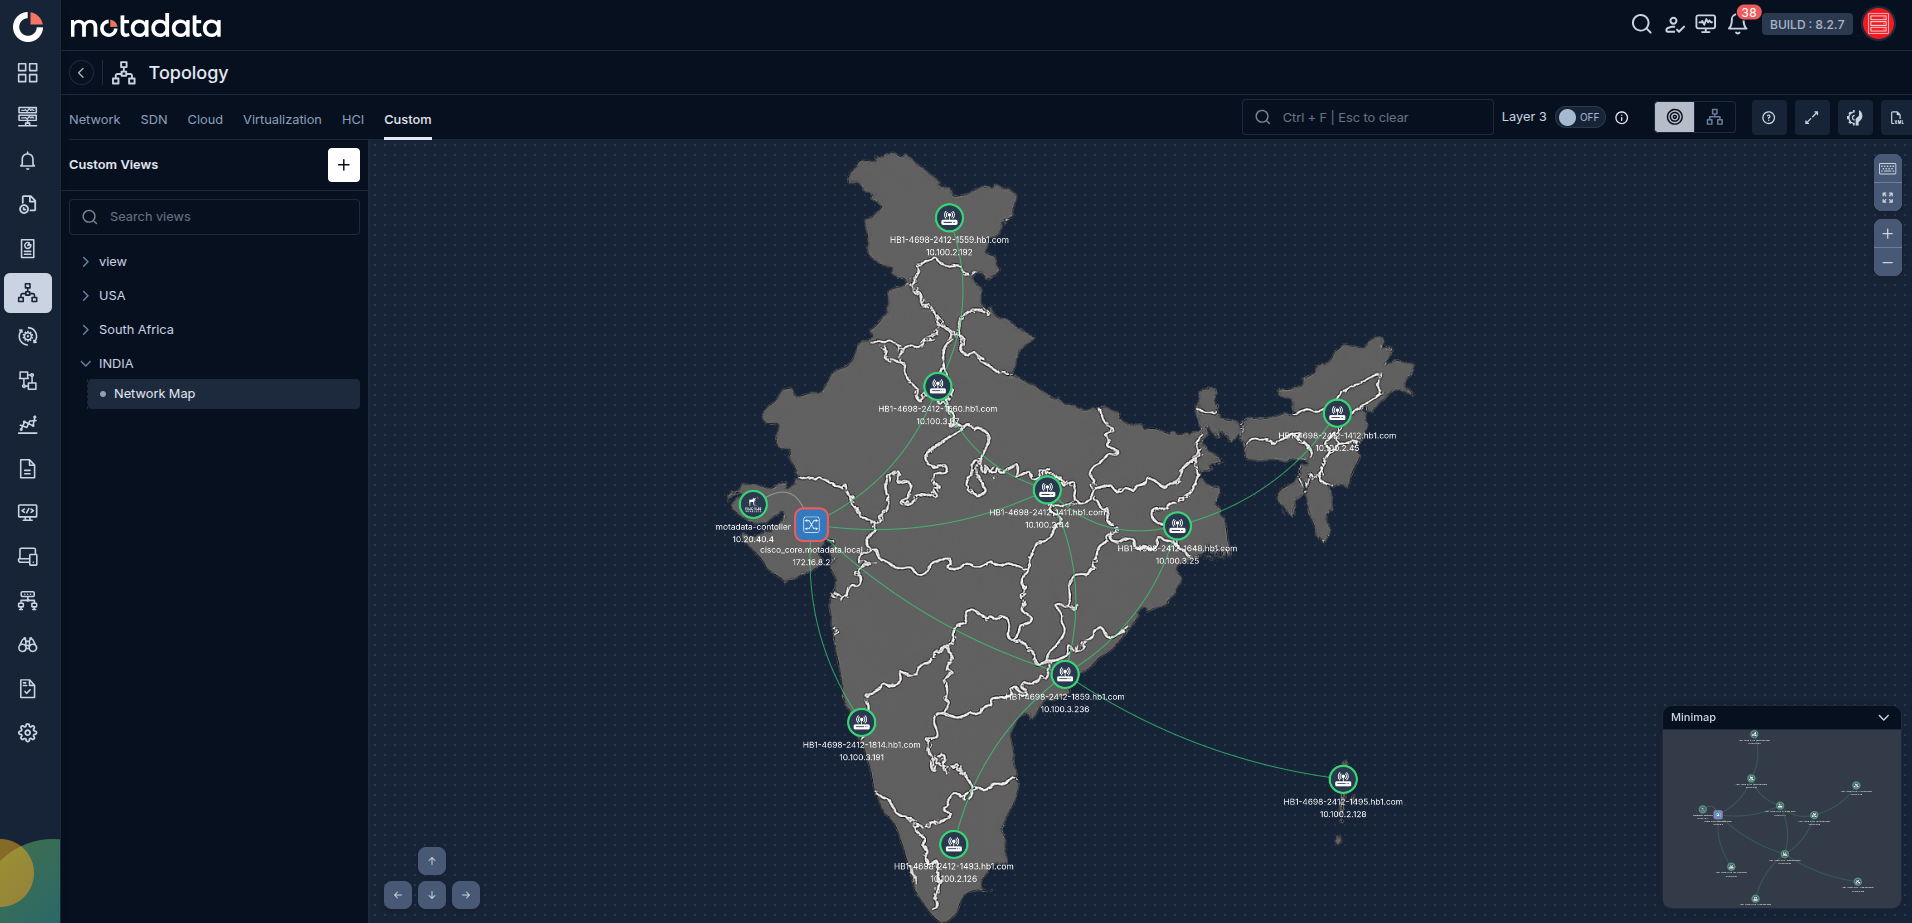
Topology Module Custom Views Introduced
Users can now create named Custom Views by selecting specific nodes, arranging them manually on the canvas, and saving the layout. Saved layouts persist between sessions with live status updates, so the nodes always reflect their current health state. Users can create multiple custom views, edit node selections, and delete views they no longer need.
Microsoft Graph API Email Delivery Added
With this release, ObserveOps adds Microsoft Graph API as a supported email delivery method alongside the existing SMTP options. This allows organizations that have disabled SMTP AUTH on Exchange Online to continue receiving alert notifications and scheduled reports without relying on SMTP. Configuration requires an Azure app registration with the Mail.Send application permission and admin consent. Switching to Microsoft Graph does not require changes to existing alert policies, notification templates, or recipient lists.
AWS Bedrock, SageMaker, Firehose, and Eight More Cloud Services Added
With this release, ObserveOps adds monitoring support for eleven new AWS cloud services: Amazon Bedrock, Amazon Kinesis Data Firehose, Amazon SageMaker, Amazon MQ, AWS WAF, AWS ACM, AWS KMS, AWS CloudTrail, Amazon Cognito User Pool, Amazon Athena, and AWS Config. All eleven services are discovered through the existing AWS credential profile using CloudWatch metrics, and their data is available in Metric Analysis and can be used to create alert policies.
ClickHouse Database Monitoring Added
With this release, ObserveOps adds dedicated monitoring support for ClickHouse. Key metrics include query throughput, failed queries, query latency percentiles, replication queue size, replication errors, merge operations, insert rates, memory usage, disk utilization, active connections, and ClickHouse Keeper health when Keeper is in use.
SLO Profile Clone Added
With this release, a Clone action is available on the SLO Profile listing page. Selecting Clone creates an independent copy of the selected profile in edit mode with the name pre-filled as "Copy of [Original Name]", which you can edit before saving. All profile fields are copied, including signal type, monitor selection, metric conditions, target thresholds, evaluation window, compliance period, correction profile, penalty profile, tags, and notification settings. Historical SLO data, compliance records, and active violations are not carried over to the clone.
Left Navigation Menu Scroll Support Added
With this release, the left navigation menu scrolls independently of the main content area when navigation items overflow the available screen height. This makes all navigation items reachable at high browser zoom levels (125%, 150%, 200%) and on lower-resolution screens without requiring users to adjust their zoom or display settings. Mouse wheel, scrollbar drag, touch, and keyboard navigation all work within the scrollable panel. No configuration is needed.
Force Delete Option for Monitors with Dependencies Added
With this release, a Force Delete option is available in the monitor actions menu for users with sufficient privileges. When a monitor has active dependencies such as alert policies, SLO profiles, dashboard widgets, or group memberships, the standard delete action is blocked. Force Delete removes the monitor and all its dependencies in a single operation after displaying a confirmation dialog that lists every object to be removed. The action is irreversible and is recorded in full in the audit log, including the monitor deleted, all dependencies removed, the user who performed the action, and the timestamp.
Hostname and FQDN-Based Links in Alert Email Notifications Added
With this release, administrators can configure a hostname, FQDN, or public URL in System Settings that ObserveOps uses as the base for all hyperlinks in alert email notifications. This replaces the previous behavior where notification links used the server's raw IP address, which was inaccessible to external recipients and exposed internal network details. If no hostname is configured, links continue to use the IP address. The setting applies globally to all alert notification policies with no policy-level changes required.
HPE 3PAR, Alletra, and Primera Enclosure Health Plugin Added
With this release, an out-of-the-box custom metric plugin is available in the Plugin Library for collecting enclosure-level hardware health from HPE 3PAR, HPE Alletra, and HPE Primera storage systems. The plugin connects and collects status for power supply units, fans, drive cages, temperature sensors, I/O modules, controller nodes, and battery modules. You can assign the plugin to existing HPE storage monitors to add physical hardware visibility alongside the storage performance metrics already collected.
Dell Compellent Storage Monitoring Added
With this release, ObserveOps adds monitoring support for Dell Compellent storage systems. Dell Compellent is discoverable through the Storage Discovery Profile by selecting Dell as the vendor and Compellent as the device model. Collected metrics include system information, volume capacity and IOPS, controller CPU and memory usage, disk health, and port status. All metrics are available in Metric Analysis.
Dell Isilon NL410 Storage Monitoring Added
With this release, ObserveOps adds monitoring support for Dell Isilon NL410 scale-out NAS systems. Dell Isilon is discoverable through the Storage Discovery Profile by selecting Dell as the vendor and Isilon as the device model. Collected metrics cover cluster health, per-node CPU and memory, NFS and SMB protocol throughput and latency, storage pool capacity, and SyncIQ replication status.
HPE Alletra Storage Monitoring Added
With this release, ObserveOps adds monitoring support for HPE Alletra all-NVMe storage systems. HPE Alletra is discoverable through the Storage Discovery Profile by selecting HPE as the vendor and Alletra as the device model. Collected metrics include volume capacity and performance, controller CPU and cache hit ratio, NVMe drive endurance, and replication status. All metrics are available in Metric Analysis.
UPS Device Monitoring Added
With this release, ObserveOps adds monitoring support for UPS (Uninterruptible Power Supply) devices via SNMP. UPS devices are discoverable through the Network Discovery Profile using SNMP V1, V2c, or V3 credentials. Collected metrics include battery charge level, remaining runtime, input and output voltage and frequency, output load percentage, and device status conditions such as on-battery and low-battery states. All metrics are available in Metric Analysis.
Extreme Wireless Controller Monitoring Added
With this release, ObserveOps adds monitoring support for Extreme Wireless controllers. Extreme Wireless is discoverable through the Wireless Discovery Profile using SNMP V1, V2c, or V3 credentials. Collected metrics include controller uptime, total AP count, connected client count, per-AP status and channel utilization, radio noise floor, and total transmit and receive throughput. All metrics are available in Metric Analysis.
Dell PowerVault Storage Monitoring Added
With this release, ObserveOps adds monitoring support for Dell PowerVault storage systems. Dell PowerVault is discoverable through the Storage Discovery Profile by selecting Dell as the vendor and PowerVault as the device model. Collected metrics include volume capacity and utilization, controller health, disk status, and port performance. All metrics are available in Metric Analysis.
NetRoute Multiple Source Support and One-Minute Polling Added
With this release, NetRoute supports multiple source interfaces for the same destination. You can now configure more than one source in a single NetRoute profile and ObserveOps tracks path data for every source independently, giving you a complete view of all available paths to a destination. The minimum polling interval for NetRoute has also been reduced to 1 minute, allowing faster path data refresh when tighter monitoring is needed.
PostgreSQL Replication and Archiver Monitoring Added
With this release, ObserveOps extends PostgreSQL monitoring to include primary-side replication and WAL archiver metrics. Replication lag is collected from the primary PostgreSQL node using pg_stat_replication and reported separately for each connected standby across sent, write, flush, and replay lag dimensions. WAL sender status and replication synchronization state are tracked per standby node. Archiver statistics are collected from pg_stat_archiver and report successful archive count, failed archive count, last archived WAL time, last failed WAL time, and an overall archiver status that distinguishes successful archive, failed archive, and no archive activity conditions. All metrics are available in Metric Analysis and can be used for alert policies, dashboards, and reports. PostgreSQL servers without standby nodes continue to monitor normally.
Datastore, Topology, and Flow Processing Performance Improved
With this release, several internal processing improvements reduce query latency and resource consumption. Topology dependency queries run approximately 97% faster through interface-name caching, which eliminates repeated lookups during hierarchy builds. Log and Flow data now use dedicated processing pipelines with independent worker and queue configuration, separating them from the general event datastore for more predictable throughput under load. The GeoDB lookup cache is now size-bounded to prevent unbounded memory growth during long-running deployments. Date and time formatting is non-blocking, removing event-loop contention under high ingestion rates.
Security Fixes
Security Vulnerabilities Addressed
The following security vulnerabilities have been addressed:
- OpenSSH Server Race Condition in sshd [CVE-2006-5051 / CVE-2024-6387 / CVE-2025-61984] - Resolved through Ubuntu's backported security patches applied to the underlying operating system.
- TLS/SSL Server Supports the Use of Static Key Ciphers - Resolved by disabling static RSA key exchange cipher suites in the JDK security configuration.
- TLS/SSL Weak Message Authentication Code Cipher Suites - Resolved by disabling weak MAC cipher suites in the JDK security configuration.