System Health Checks
Regularly performing these system health checks ensures high availability, optimal performance, and early detection of potential issues, minimizing service disruptions.
This guide provides a structured approach with specific commands for performing routine health checks on your ServiceOps environment. These checks are crucial for maintaining a stable and reliable system.
1. Application Services Health Check
Objective: To ensure all core ServiceOps application services are running correctly.
Frequency: Daily
Procedure:
Check Core Services: Verify that the main ServiceOps services are active.
- Linux
- Windows
Example: Check status of all key services with one command
systemctl status ft-main-server ft-analytics-server elasticsearch.serviceExample: Check status of multiple services
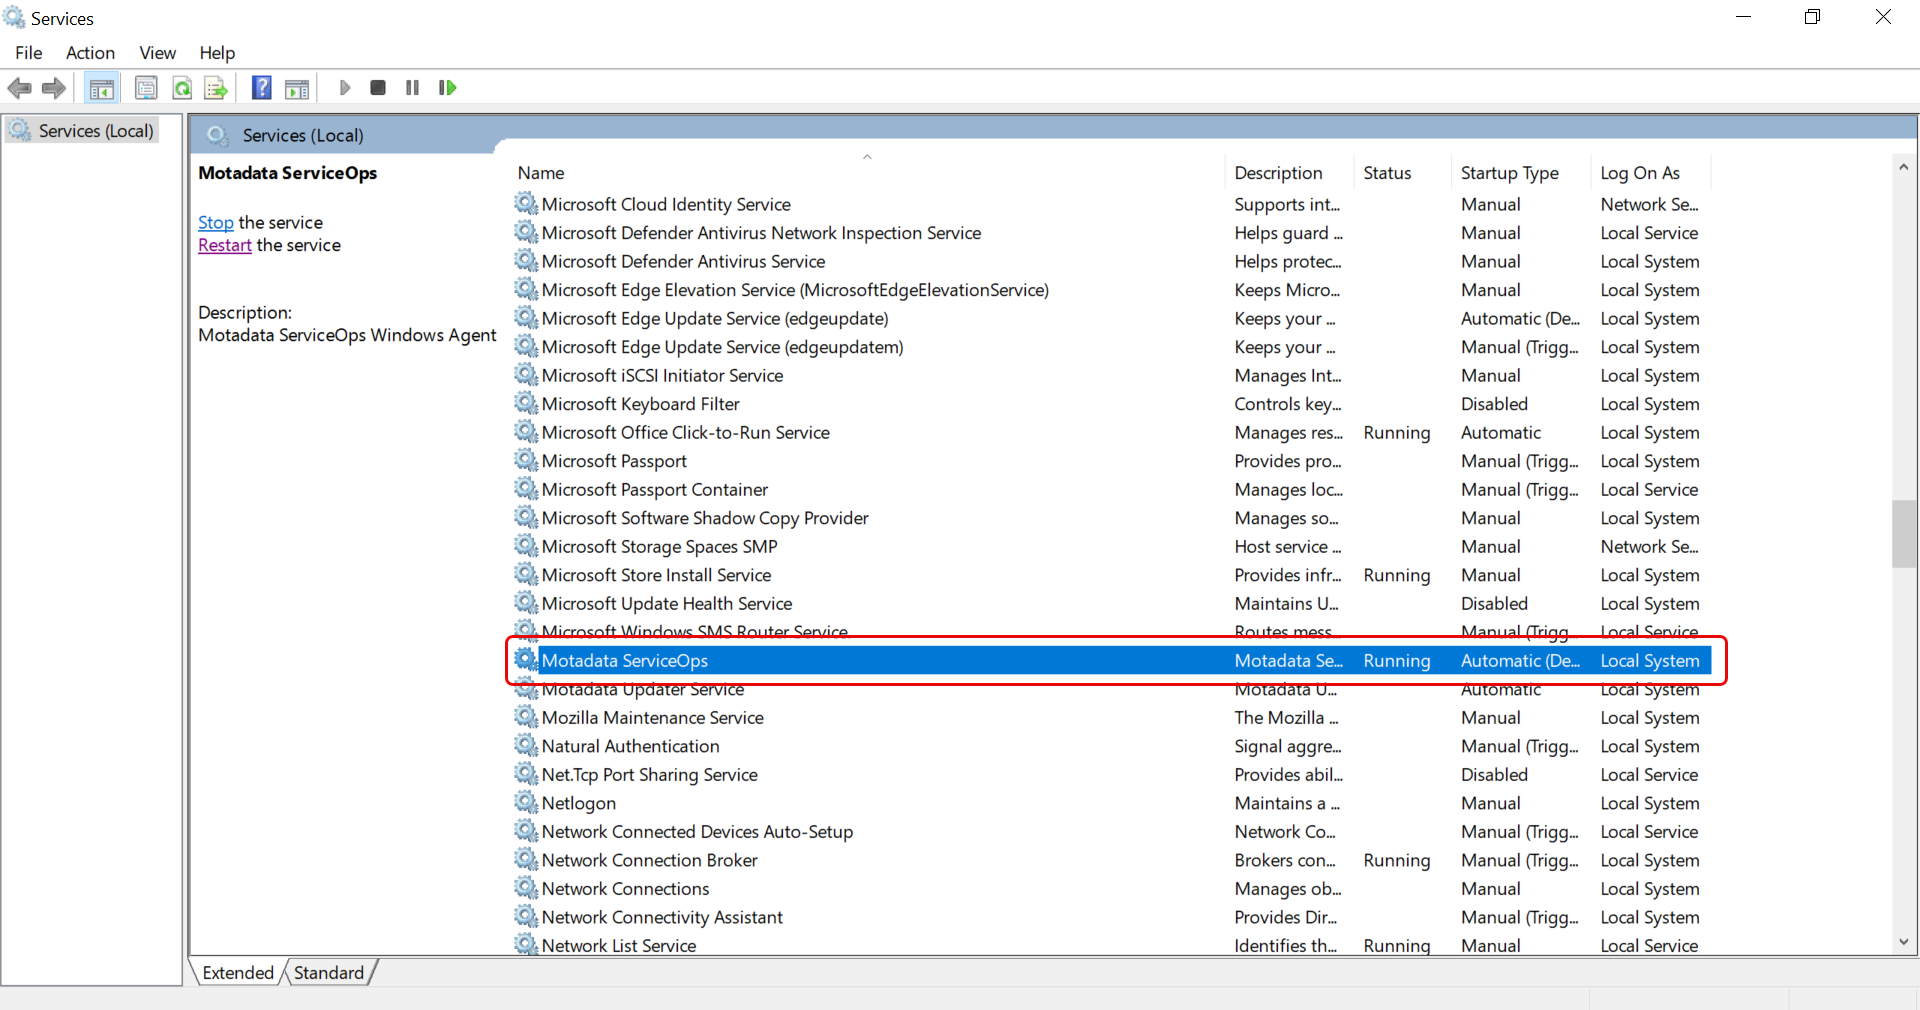
Check Services app for the agent service as shown below
Review System Logs: Check for any new errors since the last check.
Example: Check main server logs in real-time
tail -f /opt/flotomate/main-server/logs/system.logExample: Check analytics server logs in real-time
tail -f /opt/flotomate/cm-analytics/logs/system.log
2. Database Health Check
Objective: To ensure the PostgreSQL database is running, accessible, and performing optimally.
Frequency: Daily
Procedure:
Check PostgreSQL Service Status:
- Ubuntu/Debian
- RHEL/CentOS
Example: Check the status of the main PostgreSQL service
systemctl status postgresqlExample: The service name includes the version number on RHEL
systemctl status postgresql-16Test Database Connection: From the application server, attempt to connect to the database.
Syntax:
psql -h <DB_HOST_IP> -p <PORT> -U <USER> -d <DB_NAME>Example:
psql -h 172.16.13.40 -p 5432 -U postgres -d serviceopsExample: pg_lsclusters
Check Database Logs: Review the PostgreSQL logs for any errors.
Example: Watch the PostgreSQL log file for new entries Path may vary based on OS and version
tail -f /var/log/postgresql/postgresql-16-main.log
3. Server Resource Health Check
Objective: To monitor server resources to prevent performance degradation and outages.
Frequency: Daily
Procedure:
Check Disk Space: Verify that all server drives have adequate free space (>20%).
df -hCheck Disk I/O Performance: Ensure disk I/O speed is adequate (e.g., > 200 MB/s).
Example: This creates a 1GB test file in /tmp. Use with caution.
dd if=/dev/zero of=/tmp/test1.img bs=1G count=1 oflag=dsyncMonitor CPU and Memory: Check the current CPU and memory utilization.
Example: Display real-time process and resource usage (Press 'q' to exit)
topExample: Get a snapshot of memory usage using the below command:
free -h
4. Network Connectivity Health Check
- Objective: To ensure the ServiceOps server can communicate with critical internal and external services.
- Frequency: Daily
- Procedure:
Database Connectivity: Ping the database server from the application server.
Syntax:
ping <DATABASE_SERVER_IP>Example:
ping 172.16.13.40Check Port Connectivity: Use
telnetorncto confirm the database port is open.Syntax:
nc -zv <DATABASE_SERVER_IP> <PORT>Example:
nc -zv 172.16.13.40 5432
5. Backup and Recovery Health Check
Objective: To ensure data can be recovered in case of a disaster.
Frequency: In case of disaster, perform the backup and recovery health check.
Procedure:
Daily Verification: Confirm that the automated database backups completed successfully by checking the backup logs from the service.log file. You can view the file as a root user from the below path:
/opt/flotomate/main-server/logs/commonWeekly Backup Integrity Check: Use
pg_restoreto list the contents of a backup file. This verifies that the backup is readable without performing a full restore.Syntax:
pg_restore --list <PATH_TO_BACKUP_FILE>Example:
pg_restore --list /home/motadata/backupDB_12-03-2025/flotoitsmdb_dump | head -10Monthly Restore Test: Perform a test restore of the database to a separate, non-production environment.
6. Security Health Check
Objective: To ensure the system remains secure.
Frequency: Weekly
Procedure:
SSL Certificates: Verify that all SSL/TLS certificates are valid and not nearing their expiration date.
To check the SSL certificate details and expiry date, you can use the following
opensslcommand. Replaceyour-domain.comwith your actual domain.openssl s_client -connect your-domain.com:443 -servername your-domain.com | openssl x509 -noout -datesAlternatively, you can check the certificate directly in your web browser:
- Access your application using HTTPS.
- Click the lock icon in the address bar.
- View the certificate details to verify its validity and domain match.
Firewall Rules: Ensure the necessary ports are open and that no unauthorized ports are exposed.
- Linux
- Windows
Example: Check the status and rules for UFW (Uncomplicated Firewall)
sudo ufw statusExample: Get all enabled, inbound firewall rules that allow traffic
Get-NetFirewallRule -Action Allow -Enabled True -Direction Inbound | Select-Object DisplayName,LocalPort