6.2.3. Monitor Slider
Monitor slider is a quick view of the monitor details. Click on the IP address/HOST name of the monitor to open the slider. Alternatively, you can click on the external link icon to open monitor-details page in a new tab.
Note
Monitor sliders are available throughout the Motadata application. Click on the monitor name, anywhere in the application, it will open monitor slider.
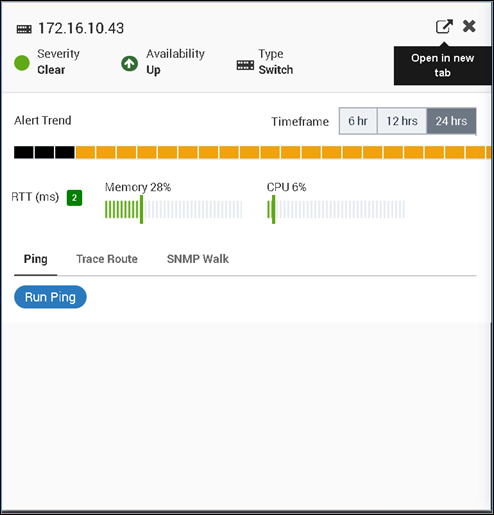
Monitor Slider
The slider contains following details:
Severity: Displays current severity of the monitor
Availability: Displays current availability of the monitor
Device Type: Shows the device type of the monitor
Alert Trend: Hourly alerts can be seen here in 6hrs, 12 hrs and 24 hrs timeline.
Plugin Metrics Parameter: You can monitor the real time plugin metrics information in monitor slider screen as per network device selection.
For example: For ping type network devices like: RTT, Memory and CPU, you can see the ping type plugin metrics information. In case when device is down, unreachable or has no information, metrics parameter will display N/A.
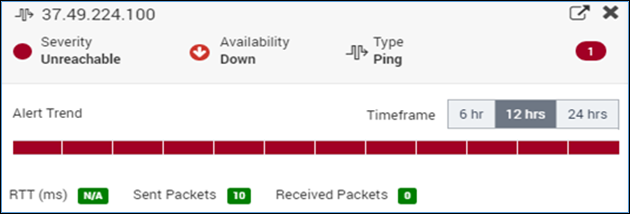
Metric Parameters when Device is Down
Ping Trace and SNMP Walk: You can run ping and trace route for a network device; and ping, trace route, and SNMP walk for an SNMP device.
Ping: You can Run Ping for a device and it will display ping details as below:
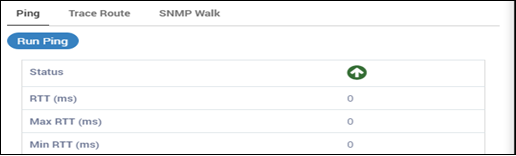
Run Ping for Device
Trace: Trace route details can be tracked as shown below:
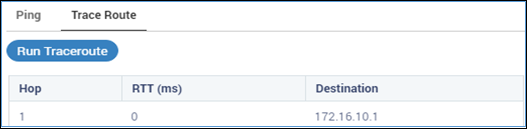
Trace Route of Device
SNMP Walk: If you have any SNMP device in Motadata then SNMP walk option will be enabled and will display below information once you run it.
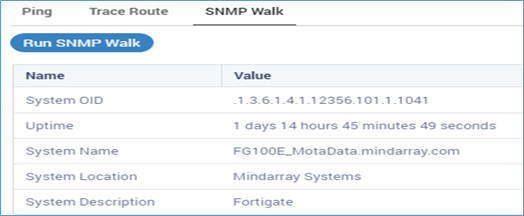
SNMP Walk Values of SNMP Device