6.2.4. Actions
Discovered monitors get polled based on defined Metric Collection Time. These are following a set of actions available for all the monitors.
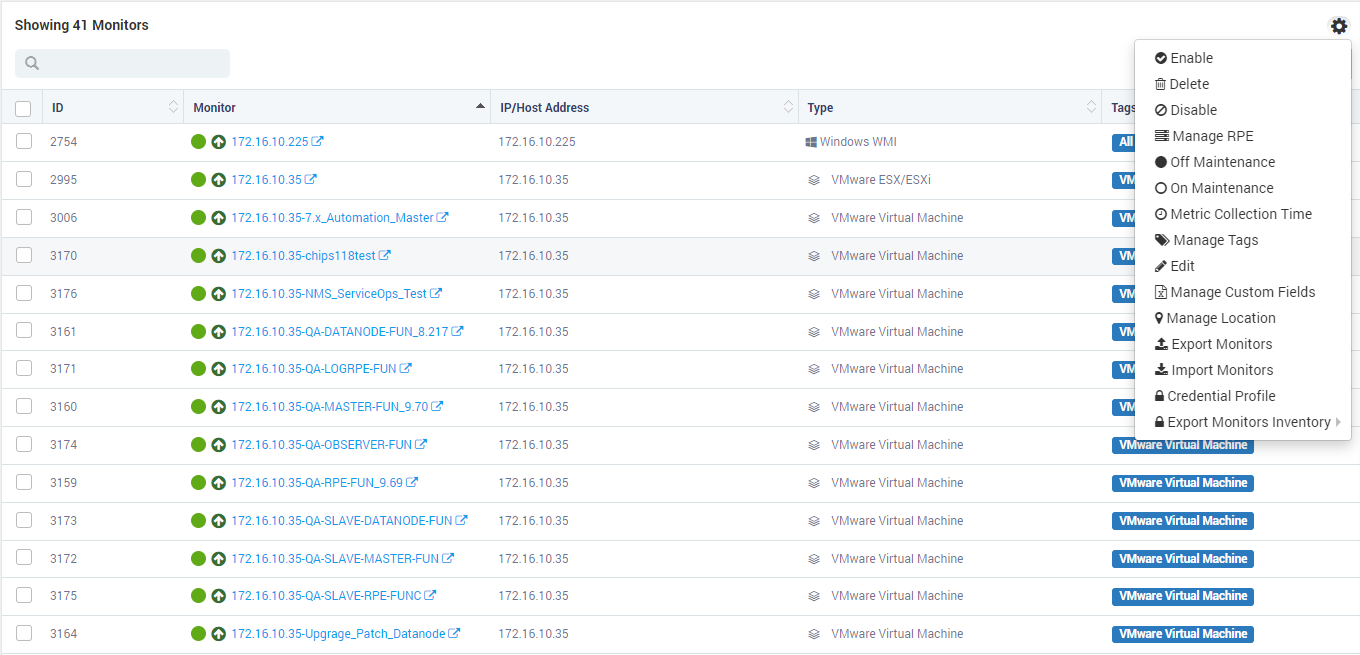
Actions List of Monitors
Enable: Click to enable the monitors. Motadata polls data of the enabled Monitors and sends you alerts of it (click on the checkbox to select monitors).
Delete: Click to delete the monitors you selected using checkbox. Motadata stops all the services for the deleted monitors and remove the entry from the system.
Disable: Click to disable the monitors you selected using checkbox. Motadata do not poll the disabled monitors or generate alerts for them.
Manage RPE: Click to change the remote polling engine for the monitors you selected using checkbox. RPE is used to manage the load on the Motadata server and poll the monitors using third server. You can manage the RPE (remote polling engine) here.
Off Maintenance: Click to turn OFF the maintenance for monitors you selected using checkbox. Motadata will again start polling the monitors and generate the alerts.
On Maintenance: Click to turn ON the maintenance for monitors you selected using checkbox. Motadata do not poll the monitors or generate the alerts.
Metric Collection Time: Click to change the metric collection time (Poll Time) from here. Select the monitors (of same type only) and click on metric collection time. A popup will display metric and poll time. Edit the record to update the poll time.
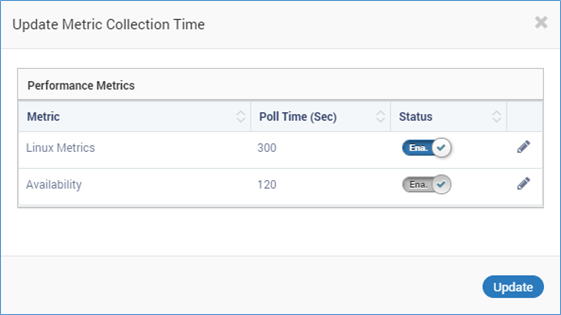
Metric Collection Time configuration
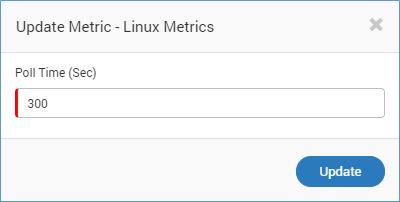
Metric Poll Time Values in Seconds
Manage Tags: You can manage tags related to the selected Monitors (click on the checkbox to select Monitor) by clicking on Manage tags. In Motadata you can sort the data based on Tags. You can also create report and alerts based on tags. You can even visualize network topology based on tags.
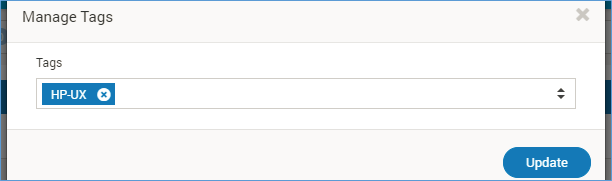
Search Monitors by Tags
Edit: To edit the properties associated with the selected monitors (click on the checkbox to select Monitor) go to Monitors > Actions > Edit. The properties have a pre-defined list. Click on the property name and change the value under it. The custom fields like group, environment etc. for the monitors are decided from here.
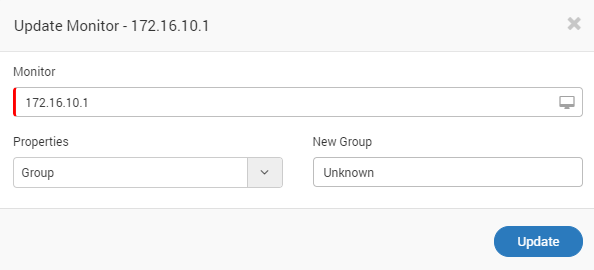
Editing the Properties of a Monitor
Manage Custom Fields: During discovery of devices the sample csv would be be present with fields name so that user can fill up the data. New more fields can also be added as per the requirement in the CSV.
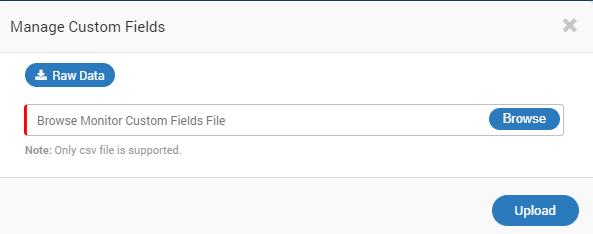
Manage the custom fields
Manage Location: You can specify the location of any monitor by navigating to Monitors > Actions > Manage Location. You need to specify the longitude and latitude of the location where the selected monitor is situated. To update the location for multiple monitors you upload a CSV file. In CSV, mention the name of the Monitor in column 1, longitude in column 2 & latitude in column 3. This widget is useful when widgets involve Google Maps.
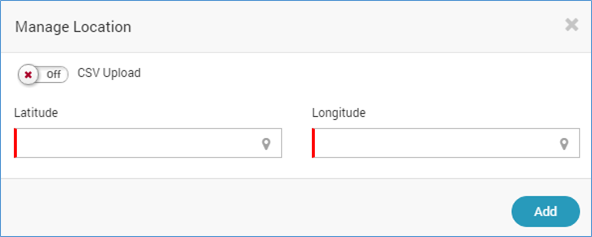
Manage Location Configuration
Export Monitors: If there is another Motadata server, you can export specific monitors from current Motadata server to other Motadata server. Select the monitors from the current server and click on “Export Monitors”. A file will automatically download with .config extension. The downloaded file contains all the attributes like tags, department etc. associated with the selected monitors. The config file also contains the credential profiles.
Import Monitors: Upload the exported config file. The monitors in excel will show up along with the associated attributes like tags, departments etc. Motadata will create the required credential profiles. Hence, you don’t need to create the credential profiles for any of the monitor.
Credential Profile: You can assign a credential profile to the selected monitors. Credential profile is useful in Network Discovery Settings.
Export Monitors Inventory: You can generate a CSV and PDF file of the monitors inventory. The inventory shows the list of the monitors filtered by their provisioned date. When you select this option, Motadata shows a popup to select a date filter.
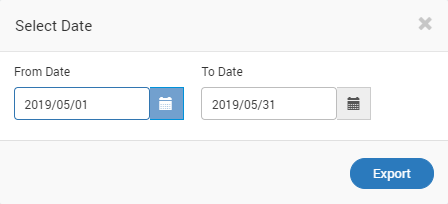
Select Provisioning Date Filter
In the popup select the ‘From Date’ and ‘To Date’. Motadata will find all the monitors provisioned in-between these dates. You can choose your custom time range to see the new monitors provisioned in that period. It will generate your selected excel/PDF file with following columns:
Monitor ID
Monitor Type
Monitor Name
Tags
RPE
Departments
Created Date
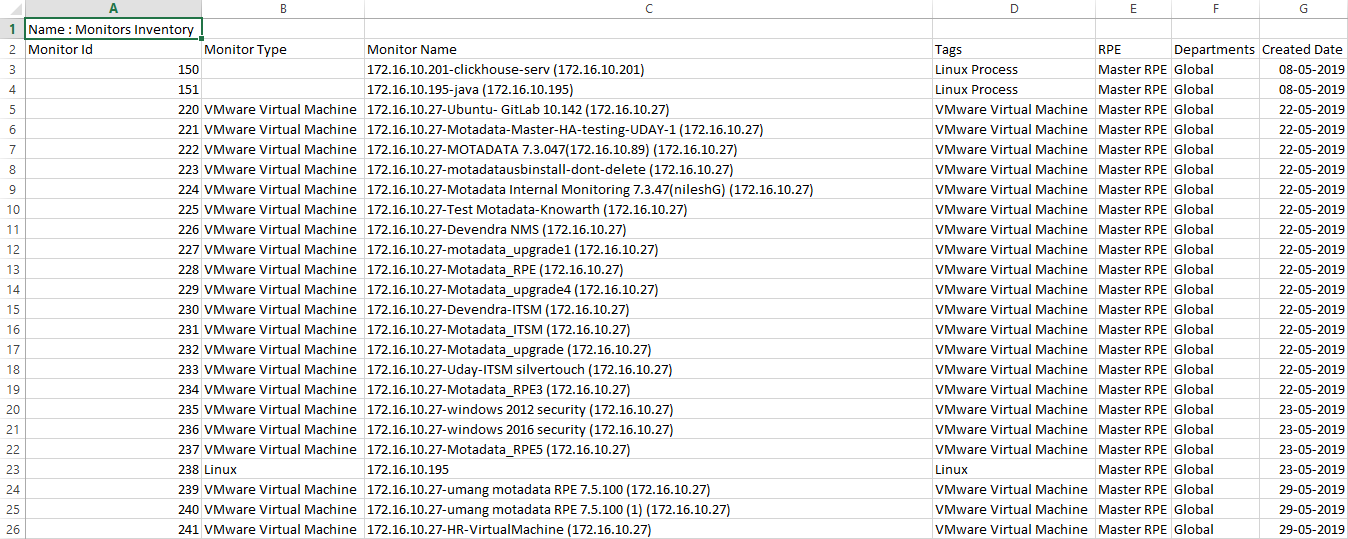
Sample Report of Monitors Inventory